. 2025 Aug 19;135(20):e184325.
doi: 10.1172/JCI184325. eCollection 2025 Oct 15.

Hypertension promotes bone loss and fragility by favoring bone resorption in mouse models

Affiliations

Hypertension promotes bone loss and fragility by favoring bone resorption in mouse models

Elizabeth M Hennen et al. J Clin Invest. .

Abstract

Inflammatory diseases contribute to secondary osteoporosis. Hypertension is a highly prevalent inflammatory condition that is clinically associated with reduced bone mineral density and increased risk of fragility fracture. In this study, we showed that a significant loss in bone mass and strength occurs in two preclinical models of hypertension. This accompanied increases in immune cell populations, including monocytes, macrophages, and IL-17A-producing T cell subtypes in the bone marrow of hypertensive mice. Neutralizing IL-17A in angiotensin II-infused mice blunted hypertension-induced loss of bone mass and strength as a result of decreased osteoclastogenesis. Likewise, the inhibition of the CSF1 receptor blunted loss of bone mass and prevented loss of bone strength in hypertensive mice. In an analysis of UK Biobank data, circulating bone remodeling markers exhibited striking associations with blood pressure and bone mineral density in more than 27,000 humans. These findings illustrate a potential mechanism by which hypertension activates immune cells in the bone marrow, encouraging osteoclastogenesis and eventual loss in bone mass and strength.

Keywords: Bone biology; Bone disease; Bone marrow; Hypertension; Immunology; Inflammation.


Conflict of interest statement

Conflict of interest: The authors have declared that no conflict of interest exists.

Figures

Figure 1
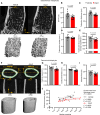
Figure 1. Trabecular architecture of the distal femoral metaphysis and cortical structure of the femoral mid-diaphysis from vehicle- and Ang II–infused mice.
(A) Representative images of 2D (top) and 3D (bottom) renderings of the metaphysis. (BF) μCT-derived parameters, including trabecular BV/TV (B), thickness (C), number (D), and tissue mineral density (E). (F) Representative images of 2D (top) and 3D (bottom) rendering of the diaphysis. (G and H) μCT-derived parameters, including cortical area (G) and thickness (H). (I) The ultimate force from 3-point bending. (J) Correlation of section modulus and ultimate moment (Newton*millimeters, Nmm) for vehicle-infused (black) and Ang II–infused (red) mice. C, E, G, and H were analyzed by unpaired t test. B, D, and I were analyzed by Mann-Whitney test. J was analyzed by nonlinear regression. SEM is shown. Sample size: Vehicle, n = 15; Ang II, n = 16. Scale bars: 200 μm.
Figure 2
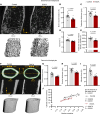
Figure 2. Trabecular architecture of the distal femoral metaphysis and cortical structure of the femoral mid-diaphysis from control and DOCA-salt mice.
(A) Representative images of 2D (top) and 3D (bottom) renderings of the metaphysis. (BF) Quantification of trabecular BV/TV (B), thickness (C), number (D), and tissue mineral density (E). (F) Representative images of 2D (top) and 3D (bottom) rendering of the diaphysis. (G and H) Quantification of cortical area (G) and thickness (H). (I) Ultimate force. (J) Correlation between section modulus and ultimate moment for control (black) and DOCA-salt (red) mice. C, D, and FH were analyzed by unpaired t test. B, E, and I were analyzed by Mann-Whitney test. J was analyzed by nonlinear regression. SEM is shown. Sample size: Control, n = 16; DOCA, n = 12. Scale bars: 200 μm.
Figure 3
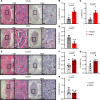
Figure 3. Histological analysis of hematoxylin and eosin– and TRAP-stained sections of the lumbar spine.
(A and E) Representative histological images. Hematoxylin and eosin–stained (H&E-stained) and TRAP-stained sections are shown at 2 views (original magnification, ×4 at left and ×20 at right). Left scale bars: 200 μm; right scale bars: 50 μm. (B and F) Quantification of the number of osteoclasts (N.Oc) divided by bone surface (BS) from both models of hypertension. (C and G) Quantification of the osteoclast surface (Oc.S) divided by BS from both models of hypertension. (D and H) Quantification of the number of osteoblasts (N.Ob) divided by BS from both models of hypertension. Unpaired t test was used. SEM is shown. Sample size: Vehicle, n = 6; Ang II, n = 6–8; control, n = 6–8; DOCA, n = 6–8.
Figure 4
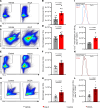
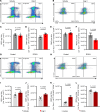
Figure 4. Flow cytometric analysis of the bone marrow in both models of hypertension for monocytes and macrophages.
(A and B) Representative gating for monocytes (A) and quantification of monocytes (B) from vehicle- and Ang II–infused mice. (C and D) Representative gating for macrophages (C) and quantification of macrophages (D) from vehicle- and Ang II–infused mice. (EH) Gating and quantification of monocytes and macrophages in the bone marrow of control and DOCA mice, respectively. (I and J) Quantification of Ccr2+ macrophages in the bone marrow of vehicle- and Ang II–infused mice. (K and L) Quantification of Ccr2+ macrophages in the bone marrow of control and DOCA mice. Unpaired t test was used. SEM is shown. Sample size: Vehicle, n = 5–7; Ang II, n = 5–8; control, n = 8; DOCA, n = 5–6.
Figure 5
Figure 5. Flow cytometric analysis of bone marrow progenitor populations in both models of hypertension.
(A, B, G, and H) Representative flow gates for HSCs (A and G) and myeloid progenitors (B and H). (C and I) Quantification of HSCs. (D and J) Quantification of CMPs. (E and K) Quantification of GMPs. (F and L) Quantification of MEPs. CF, I, K, and L were analyzed by unpaired t test. Mann-Whitney test was used for J. SEM is shown. Sample size: Vehicle, n = 5; Ang II, n = 5; control, n = 8; DOCA, n = 6.
Figure 6
Figure 6. Concentration of pro-osteoclastic cytokines in the bone marrow from both models of hypertension.
(A and B) The concentration of CSF1 in the bone marrow from the Ang II model (A) or DOCA-salt model (B). (C and D) The concentration of RANKL in the bone marrow from the Ang II model (C) or DOCA-salt model (D). All panels were analyzed using unpaired t tests. Sample size: Vehicle, n = 5; Ang II, n = 5; control, n = 10; DOCA, n = 6.
Figure 7
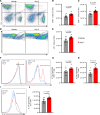
Figure 7. Flow cytometric analysis of T cells and their activation in the bone marrow.
(A, D, F, and I) Representative images of gating for T cell subtypes (A and D) or IL-17A by T cell subtypes (F and I). (B, C, and E) Quantification of T cell subtypes. (G, H, and J) Quantification of IL-17A presentation by T cell subtypes. B, C, E, G, H, and J were analyzed by unpaired t test. SEM is shown. Sample size: Vehicle, n = 7; Ang II, n = 8.
Figure 8
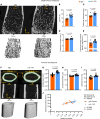
Figure 8. Trabecular architecture of the distal femoral metaphysis and cortical structure of the femoral mid-diaphysis from Ang II–infused mice treated with IgG or α-IL–17A.
(A) Representative images of 2D (top) and 3D (bottom) renderings of the metaphysis. (BF) Quantification of trabecular BV/TV (B), thickness (C), number (D), and tissue mineral density (E). (F) Representative images of 2D (top) and 3D (bottom) rendering of the diaphysis. (G and H) Cortical area (G) and thickness (H). (I) Ultimate force. (J) Correlation of section modulus and ultimate moment for IgG-treated (orange) and α-IL-17A–treated (blue) mice. B, C, E, and GI were analyzed by unpaired t test. D was analyzed by Mann-Whitney test. J was analyzed by nonlinear regression. SEM is shown. Sample size: IgG, n = 8; α-IL-17A, n = 10. Scale bars: 200 μm.
Figure 9
Figure 9. Analysis of osteoclasts in the bone and bone marrow from Ang II–infused IgG- or α-IL-17A–treated mice.
(A) H&E-stained and TRAP-stained sections at 2 views (original magnification, ×4 at left and ×20 at right). Left scale bars: 200 μm; right scale bars: 50 μm. (BD) Quantification of differences in osteoclast number (B) or surface (C) and osteoblast number (D). (E) The concentration of CSF1 in the bone marrow. (F) The concentration of RANKL in the bone marrow. (G) The relative expression of osteoclast-related transcripts. BE were analyzed by unpaired t test. F and G were analyzed by Mann-Whitney test. SEM is shown. Sample size: IgG, n = 5–7; α-IL-17A, n = 6–10.
Figure 10
Figure 10. Trabecular architecture of the distal femoral metaphysis and cortical structure of the femoral mid-diaphysis from Ang II–infused mice treated with placebo or PLX5622.
(A) Representative images of μCT 2D (top) and 3D (bottom) renderings of the distal femoral metaphysis. (BF) Quantification of trabecular BV/TV (B), thickness (C), separation (D), and tissue mineral density (E). (F) Representative images of μCT 2D (top) and 3D (bottom) rendering of the femoral mid-diaphysis. (G and H) Quantification of cortical area (G) and thickness (H). (I) Ultimate force. (J) The correlation between section modulus and ultimate moment for placebo (orange) and PLX5622 (green) mice. BE, G, and H were analyzed by unpaired t test. H was analyzed by Mann-Whitney test. J was analyzed by nonlinear regression. SEM is shown. Sample size: placebo, n = 11; PLX5622, n = 12. Scale bars: 200 μm.
Figure 11
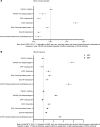
Figure 11. Forest plot of areal BMD or blood pressure versus normalized protein concentration (NPX) of bone remodeling biomarkers from patients of White ethnicity in the UK Biobank.
(A) Beta values (g/cm2/NPX, 95% CI) comparing areal BMD versus NPX. (B) Beta values (mmHg/NPX, 95% CI) for SBP and DBP. Significance is denoted by the confidence interval not overlapping with the vertical dotted line. Data were adjusted for BMI, age, sex, smoking status, and alcohol intake frequency estimated at baseline. A consists of approximately 36,000 UK Biobank subjects (random subsample), while B sampled 27,000 subjects not on blood pressure–lowering drugs.

References

    1. Sozen T, et al. An overview and management of osteoporosis. Eur J Rheumatol. 2017;4(1):46–56. doi: 10.5152/eurjrheum.2016.048. - DOI - PMC - PubMed
    1. Compston JE, et al. Osteoporosis. Lancet. 2019;393(10169):364–376. doi: 10.1016/S0140-6736(18)32112-3. - DOI - PubMed
    1. Cappuccio FP, et al. High blood pressure and bone-mineral loss in elderly white women: a prospective study. Study of Osteoporotic Fractures Research Group. Lancet. 1999;354(9183):971–975. doi: 10.1016/S0140-6736(99)01437-3. - DOI - PubMed
    1. Afghani A, Johnson CA. Resting blood pressure and bone mineral content are inversely related in overweight and obese Hispanic women. Am J Hypertens. 2006;19(3):286–292. doi: 10.1016/j.amjhyper.2005.10.024. - DOI - PubMed
    1. Ye Z, et al. Association between essential hypertension and bone mineral density: a systematic review and meta-analysis. Oncotarget. 2017;8(40):68916–68927. doi: 10.18632/oncotarget.20325. - DOI - PMC - PubMed

MeSH terms

Substances