. 2025 Aug 19;18(900):eadt8127.
doi: 10.1126/scisignal.adt8127. Epub 2025 Aug 19.

Amylin receptor subunit interactions are modulated by agonists and determine signaling

Affiliations

Amylin receptor subunit interactions are modulated by agonists and determine signaling

Sandra E Gostynska et al. Sci Signal. .

Abstract

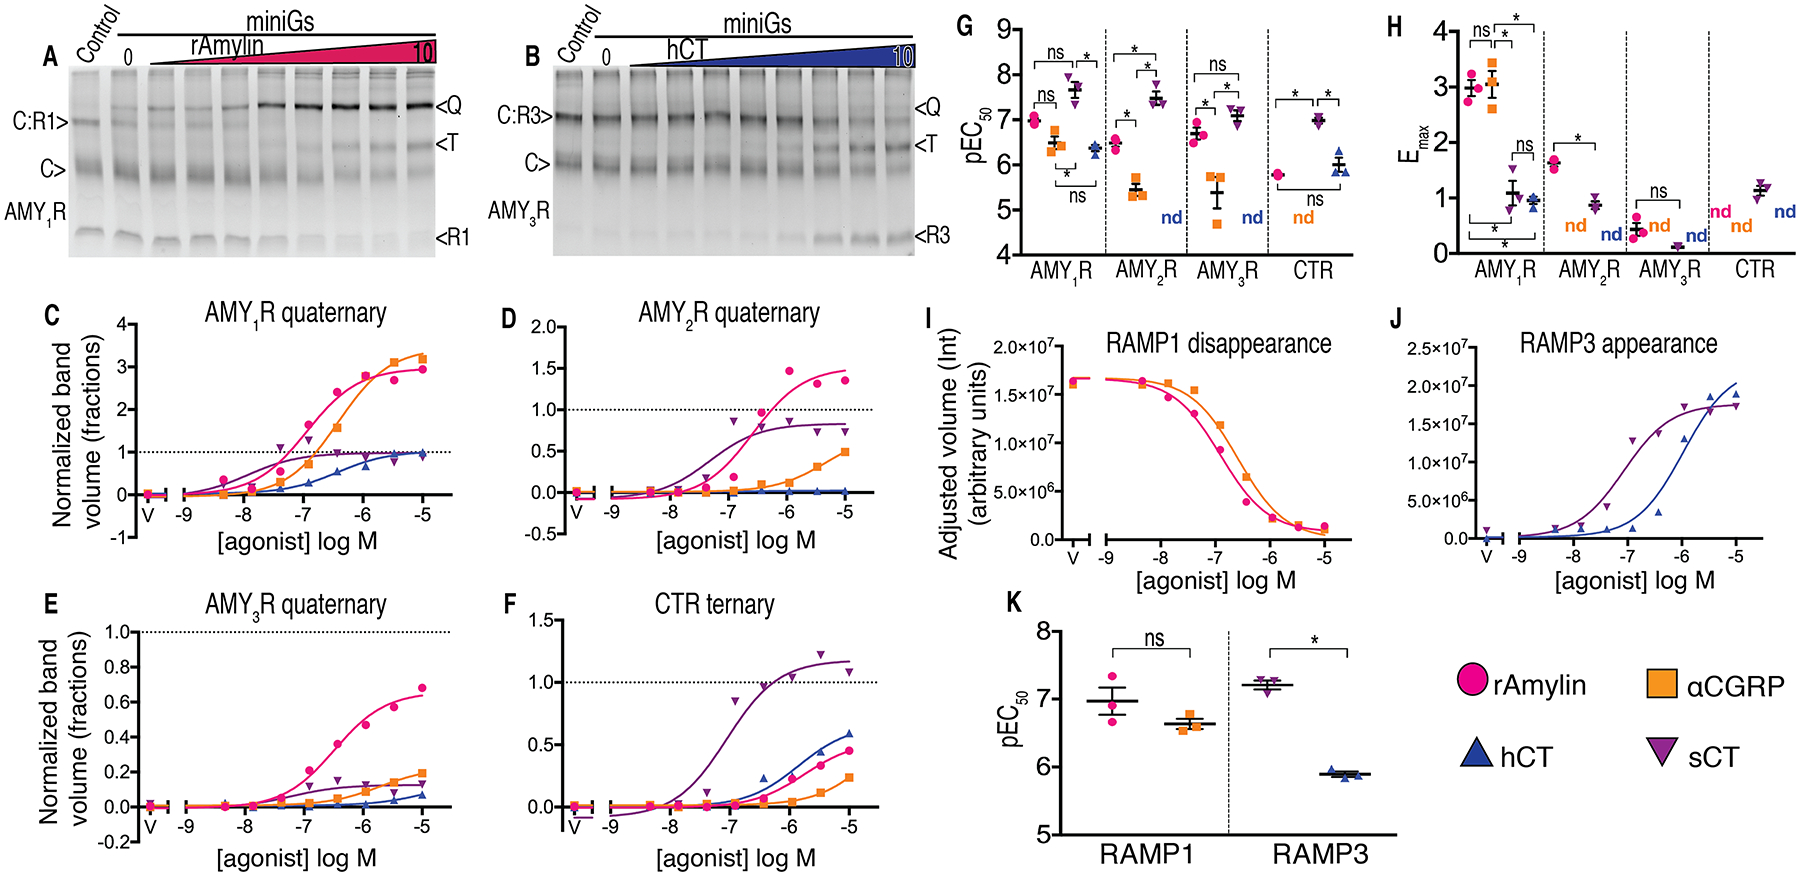
Three amylin receptors (AMYRs) mediate the metabolic actions of the peptide hormone amylin and are drug targets for diabetes and obesity. AMY1R, AMY2R, and AMY3R are heterodimers consisting of the calcitonin receptor (CTR), a G protein-coupled receptor, paired with a RAMP1, RAMP2, or RAMP3 accessory subunit, respectively, which increases amylin potency. Here, we found that the AMYRs had distinct basal subunit equilibria that were modulated by peptide agonists and determined the extent of cAMP signaling downstream of receptor activation. By developing a biochemical assay that resolves the AMYR heterodimers and free subunits, we found that the AMY1R and AMY2R subunit distributions favored free CTR and RAMPs and that rat amylin promoted association of the constituent subunits of AMY1R and AMY2R. The agonist αCGRP also induced AMY1R subunit association. A stronger interaction between the CTR and the RAMP3 transmembrane domains yielded a more stable AMY3R, and human and salmon calcitonin agonists promoted AMY3R dissociation. Similar changes in subunit association and dissociation were observed in live-cell membranes, and G protein coupling and cAMP signaling assays showed how these changes altered signaling. Our findings have implications for AMYR biology and drug development and reveal regulation of heteromeric GPCR signaling through subunit interaction dynamics.


Conflict of interest statement

Competing interests: The authors declare that they have no competing interests.

Figures

Fig. 1.
Fig. 1.. Visualization of free RAMP and CTR subunits and AMYR heterodimers in the absence or presence of agonists and miniGs by native PAGE mobility shift assay in detergent.
(A) Cartoon depicting the positions of the mCitrine-MBP tag on the CTR (C) and RAMPs (R) and of the SUMO (S) tag on miniGs (mGs). (B to D) Distribution of five molecular species of CTR (C), CTR:RAMP (C:R), RAMP (R), ternary complex (T), and quaternary complex (Q) formed in the presence or absence of the indicated peptide agonist (10 μM) and/or purified SUMO-miniGs (50 μM) for co-expressed (B) CTR and RAMP1 (AMY1R), (C) CTR and RAMP2 (AMY2R), and (D) CTR and RAMP3 (AMY3R) in hrCNE gradient gels (7 to 10%). Representative gels for one of four biological replicates are shown with imaging for in-gel mCitrine fluorescence. (E to I) Densitometry quantitation of the indicated heterodimer (H), quaternary complex (Q), and free RAMP bands with normalization to the relevant control lane band density. The plots depict combined data from four independent biological replicates. The asterisk indicates statistical significance as compared to a chosen reference condition (indicated by the cross) and determined by one-way ANOVA with Tukey’s post hoc test. *P < 0.05; ns, not significant.
Fig. 2.
Fig. 2.. Quantitation of AMYR quaternary complexes, CTR ternary complexes, and free RAMP1 to RAMP3 subunits from the agonist titration native PAGE mobility shift experiments.
(A and B) Titrations of rAmy and hCT titrations (highest concentration: 10 μM) in the presence of 50 μM SUMO-mGs, showing fluorescent bands for the co-expressed (A) CTR and RAMP1 (AMY1R) and (B) CTR and RAMP3 (AMY3R). The gel is representative of three independent biological replicates. (C to F) Quantification of quaternary (Q) and ternary (T) complexes band intensities by densitometry for (C) AMY1R, (D) AMY2R, (E) AMY3R, and (F) CTR. Data are the quantitated gel band densities and were normalized to the heterodimer or free CTR band densities in the control lane and are represented as fractions. (G) Scatter plot summarizing the replicate pEC50 ± SEM values for the agonist titrations shown in (C to F). (H) Scatter plot summarizing the replicate Emax ± SEM values from (C to F); nd, not determinable. See table S1 for a summary of the pEC50 and Emax values. (I and J) Quantitation of the reduction in band intensity of free RAMP1 (I) and the increase in band intensity of free RAMP3 (J). (K) Scatter plot showing the replicate pEC50 ± SEM values for the loss of free RAMP1 (pEC50_rAmy = 6.97 ± 0.2 and pEC50_αCGRP = 6.63 ± 0.07) and the appearance of free RAMP3 (pEC50_sCT = 7.21 ± 0.07 and pEC50_hCT = 5.89 ± 0.04). The plots in (C to F) and (I and J) are representative of a single set of gels. Scatter plots in (G, H, and K) show the values from three independent biological replicates. Data were analyzed by one-way ANOVA with Tukey’s post hoc test. *P < 0.05; ns, not significant.
Fig. 3.
Fig. 3.. CTR:RAMP cell surface subunit proximity BRET assay in live HEK293 cells.
(A) Cartoon depicting the positions of the HiBiT tag on the CTR and the mCitrine tag on the RAMP, enabling signal measurement from CTR:RAMP heterodimers. (B to D) Real-time kinetic CTR:RAMP proximity BRET was measured for co-expressed (B) CTR and RAMP1 (AMY1R), (C) CTR and RAMP2 (AMY2R), and (D) CTR and RAMP3 (AMY3R). A baseline was established for the first 5 min, which was followed by the addition of 300 nM agonist, as indicated by the arrow. (E and F) CTR:RAMP1 (AMY1R) and CTR:RAMP3 (AMY3R) in the endpoint concentration-response format. See table S3 for a summary of the pEC50 values from three independent biological replicates. (G) Real-time kinetic reversibility for co-expressed CTR:RAMP1 (AMY1R) with first addition of rAmy or hCT (each at 50 nM) followed by a second addition of 1 μM hCT or sCT or 1 μM rAmy or αCGRP, respectively, as indicated. All plots are representative of three independent biological replicates at room temperature, showing means ± SD for duplicate technical replicates.
Fig. 4.
Fig. 4.. miniGs and heterotrimeric G protein coupling BRET assays for the AMY1R, AMY2R, AMY3R and CTR in live 3GKO HEK293 or permeabilized HEK293 cells.
(A) Cartoon depicting the positions of the Rluc8 donor and Venus acceptor used to isolate BRET signals from CTR:RAMP heterodimers in the miniGs recruitment assay. (B to E) Venus-miniGs recruitment to AMY1R (CTR:RAMP1-Rluc8), AMY2R (CTR:RAMP2-Rluc8), AMY3R (CTR:RAMP3-Rluc8), and CTR (CTR-Rluc8) in response to the indicated concentrations of peptide agonist. Data are means ± SD of technical replicates from a representative experiment. (F) Scatter plot summarizing the pEC50 values for each receptor-peptide combination as means ± SEM of four independent biological replicates. (G) Cartoon depicting the positions of the Rluc8 donor and Venus acceptor used to isolate BRET signals from CTR:RAMP heterodimers in the G protein coupling assay. (H to K) Agonist mediated heterotrimeric G protein coupling to AMY1R (CTR:RAMP1-Rluc8), AMY2R (CTR:RAMP2-Rluc8), AMY3R (CTR:RAMP3-Rluc8), and CTR (CTR-Rluc8). Data are means ± SD of technical replicates from a representative experiment. (L) Scatter plot summarizing the pEC50 values for each receptor-peptide combination as means ± SEM of four independent biological replicates. See table S4 for a summary of the pEC50 values. Data were analyzed by one-way ANOVA with Tukey’s post hoc test. *P < 0.05; ns, not significant.
Fig. 5.
Fig. 5.. Thermostabilities of the AMYRs and cAMP signaling phenotypes in cells co-expressing CTR and wild-type or chimeric RAMPs.
(A to C) Analysis of the stability of (A) AMY1R, (B) AMY2R, and (C) AMY3R by native PAGE thermostability assay. Each gel is a representative unmodified image from three independent biological replicates with imaging for in-gel mCitrine fluorescence. (D) Scatter plot summarizing the fraction of heterodimer for AMY1R, AMY2R, AMY3R from the experiments shown in (A) to (C) at 4°C (lane 1) and presented as means ± SEM from the three independent replicates. (E) Quantitation of the loss of bands corresponding to AMY1R, AMY2R, and AMY3R as determined by densitometry. Data are from a single representative replicate. (F) Scatter plot summarizing melting temperature (Tm) values for AMY1R (Tm = 28.7°C ± 0.1), AMY2R (Tm = 28.7°C ± 0.17), and AMY3R (Tm = 39.2°C ± 0.39). Data are means ± SEM of three independent replicates. (G to K) Concentration-response cAMP signaling assays in COS-7 cells transiently expressing (G) CTR alone, (H) CTR and RAMP1, (I) CTR and RAMP3, (J) CTR and RAMP3wR1 TMD, and (K) CTR and RAMP3wR1 ECD by CAMYEL biosensor BRET assay after 30 min of stimulation with agonist at 37°C. Data are representative of a single experiment and are means ± SD of technical replicates. (L) Scatter plot summarizing the pEC50 values for each receptor-peptide combination as means ± SEM from three independent biological replicates. *P < 0.05; ns, not significant. See table S5 for a summary of the pEC50 values. Data were analyzed by one-way ANOVA with Tukey’s post hoc test. (M and N) Proposed models for (M) CTR:RAMP1 and (N) CTR:RAMP3 equilibria at the cell surface in the absence or presence of the indicated peptide agonists.

Update of

References

    1. Boyle CN, Zheng Y, Lutz TA, Mediators of Amylin Action in Metabolic Control. Journal of clinical medicine 11, (2022); published online EpubApr 15 ( 10.3390/jcm11082207). - DOI - PMC - PubMed
    1. Foll CL, Lutz TA, Systemic and Central Amylin, Amylin Receptor Signaling, and Their Physiological and Pathophysiological Roles in Metabolism. Comprehensive Physiology 10, 811–837 (2020); published online EpubJul 8 ( 10.1002/cphy.c190034). - DOI - PubMed
    1. Pioszak AA, Hay DL, RAMPs as allosteric modulators of the calcitonin and calcitonin-like class B G protein-coupled receptors. Adv Pharmacol 88, 115–141 (2020) 10.1016/bs.apha.2020.01.001). - DOI - PMC - PubMed
    1. Christopoulos G, Perry KJ, Morfis M, Tilakaratne N, Gao Y, Fraser NJ, Main MJ, Foord SM, Sexton PM, Multiple amylin receptors arise from receptor activity-modifying protein interaction with the calcitonin receptor gene product. Molecular pharmacology 56, 235–242 (1999); published online EpubJul ( 10.1124/mol.56.1.235). - DOI - PubMed
    1. Tilakaratne N, Christopoulos G, Zumpe ET, Foord SM, Sexton PM, Amylin receptor phenotypes derived from human calcitonin receptor/RAMP coexpression exhibit pharmacological differences dependent on receptor isoform and host cell environment. The Journal of pharmacology and experimental therapeutics 294, 61–72 (2000); published online EpubJul ( - PubMed

MeSH terms

Substances

LinkOut - more resources