. 2025 Aug 15;135(16):e188246.
doi: 10.1172/JCI188246.

A noncanonical parasubthalamic nucleus-to-extended amygdala circuit converts chronic social stress into anxiety

Affiliations

A noncanonical parasubthalamic nucleus-to-extended amygdala circuit converts chronic social stress into anxiety

Na Liu et al. J Clin Invest. .

Abstract

Anxiety disorders pose a substantial threat to global mental health, with chronic stress identified as a major etiologic factor. Over the past few decades, extensive studies have revealed that chronic stress induces anxiety states through a distributed neuronal network of interconnected brain structures. However, the precise circuit mechanisms underlying the transition from chronic stress to anxiety remain incompletely understood. Employing the chronic social defeat stress (CSDS) paradigm in mice, we uncovered a critical role of the parasubthalamic nucleus (PSTh) in both the induction and expression of anxiety-like behavior. The anxiogenic effect was mediated by an excitatory trisynaptic circuitry involving the lateral parabrachial nucleus (LPB), PSTh, and bed nucleus of the stria terminalis (BNST). Furthermore, CSDS downregulated Kv4.3 channels in glutamatergic neurons of the PSTh. Reexpression of these channels dampened neuronal overexcitability and alleviated anxiety-like behavior in stressed animals. In parallel with the well-known anxiety network centered on the amygdala, here we identify a noncanonical LPB-PSTh-BNST pathway in the transformation of stress into anxiety. These findings suggest that the PSTh may serve as a potential therapeutic target for anxiety-related disorders.

Keywords: Behavior; Cell biology; Ion channels; Neurological disorders; Neuroscience.


Figures
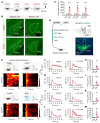
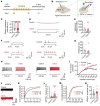
Figure 1
Figure 1. PSTh glutamatergic neurons are activated by various acute stressors.
(A) Schematic diagram of c-Fos staining. (B) c-Fos expression in the PSTh from a control (top) and a social defeat–exposed mouse (bottom). Scale bars: 200 μm. (C) The number of c-Fos-positive cells in control (n = 4) and stressed mice (n = 4). (D) Schematic illustration of fiber photometry recordings and representative image of GCaMP6m expression in PSTh glutamatergic neurons. Scale bar: 200 μm. (E) Representative raw traces and heatmaps showing GCaMP6m fluorescence changes of PSThVglut2 neurons evoked by various stressors. The red line indicates stimulus onset. (F) The peri-event plot shows average calcium transients in a social defeat–exposed mouse (left) or the entire group (right, n = 6). The thick line indicates the mean, and the shaded area indicates SEM. The dotted line marks onset of social defeat. (G) Statistical comparison of peak fluorescence signals before and after social defeat (n = 6). (HM) The same as F and G but for Ca2+ responses to electrical shock (H and I; n = 6), air puff (J and K; n = 6), or forced swim (L and M; n = 5). Data are shown as the mean ± SEM. **P < 0.01; ***P < 0.001; ****P < 0.0001; 2-tailed unpaired t test.
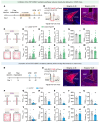
Figure 2
Figure 2. Inhibition of PSTh glutamatergic neurons during social defeat alleviates CSDS-induced anxiety-like behavior.
(A) Experimental scheme showing pharmacogenetic inhibition of PSThVglut2 neurons during CSDS procedure and the measurement of anxiety-like behavior. (B) Schematic description and representative image of hM4D expression. Scale bar: 200 μm. (C) Raw traces (left) and statistical comparison of spike firing (right) in response to 80 pA current stimulus before and after CNO application (10 μM). n = 7 neurons from 2 mice. (D) Representative movement traces of an EYFP (left) and a hM4D mouse (right) in the EPM test or OFT after CSDS. (EI) Behavioral statistics of EYFP and hM4D mice in the EPM test, including time spent (E), number of entries (F), distance traveled (G) in open arms, time spent in closed arms (H), and the open/closed ratio (I). (JN) Behavioral statistics in the OFT, including time spent (J), number of entries (K), distance traveled (L) in the center zone, time spent in corner zones (M), and total distance traveled (N). n = 13 mice for the CSDS+EYFP group, and n = 12 mice for the CSDS+hM4D group. Data are shown as the mean ± SEM. *P < 0.05; **P < 0.01; ***P < 0.001; 2-tailed unpaired t test.
Figure 3
Figure 3. CSDS induces lasting hyperactivity in PSTh glutamatergic neurons.
(A and B) Experimental timeline (A) and schematic diagram (B) of electrophysiological recordings of opto-tagged PSThVglut2 neurons after CSDS. (C) Example brain section showing ChR2 expression and optrode placement in the PSTh. Scale bar: 200 μm. (D) Representative trace of light-evoked spikes from an opto-tagged PSThVglut2 neuron. (E) Raster plots (top) and peristimulus spike time histogram (bottom) of multiple trials showing light-evoked spikes. (F) Averaged spontaneous (red) and light-evoked (blue) spike waveforms. (G and H) Representative traces (G) and raster plots (H) of opto-tagged PSThVglut2 neuronal spontaneous spikes. (I and J) The mean interspike interval (I) and spontaneous firing rate (J) of recorded PSThVglut2 neurons. n = 28 neurons from 4 mice for control, and n = 31 neurons from 7 mice for CSDS. Data are shown as the mean ± SEM. ***P < 0.001; ****P < 0.0001; 2-tailed unpaired t test.
Figure 4
Figure 4. CSDS enhances the intrinsic excitability and excitatory synaptic inputs of PSTh glutamatergic neurons.
(A and B) Experimental timeline (A) and schematic diagram (B) of whole-cell patch-clamp recordings of PSThVglut2 neurons after CSDS. (C) Comparison of resting membrane potentials between 2 groups. n = 27 cells from 5 mice for control, and n = 27 cells from 7 mice for CSDS. (D and F) Representative traces of different current injections. (E and G) Statistical comparison of the membrane resistance (E) and rheobase (G) of PSTh glutamatergic neurons between control and CSDS groups. n = 15 cells from 5 mice for control, and n = 11 cells from 7 mice for CSDS. (H) Representative traces of 140 pA (left) and 240 pA (right) current injections. (I) Number of action potentials in response to incremental current injections. (J) Representative recorded samples of PSThVglut2 neuronal sEPSCs. (K and M) Cumulative probability of interevent interval (K) and amplitude (M) of sEPSCs. (L and N) Comparison of sEPSC frequency (L) and amplitude (N) between 2 groups. n = 38 cells from 6 mice for control, and n =21 cells from 5 mice for CSDS. Data are shown as the mean ± SEM. *P < 0.05 and ****P < 0.0001; 2-tailed unpaired t test in C, E, G, L, and N; 2-way ANOVA, Bonferroni’s multiple-comparison post hoc tests in I, K, and M.
Figure 5
Figure 5. The activity of PSTh glutamatergic neurons is required for CSDS-induced anxiety-like behavior.
(A) Experimental illustration showing pharmacogenetic manipulation during anxiety expression in CSDS mice. (B) Schematic description and representative image of hM4D expression. Scale bar: 200 μm. (C) Representative movement traces in the EPM test or OFT. (DH) Behavioral statistics of the EPM test, including time spent (D), number of entries (E), distance traveled (F) in open arms, time spent in closed arms (G), and the open/closed ratio (H). (IM) Behavioral statistics of the OFT, including time spent (I), number of entries (J), distance traveled (K) in the center zone, time spent in corner zones (L), and total distance traveled (M). n = 11 mice for each group. Data are shown as the mean ± SEM. *P < 0.05; **P < 0.01; 2-tailed unpaired t test.
Figure 6
Figure 6. The potentiated LPB-PSTh excitatory pathway mediates anxiety-like behavior induced by CSDS.
(A and B) Experimental timeline (A) and schematic diagram (B) of whole-cell patch-clamp recordings from LPB-PSTh projections. (C) Representative traces of postsynaptic currents recorded from PSThVglut2 neurons in response to paired-pulse light stimuli. (D) PPR of postsynaptic currents. n = 17 neurons from 7 mice for control, and n = 15 neurons from 3 mice for CSDS. (E) Representative traces of postsynaptic AMPA (bottom) and NMDA (top) currents. (F) Quantification of AMPA/NMDA ratio. n = 22 neurons from 7 mice for control, and n = 12 neurons from 3 mice for CSDS. (G) Experimental scheme showing optogenetic suppression of LPB-PSTh projections during anxiety expression in CSDS mice. (H) Schematic description and representative images of NpHR expression. Scale bars: 200 μm. (I and O) Representative movement traces after CSDS. (JN) Behavioral statistics of the EPM test, including time spent (J), number of entries (K), distance traveled (L) in open arms, time spent in closed arms (M), and the open/closed ratio (N). (PT) Behavioral statistics of the OFT, including time spent (P), number of entries (Q), distance traveled (R) in center zone, time spent in corner zones (S), and total distance traveled (T). n = 10 mice for the CSDS+EYFP group, and n = 11 mice for the CSDS+NpHR group. Data are shown as the mean ± SEM. *P < 0.05; **P < 0.01; 2-way ANOVA, Bonferroni’s multiple-comparison post hoc tests in D; 2-tailed unpaired t test in F, JN, and PT.
Figure 7
Figure 7. The PSTh regulates anxiety-like behavior via its innervation upon the BNST.
(A) Experimental scheme showing optogenetic suppression of PSTh-BNST excitatory projections during anxiety expression in CSDS mice. (B) Schematic description and representative images of NpHR expression in PSTh glutamatergic neurons and axon terminals in BNST. Scale bars: 200 μm. (C) Representative movement traces of an EYFP (left) and a NpHR mouse (right) in the EPM test or OFT after CSDS. (DH) Behavioral statistics of the EPM test, including time spent (D), number of entries (E), distance traveled (F) in open arms, time spent in closed arms (G), and the open/closed ratio (H). (IM) Behavioral statistics of the OFT, including time spent (I), number of entries (J), distance traveled (K) in the center zone, time spent in corner zones (L), and total distance traveled (M). n = 14 mice for the CSDS+EYFP group, and n = 12 mice for the CSDS+NpHR group. (N) Experimental illustration showing optogenetic activation of the PSTh-BNST excitatory pathway during anxiety-like behavioral tests in naive mice. (O) Schematic description and representative images of ChR2 expression in PSTh glutamatergic neurons and axon terminals in BNST. Scale bars: 200 μm. (PZ) The same as CM but for EYFP- and ChR2-expressing naive mice. n = 13 mice for the EYFP group, and n = 10 mice for ChR2 group. Data are shown as the mean ± SEM. *P < 0.05; **P < 0.01; ***P < 0.001; ****P < 0.0001; 2-tailed, unpaired t test.
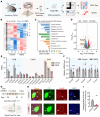
Figure 8
Figure 8. CSDS downregulates the expression of Kcnd3 in PSTh glutamatergic neurons.
(A) Schematic diagram for RNA-sequencing and qPCR measurements to examine the potential molecular mechanisms of PSTh in regulating anxiety-like behavior. (BD) Heatmaps (B), the most enriched Gene Ontology terms (C), and volcano plot (D) of DEGs (P < 0.05 and fold change ≥ 1.2) in PSTh neurons from unstressed control and CSDS mice. Significantly upregulated genes are in red (n = 415), while downregulated genes are shown in blue (n = 480). Additionally, numerous genes show no significant differences between 2 groups (n = 13,359). (E) Normalized expression (fragments per kilobase of transcript per million fragments mapped; FPKM) of genes encoding important ion channels in PSTh neurons. n = 3 (30 mice in total) for each group. (F) qPCR results for Kcnd3 level in PSTh neurons. n = 12 mice for the control, and n = 16 mice for the CSDS group. (G) Flow diagram and schematic illustration of virus injection for sparsely labeling PSThVglut2 neurons, enabling FISH verification of Kcnd3 in these neurons. (H) Microscopy images show Kcnd3 expression in PSThVglut2 neurons from a control (top) and a CSDS (bottom) mouse. Scale bars: 10 μm. (I) Quantification of the fractional area of Kcnd3 in PSThVglut2 neurons from control and CSDS groups. n = 5 mice for control, and n = 7 mice for CSDS group. Data are shown as the mean ± SEM. *P < 0.05; **P < 0.01; ***P < 0.001; 2-tailed unpaired t test.
Figure 9
Figure 9. Kv4.3 replenishment in PSTh glutamatergic neurons rescues CSDS-induced anxiety-like behavior.
(A) Experimental flowchart. (B) Schematic description and representative images of EYFP or KCND3-EGFP expression. Overlapping of KCND3-EGFP with HA suggests successful overexpression of Kcnd3. Scale bars: 200 μm, 50 μm (insets). (C) Representative traces (left) and statistical comparison of spike firing (right) of CSDS+EYFP- (dark) and CSDS+KCND3-expressed (green) PSThVglut2 neurons. n = 12 neurons from 3 mice for EYFP, and n = 26 neurons from 4 mice for KCND3. (D) Representative movement traces in the EPM test or OFT. (EI) Behavioral statistics of the EPM test, including time spent (E), number of entries (F), distance traveled (G) in open arms, time spent in closed arms (H), and the open/closed ratio (I). (JN) Behavioral statistics of the OFT, including time spent (J), number of entries (K), distance traveled (L) in the center zone, time spent in corner zones (M), and total distance traveled (N). n = 15 mice for each group. Data are shown as the mean ± SEM. *P < 0.05; **P < 0.01; ***P < 0.001; ****P < 0.0001; 2-way ANOVA, Bonferroni’s multiple-comparison post hoc tests in C; 2-tailed unpaired t test in EN.

References

    1. Hudson JL. Prevention of anxiety disorders across the lifespan. JAMA Psychiatry. 2017;74(10):1029–1030. doi: 10.1001/jamapsychiatry.2017.2430. - DOI - PubMed
    1. Craske MG, et al. Anxiety disorders. Nat Rev Dis Primers. 2017;3:17024. doi: 10.1038/nrdp.2017.24. - DOI - PMC - PubMed
    1. Kessler RC, et al. Lifetime prevalence and age-of-onset distributions of DSM-IV disorders in the national comorbidity survey replication. Arch Gen Psychiatry. 2005;62(6):593–602. doi: 10.1001/archpsyc.62.6.593. - DOI - PubMed
    1. Grupe DW, Nitschke JB. Uncertainty and anticipation in anxiety: an integrated neurobiological and psychological perspective. Nat Rev Neurosci. 2013;14(7):488–501. doi: 10.1038/nrn3524. - DOI - PMC - PubMed
    1. Penninx BW, et al. Anxiety disorders. Lancet. 2021;397(10277):914–927. doi: 10.1016/S0140-6736(21)00359-7. - DOI - PMC - PubMed

MeSH terms

Substances