. 2025 Aug 15;135(16):e184597.
doi: 10.1172/JCI184597.

SEC61B regulates calcium flux and platelet hyperreactivity in diabetes

Affiliations

SEC61B regulates calcium flux and platelet hyperreactivity in diabetes

Yvonne X Kong et al. J Clin Invest. .

Abstract

Platelet hyperreactivity increases the risk of cardiovascular thrombosis in diabetes and failure of antiplatelet drug therapies. Elevated basal and agonist-induced calcium flux is a fundamental cause of platelet hyperreactivity in diabetes; however, the mechanisms responsible for this remain largely unknown. Using a high-sensitivity, unbiased proteomic platform, we consistently detected over 2,400 intracellular proteins and identified proteins that were differentially released by platelets in type 2 diabetes. We identified that SEC61 translocon subunit β (SEC61B) was increased in platelets from humans and mice with hyperglycemia and in megakaryocytes from mice with hyperglycemia. SEC61 is known to act as an endoplasmic reticulum (ER) calcium leak channel in nucleated cells. Using HEK293 cells, we showed that SEC61B overexpression increased calcium flux into the cytosol and decreased protein synthesis. Concordantly, platelets in hyperglycemic mice mobilized more calcium and had decreased protein synthesis. Platelets in both humans and mice with hyperglycemia had increased ER stress. ER stress induced the expression of platelet SEC61B and increased cytosolic calcium. Inhibition of SEC61 with anisomycin decreased platelet calcium flux and inhibited platelet aggregation in vitro and in vivo. These studies demonstrate the existence of a mechanism whereby ER stress-induced upregulation of platelet SEC61B leads to increased cytosolic calcium, potentially contributing to platelet hyperreactivity in diabetes.

Keywords: Calcium channels; Cardiology; Cell biology; Hematology; Platelets; Proteomics.


Figures
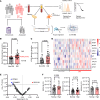
Figure 1
Figure 1. Unbiased, high-sensitivity proteomics of human platelets identifies increased SEC61B in type 2 diabetes.
(A) Workflow demonstrating collection of clinicolaboratory and coronary angiogram data from patients without (non-DM) and with diabetes (DM); quality check of platelets by flow cytometry; platelet aggregation; and separation of resting and low-dose thrombin-activated platelet intracellular fraction “lysate” and released fraction “releasate” from patients without and with DM. (B) Levels of serum fructosamine in patients without (n = 33) versus with DM (n = 42) (Mann-Whitney test). (C) Median intensity of K310 glycated albumin peptides detected by mass spectrometry in the plasma of patients without (n = 29) and with DM (n = 39) (Welch’s t test). (D) Heatmap of 100 highest fold change differences between DM and non-DM platelet lysate proteomes in the resting state. 2,467 proteins were consistently detected in >50% of samples. Enrichment in proteins involved in response to oxidative stress (Z-scores shown). (E) Correlation of the top 100 upregulated platelet lysate proteins, in response to low-dose thrombin 0.025 U/mL, with serum fructosamine. SEC61B was the only platelet protein significantly correlated with serum fructosamine (red circle) (Spearman’s rho = 0.33, P = 0.029). ARMT1, CPNE2, and COMMD3 were negatively correlated with serum fructosamine (blue circles). (F) SEC61B, SEC61A, and SEC61G levels determined by mass spectrometry in platelets grouped in normal fructosamine (200–290 μmol/L) (n = 28) (gray) and high fructosamine (>290 μmol/L) (n = 15) (red) (Mann-Whitney test). Data are shown as the mean ± SD. GPX7, glutathione peroxidase 7; AMBP, α-1-microglobulin/bikunin precursor; MGMT, O-6-methylguanine-DNA methyltransferase; RWDD1, RWD domain containing 1; ARG1, arginase 1; SEPP1, selenoprotein P; HP, haptoglobin; APOA4, apolipoprotein A4; APOD, apolipoprotein D; APOE, apolipoprotein E; ARMT1, acidic residue methyltransferase 1; COMMD3, COMM domain containing 3; CPNE2, calcium-dependent phospholipid-binding protein; SEC61B, SEC61 translocon subunit β; SEC61A, SEC61 translocon subunit α; SEC61G, SEC61 translocon subunit γ.
Figure 2
Figure 2. Platelets in type 2 diabetes have features of endoplasmic reticulum dysregulation evidenced by increased levels of SEC61B and activation of the ER stress sensor IRE1.
(A) Representative Western blots of SEC61B in resting platelet lysate from healthy individuals and from patients with DM. Band intensity ratio of SEC61B to GAPDH in healthy (gray) versus DM platelets (red). n = 7 individuals per group (Mann-Whitney test). (B) Representative Western blots of SEC61B in platelets from healthy individuals treated with DMSO (vehicle) or thapsigargin (TG, 2 μM), an inducer of ER stress. Band density ratio of SEC61B to GAPDH of platelets treated with vehicle (gray) or TG (red). n = 7 individuals (paired t test). (C) Representative Western blots of p-IRE1 in platelets from healthy individuals treated with DMSO (vehicle) or TG (2 μM). Band density ratio of p-IRE1 to GAPDH of platelets treated with vehicle (gray) or TG (red). n = 9 individuals (paired t test). (D) IRE1 by mass spectrometry in platelets from patients with (n = 5) and without DM (n = 6) (Mann Whitney test). (E) Band intensity ratio of phosphorylated IRE1 (p-IRE1) to β actin of platelet lysates from patients without (n = 13) (gray) and with DM (n = 17) (red), as detected by Western blot (Mann-Whitney test). (F) Representative Western blots of p-IRE1, IRE1, and GAPDH in resting platelet lysate from healthy individuals and from patients with DM. Band intensity ratio of pIRE1 to IRE1 in healthy (gray) versus DM platelets (red). n = 8 individuals per group (Mann-Whitney test). Data are shown as the mean ± SD. Non-DM, no diabetes mellitus; DM, diabetes mellitus; LFQ, label-free quantification; p-IRE1, phosphorylated inositol requiring protein-1; IRE1, inositol requiring protein-1.
Figure 3
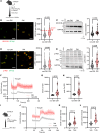
Figure 3. Hyperglycemia and tunicamycin (an ER stress inducer) increase platelet SEC61B expression and cytosolic calcium.
(A) C57BL/6 mice were injected with streptozotocin (STZ) to induce diabetes (DM) or citrate buffer (vehicle, non-DM). (B) Representative images of platelets from non-DM and DM mice stained for SEC61B (red) and GP1Bb (green). SEC61B intensity of immunostained platelets from non-DM (gray) and DM (red) mice. Median (black dashed line), quartiles (black dotted line), and mean + 2SD (red dotted line) of SEC61B intensity in platelets from non-DM mice as cutoff for SEC61B “high” platelets are shown. (C) Representative Western blots of SEC61B in platelet lysates and SEC61B-to-GAPDH band intensity ratio in non-DM (gray) versus DM (red) platelet lysates. n = 16–18 mice per group. (D) Representative images of platelets from non-DM and DM mice stained for p-IRE1 (red) and GP1Bb (green). P-IRE1 intensity of immunostained platelets from non-DM (gray) and DM (red) mice. (E) Representative Western blots of p-IRE1, IRE1, and GAPDH and p-IRE1–to-IRE1 band intensity ratio in non-DM (gray) and DM (red) mice. n = 7–8 mice per group (Welch’s test). (F) Cytosolic calcium was quantified with Cal-520–loaded platelets from non-DM (gray) and DM (red) mice. SEC61-mediated ER calcium leak was elicited by TG treatment (solid line indicates the mean; shaded region indicates SEM). (G) Basal cytosolic calcium and (H) peak fluorescence intensity in platelets from non-DM (gray) and DM mice (red). n = 8 mice per group. (I) In vivo ER stress induction by tunicamycin (TUN, 1 mg/kg). (J) Cytosolic calcium measured in Cal-520–loaded platelets from DMSO-treated (vehicle, gray) or TUN-treated (red) mice before and after the addition of TG. (K) Basal cytosolic calcium and (L) peak calcium in platelets from vehicle-treated (gray) and TUN-treated mice (red). n = 5 per group. Mann-Whitney test was used for all comparisons unless otherwise specified. n = 15–20 platelets per mouse from, n = 3–5 mice per group in platelet immunofluorescence studies. Scale bars: 5 μm.
Figure 4
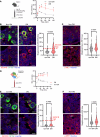
Figure 4. Increased SEC61B occurs at the level of the megakaryocyte in diabetic mice.
(A) Apoe–/– mice injected with STZ as a model of type 2 diabetes. Glucose tolerance test in vehicle-treated (non-DM) versus STZ-treated (DM) mice. (B) SEC61B fluorescence intensity in the bone marrow of non-DM (left) and DM (right) Apoe–/– mice, stained for SEC61B (red) and GP1bβ (green). Nuclei are stained with Hoechst 33258 (blue). Representative images are shown. SEC61B fluorescence intensity per square pixel in megakaryocytes of non-DM or DM Apoe–/– mice. Median (black dashed line), quartiles (black dotted line), and mean + 2SD of SEC61B intensity in vehicle-treated mouse megakaryocytes as cutoff for SEC61B “high” megakaryocytes are shown. 15–20 megakaryocytes /mouse were analyzed from n = 5 mice per group. (C) p-IRE1 in megakaryocytes (outlined) of non-DM (top) or DM (bottom) Apoe–/– mice by immunofluorescence staining. p-IRE1 is shown in red, and nuclei are shown in blue. Representative images are shown. P-IRE1 fluorescence intensity per area of immunostained megakaryocytes of non-DM or DM Apoe–/– mice. n = 15–20 megakaryocytes per mouse, n = 5 mice per group. (D) Diversity Outbred mice on high-fat diet as a model of type 2 diabetes. Glucose tolerance test in non-DM (normoglycemic) versus DM (hyperglycemic) mice. (E) SEC61B immunostaining of megakaryocytes in the bone marrow of non-DM (left) and DM (right) Diversity Outbred mice. (F) P-IRE1 immunostaining of megakaryocytes (outlined) of non-DM (top) or DM (bottom) Diversity Outbred mice. 15 –20 megakaryocytes per mouse were analyzed from n = 5 Diversity Outbred mice per group (Mann-Whitney test). For glucose tolerance test, multiple unpaired t tests with Benjamini, Krieger, and Yekutieli correction for multiple testing. *q < 0.05, **q < 0.01. STZ, streptozotocin; HFD, high-fat diet; GP1Bb, glycoprotein 1B β; p-IRE1, phosphorylated inositol-requiring enzyme 1. Scale bars: 20 μm.
Figure 5
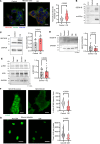
Figure 5. SEC61B overexpression in HEK cells does not induce activation of IRE1 but is associated with decreased protein synthesis.
(A) SEC61B (red) and tubulin (green) immunostaining of lentiviral vector-transfected control or SEC61B-OE HEK293 cells. Nuclei are stained with Hoechst 33258 (blue). Representative images are shown. Scale bar: 20 μm. Normalized SEC1B intensity/cell in control (gray) and OE (red) cells. n = 20–30 cell clusters from n = 3 independent experiments (Welch’s test). (B) Representative Western blots of SEC61B, anti-Myc, and GAPDH of control and OE cells. SEC61B in HEK293 OE cells runs as 2 bands: native SEC61B (~10 kDa) and Myc-tagged SEC61B (~15 kDa). (C) Band intensity ratio of SEC61B to GAPDH in lysate of control (gray) versus OE cells (red). n = 7 independent experiments per group (Welch’s test). (D) Representative Western blots of SEC61A and GAPDH of control and OE cells. Band intensity ratio of SEC61A to GAPDH in lysate of control (gray) versus OE cells (red). n = 8 independent experiments (Welch’s test). (E) Representative Western blots of p-IRE1, IRE1, and GAPDH of control and OE cells. Band intensity ratio of p-IRE1 to IRE1 in HEK293 lysate of control (gray) versus OE cells (red). n = 10 independent experiments (Welch’s test). (F) Representative images of L-AHA fluorescence intensity (green) as a measure of protein synthesis in control and SEC61B-OE cells. Scale bar: 20 μm. L-AHA fluorescence intensity per cell area measured in n = 30 cell clusters per group from n = 3 independent experiments (Mann Whitney test). (G) Representative images of L-AHA fluorescence intensity (green) in platelets from normoglycemic (non-DM) and streptozotocin-induced hyperglycemic (DM) mice. Scale bar: 5 μm. L-AHA fluorescence intensity per platelet in non-DM (gray) and DM (red) mice. 20 platelets analyzed per mice, n = 7–8 mice per group (Welch’s t test). SEC61B OE, SEC61B overexpressing cells; L-AHA, L-azidohomoalanine.
Figure 6
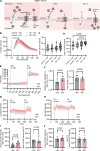
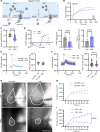
Figure 6. Eeyarestatin I, which stabilizes SEC61 in its “open” — calcium permeable — conformation, increases ER calcium leak in HEK293 cells overexpressing SEC61B and in platelets.
(A) Schematic for 2-step induction of SEC6 calcium leak. In step 1, eeyarestatin I (ES1) “opens” the SEC61 channel allowing calcium to leak from the ER into the cytosol. In step 2, TG inhibits SERCA from pumping calcium back into the ER to measure maximal SEC61-mediated ER calcium leak. (B) Cytosolic calcium was quantified over time in Cal-520–loaded control or SEC61B-overexpressing (SEC61B-OE) HEK293 cells using a fluorescent plate reader. HEK293 control and OE cells were treated with vehicle (gray) or ES1 (red) for 1 minute, followed by addition of TG, in the presence of EGTA (solid line indicates mean; shaded region indicates SEM). (C) Basal and (D) peak fluorescence intensity of Cal-520 in the presence of vehicle or ES1 in control (gray) and OE cells (red). n = 10 independent experiments (1-way ANOVA with Dunn’s multiple comparisons test). (E) Cytosolic calcium was quantified over time in Fura2-loaded human platelets in the presence of vehicle or ES1 50 μM for 10 minutes, followed by addition of TG. (F) Basal and peak fluorescence intensity of Fura2 10 minutes after incubation with vehicle or ES1 (basal) and after addition of TG (peak). Mean ± SD, n = 5 healthy donors (Mann-Whitney test). (G and H) Cytosolic calcium was quantified over time in Cal-520–loaded platelets from (G) normoglycemic (non-DM) mice and (H) streptozotocin-induced hyperglycemic (DM) mice. Platelets were treated with ES1 for 5 minutes, followed by TG, in the presence of EGTA (solid line indicates mean; shaded region indicates SEM). (I and J) Basal and peak fluorescence intensity in Cal-520–loaded platelets from vehicle-treated (Veh, gray) versus ES1-treated (red) platelets from (I) non-DM mice and (J) DM mice. n = 7 mice, per group (Welch’s t test). SERCA 2b, sarco/endoplasmic reticulum calcium ATPase; ES1, eeyarestatin I; TG, thapsigargin.
Figure 7
Figure 7. Anisomycin, which promotes a “sealed” SEC61 conformation, decreases ER calcium leak in HEK293 cells and platelets and inhibits platelet thrombus formation in vivo. (A)
Schematic of inhibition of SEC61 by anisomycin (ANX). ANX inhibits ribosomal elongation of the peptide, locking the peptide within the pore, thus preventing calcium leak when SERCA2 is inhibited with TG. (B) Cytosolic calcium was quantified with Fura2-loaded human platelets in response to TG, after pretreatment with vehicle or ANX (200 μM for 2 hours). Solid line indicates mean; shaded region indicates SEM. (C) Peak Fura2 in platelets treated with vehicle (gray) or ANX (blue) after TG addition. n = 6 healthy donors (Welch’s t test). (D) Platelet aggregation over time in response to TG, after pretreatment of platelet-rich plasma (PRP) with vehicle or ANX 200 μM for 2 hours. Maximal percentage aggregation of PRP, and time to initiation of platelet aggregation, in response to TG, after pretreatment with vehicle (gray) or ANX (blue). n = 5 healthy donors (Welch’s t test). (E) Cytosolic calcium in Cal520-loaded non-DM platelets after treatment with vehicle (gray) or ANX (blue) (100 μM for 1 hour), prior to TG addition. Peak Cal520 in non-DM platelets treated with vehicle (gray) or ANX (blue) followed by TG. n = 6 mice per group (Welch’s t test). (F) Cytosolic calcium in Cal520-loaded DM platelets, as described before. n = 6 mice per group (Welch’s t test). (G) Differential interference contrast images depicting thrombi (dotted line) in mouse mesenteric venules forming 4 minutes after needle insertion in non-DM and DM mice. Mice were pretreated with i.v. vehicle control (Veh) or ANX (20 mg/kg, 1.5 hours prior to surgery). The scale bar is 50 μm.(H) Surface area of thrombi generated in non-DM and (I) in DM mice was quantified at the indicated time points after needle insertion. Results are expressed as mean ± SD. n = 3–5 mice per group, 6–8 thrombi per mouse (2-way ANOVA).
Figure 8
Figure 8. Platelets in diabetes secrete a broad range of proteins in response to submaximal stimulation that are involved in inflammation and atherosclerosis.
(A) Volcano plots of proteins detected in the releasate of nondiabetic (non-DM) and (B) diabetic (DM) platelets after stimulation with low-dose thrombin (IIa) 0.025 U/mL. Released proteins that were significantly increased after stimulation with low-dose thrombin compared with released proteins in resting platelets are shown in blue for non-DM platelets and I red for DM platelets. (C) Difference of platelet surface CD62P expression before and after low dose IIa from patients without and with diabetes (Mann-Whitney test). (D) Secretion of ADAM like decysin 1 (ADAMDEC1) and (E) decorin (DCN) into the releasate of non-DM (blue) and DM (red) platelets following stimulation with low-dose IIα (Limma moderated t test). THBS1, thrombospondin I; VWF, von Willebrand factor; PPBP, proplatelet basic protein; PF4, platelet factor 4; CCL5, chemokine (C-C motif) ligand 5 (RANTES).

Comment in

  • Chronic diseases alter the platelet rheostat to promote hyperreactivity and thrombosis

References

    1. Shahim B, et al. On-treatment platelet reactivity and ischemic outcomes in patients with diabetes mellitus: two-year results from ADAPT-DES. J Am Heart Assoc. 2023;12(1):e026482. doi: 10.1161/JAHA.122.026482. - DOI - PMC - PubMed
    1. Natarajan A, et al. Platelet hyperactivity in type 2 diabetes: role of antiplatelet agents. Diab Vasc Dis Res. 2008;5(2):138–144. doi: 10.3132/dvdr.2008.023. - DOI - PubMed
    1. Tschöpe D, et al. Increase in the cytosolic concentration of calcium in platelets of diabetics type II. Thromb Res. 1991;62(5):421–428. doi: 10.1016/0049-3848(91)90015-O. - DOI - PubMed
    1. Zbidi H, et al. Ca2+ leakage rate from agonist-sensitive intracellular pools is altered in platelets from patients with type 2 diabetes. Platelets. 2011;22(4):284–293. doi: 10.3109/09537104.2010.528813. - DOI - PubMed
    1. Jain K, et al. Unfolded protein response differentially modulates the platelet phenotype. Circ Res. 2022;131(4):290–307. doi: 10.1161/CIRCRESAHA.121.320530. - DOI - PMC - PubMed

MeSH terms