

Noninvasive Estimation of Pulmonary Vascular Resistance Using Right Ventricular Outflow Doppler Analysis
- PMID: 40829369
- PMCID: PMC12396015
- DOI: 10.1016/j.jacadv.2025.102079
Noninvasive Estimation of Pulmonary Vascular Resistance Using Right Ventricular Outflow Doppler Analysis
Abstract
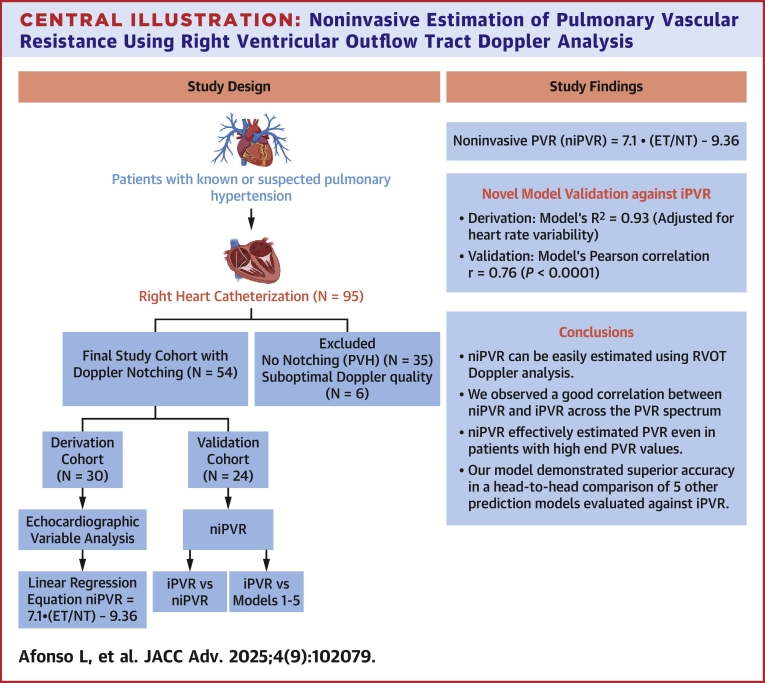
Background: Right heart catheterization (RHC) is the gold standard for measuring pulmonary vascular resistance (PVR). Current noninvasive methods lack accuracy, especially in moderate to severe pulmonary arterial hypertension.
Objectives: The objective of the study was to develop and validate a novel echocardiographic method for estimating PVR using right ventricular outflow tract Doppler notch analysis.
Methods: In this prospective study, of 95 patients undergoing RHC, 35 with isolated postcapillary pulmonary hypertension (PVR <2.0 WU) and no discernible Doppler notches were excluded. Of the remaining, 54 patients with interpretable Dopplers were divided into derivation (n = 30) and validation (n = 24) cohorts, all undergoing invasive PVR (iPVR) measurement and echocardiography within 24 hours. Right ventricular outflow tract Doppler, specifically the ratio of notch time (NT) to ejection time, was analyzed to derive a regression equation for non-invasive PVR (niPVR). The model was validated against iPVR and compared with 5 existing methods.
Results: Stepwise linear regression identified the inverse of NT as the strongest predictor of iPVR. After adjusting for heart rate, the model (R2 = 0.93) yielded non-iPVR = 7.1∗(ejection time/NT) - 9.36. Validation against 5 established methods showed superior performance across a PVR range of 2.3 to 14.2 WU, with the highest Pearson correlation (r: 0.76; P < 0.0001; 95% CI: 0.52-0.89). Bland-Altman analysis confirmed superior agreement.
Conclusions: This novel echocardiographic method offers feasible, rapid, reliable PVR estimation with strong correlation to invasive measurements. Although not a substitute for RHC, this promising preliminary finding from a selective cohort may aid in identifying candidates for invasive testing and guide pulmonary hypertension management. Larger, multicenter validation is warranted.
Keywords: Wood units; echocardiography; postcapillary pulmonary hypertension; precapillary; pulmonary impedance.
Copyright © 2025 The Authors. Published by Elsevier Inc. All rights reserved.
Conflict of interest statement
Funding support and author disclosures The authors have reported that they have no relationships relevant to the contents of this paper to disclose.
Figures


Similar articles
-
Noninvasive assessment of pulmonary vascular resistance: a synergistic approach using computed tomography pulmonary angiography and echocardiography in pulmonary hypertension.Quant Imaging Med Surg. 2025 Sep 1;15(9):8567-8578. doi: 10.21037/qims-24-2152. Epub 2025 Aug 11. Quant Imaging Med Surg. 2025. PMID: 40893543 Free PMC article.
-
Doppler trans-thoracic echocardiography for detection of pulmonary hypertension in adults.Cochrane Database Syst Rev. 2022 May 9;5(5):CD012809. doi: 10.1002/14651858.CD012809.pub2. Cochrane Database Syst Rev. 2022. PMID: 35532166 Free PMC article.
-
New Echocardiographic Algorithm for Estimating Right Atrial Pressure in Severe Tricuspid Regurgitation: Insights From Simultaneous Cardiac Catheterization.J Am Heart Assoc. 2025 Aug 5;14(15):e041981. doi: 10.1161/JAHA.125.041981. Epub 2025 Jul 17. J Am Heart Assoc. 2025. PMID: 40673516
-
Pulmonary vascular resistance predicts the mortality in patients with bronchiectasis-associated pulmonary hypertension.J Hypertens. 2024 Oct 1;42(10):1703-1710. doi: 10.1097/HJH.0000000000003782. Epub 2024 Jun 10. J Hypertens. 2024. PMID: 38860405 Free PMC article.
-
Carbon dioxide detection for diagnosis of inadvertent respiratory tract placement of enterogastric tubes in children.Cochrane Database Syst Rev. 2025 Feb 19;2(2):CD011196. doi: 10.1002/14651858.CD011196.pub2. Cochrane Database Syst Rev. 2025. PMID: 39968844
References
-
- Humbert M., Kovacs G., Hoeper M.M., et al. 2022 ESC/ERS guidelines for the diagnosis and treatment of pulmonary hypertension. Eur Heart J. 2022;43:3618–3731. - PubMed
-
- Hoeper M.M., Lee S.H., Voswinckel R., et al. Complications of right heart catheterization procedures in patients with pulmonary hypertension in experienced centers. J Am Coll Cardiol. 2006;48:2546–2552. - PubMed
-
- Abbas A.E., Fortuin F.D., Schiller N.B., Appleton C.P., Moreno C.A., Lester S.J. A simple method for noninvasive estimation of pulmonary vascular resistance. J Am Coll Cardiol. 2003;41:1021–1027. - PubMed
-
- Abbas A.E., Franey L.M., Marwick T., et al. Noninvasive assessment of pulmonary vascular resistance by Doppler echocardiography. J Am Soc Echocardiogr. 2013;26:1170–1177. - PubMed
-
- Cáceres Espejo J., Santos de Soto J., Gavilán Camacho J.L., Cabello Laureano R., Grueso Montero J., Descalzo Señorans A. [Doppler echocardiographic evaluation of pulmonary hypertension in children] Rev Esp Cardiol. 1995;48:122–127. - PubMed
LinkOut - more resources
Full Text Sources
Research Materials
