. 2025 Oct:207:93-106.
doi: 10.1016/j.yjmcc.2025.08.004. Epub 2025 Aug 17.

Paracrine IGFBP3 spatially coordinates IGF signaling to induce myocardial regeneration in mice

Affiliations

Paracrine IGFBP3 spatially coordinates IGF signaling to induce myocardial regeneration in mice

Shah R Ali et al. J Mol Cell Cardiol. 2025 Oct.

Abstract

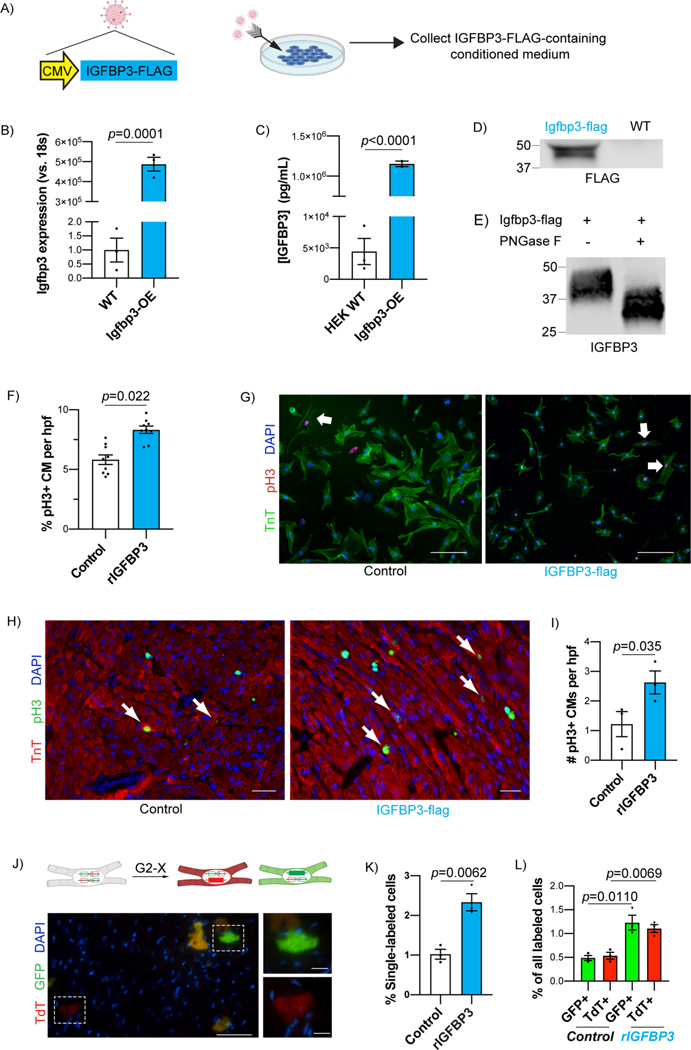
We hypothesized that the microenvironment of the regenerating neonatal mouse heart contains pro-mitotic factors. To identify non-cell-autonomous effectors of cardiomyocyte mitosis, we analyzed a transcriptomic screen of regenerating and non-regenerating hearts for differentially expressed secreted proteins. We identified IGFBP3 in this screen as a neonatal injury-associated secreted protein. IGFBP3 belongs to a family of proteins that can stabilize and sequester IGF growth factors, as well as exert IGF-independent functions. In the neonatal heart, IGFBP3 is expressed and secreted predominantly by endothelial cells following injury, notably in the border zone of the infarct. We generated loss-of-function and gain-of-function mouse models to dissect the role of IGFBP3 in myocardial regeneration. Global deletion of Igfbp3 blunted neonatal regeneration, while gain-of-function experiments using recombinant IGFBP3 or a tissue-specific ectopic Igfbp3 mouse model uncovered a pro-mitotic effect of IGFBP3 on cardiomyocytes in vitro and in the murine heart. The temporal and spatial expression of an IGFBP3 protease (PAPPA2) and IGFBP3 in the infarct zone suggests that IGFBP3 proteolysis is coordinated to locally release IGF2, which can activate an Insulin/IGF-based growth pathway to stimulate cardiomyocyte division. Collectively, our work illuminates an endothelial-cardiomyocyte crosstalk involving IGFBP3 that can mediate myocardial regeneration in the neonatal heart.

Keywords: Cardiomyocyte; Endothelium; IGF; Paracrine; Proliferation; Regeneration.


Conflict of interest statement

Declaration of competing interest All authors declare no disclosure of interest for this contribution. AI-assisted technology was not used in the preparation of this work.

Figures

Fig. 1.
Fig. 1.
Igfbp3 is expressed in the heart after neonatal MI. A) Schematic depicting experimental approach. B) Curated list of candidate secreted genes based on bioinformatic analysis after neonatal and adult MI or sham, based on N = 3 mice per group (male and female mice used for P14 MI/sham; sex not determined for neonatal mice). C) Relative gene expression of discrete secreted genes after MI or sham. D-G) In situ hybridization of cardiac tissue 3 days after MI at P0 (G-H) or P7 (I-J) for cardiac Troponin T (cTnT) (D,F) or Igfbp3 (E,G). H) Genetic construct of Igfbp3-KO-LacZ model. I-K) Representative LacZ staining of Igfbp3-LacZ reporter mice 3 days post (3dp) specified operation and timepoint. (N = 3 mice per group.) Scale bar 1 mm. Red arrows and yellow dashed line outline infarct border. L-M) ISH for Igfbp3 7 days after sham operation (L) or after ventricular amputation (M) in zebrafish. Scale bar 100 μm (inset scale bar 25 μm). N-O) LacZ stain, eosin counterstain, and endomucin immunohistochemistry on cardiac sections 3 days after P1 MI. Scale bar 150 μm. P) Igfbp3 scRNA-seq of cardiac cells after P1 MI (data derived from Wang et al.) Table includes scRNA-seq gene expression values of Igfbp3 in TPM (total counts per million) in various cell lineages (colour-coded) from cardiac tissue 3 days after P1 MI or sham (Art.EC, arterial endothelial cell; Pro.EC, proliferating endothelial cells; Pro.FB, proliferating FB; SMC, smooth muscle cell; VEC, vascular endothelial cell.) Q) Immunofluorescent staining of cardiac tissue 3 days after P1 MI. Dashed white line demarcates infarct boundary. Scale bar 100 μm.
Fig. 2.
Fig. 2.
Igfbp3 deletion impairs neonatal regeneration. A-B) H&E-stained short axis sections from one-month-old hearts. Scale bar 100 μm. C) HW/BW ratio (mg/g) from one-month-old hearts. N = 3 WT, N = 9 Igfbp3+/−, N = 13 Igfbp3−/− mice (male and female). P-value determined by 2-way ANOVA with Dunnett multiple comparisons test (p < 0.05 considered significant). Error bars indicate SEM. D) IGFBP3 protein levels (pg/mL) in serum from one-month-old mice determined with ELISA. N = 2 WT mice, N = 11 Igfbp3+/− mice, and N = 4 Igfbp3−/− mice (male and female). P-value determined by 2-way ANOVA with Tukey multiple comparisons test (p < 0.05 considered significant). Error bars indicate SEM. E) Confocal microscopic image of an immunofluorescently-stained pH 3+ cardiomyocyte (yellow lines correspond to z stack axes) from a WT heart. Scale bar 15 μm. F) Quantification of pH 3+ CM per high-powered field (hpf). N = 3 mice per group (male and female). P-value determined by Student’s t-test. Error bars indicate SEM. G) Immunofluorescently-labeled microscopic image of inter-myocyte Aurora B kinase staining in WT P1 MI tissue 3 days after MI in the control heart. Scale bar 25 μm. H) Quantification of Aurora kinase B-positive cardiomyocytes per high-powered field (hpf). N = 3 mice per group (male and female). P-value determined by Student’s t-test. Error bars indicate SEM. I) Representative M-mode echocardiographic images at the level of the papillary muscle from hearts 4 weeks after P1 MI. J,K) Systolic function 4 weeks after P1 MI. N = 5 WT mice and N = 7 Igfbp3− /− mice (male and female). P-value determined by Student’s t-test. Error bars indicate SEM. L) Representative short-axis Picosirius Red-stained cardiac sections 4 weeks after P1 MI below level of ligature from base to apex. Scale bar 100 μm. M) Fibrosis quantification 4 weeks after P1 MI using Picosirius Red staining. N = 3 WT mice and N = 5 Igfbp3− /− mice (male and female). P-value determined by Student’s t-test. Error bars indicate SEM.
Fig. 3.
Fig. 3.
Recombinant IGFBP3 promotes cardiomyocyte proliferation in vitro and in vivo. A) Genetic lentiviral construct for recombinant Igfbp3-flag (rIGFBP3) expression in 293 T cells and schematic outlining experimental approach. B) Igfbp3 mRNA expression in WT or Igfbp3 LV-infected 293 T cells using qPCR (18S used as housekeeping reference gene.) N = 3 per group. P-value determined by Student’s t-test. Error bars indicate SEM. C) IGFBP3 protein levels in the conditioned medium of 293 T cells (pg/mL) determined with ELISA. N = 3 WT mice, N = 2 Igfbp3OE mice. P-value determined by Student’s t-test. Error bars indicate SEM. D) Western blot for Flag from cellular lysates of 293 T cell lines. E) Western blot for IGFBP3 on purified rIGFBP3-Flag protein with or without treatment with PNGase F. F) Quantification of pH 3+ NRVM per high-powered field (hpf) with incubation with vehicle control or rIGFBP3. N = 9 hpf per group derived from N = 3 coverslips per group; cells derived from N = 2 rats (male and female). P-value determined by Student’s t-test. Error bars indicate SEM. G) Epifluorescent microscopic images of NRVM co-incubated with vehicle control or with rIGFBP3. Scale bar 100 μm. H) pH 3 immunofluorescent staining of cardiac sections 2 days after intracardiac injection of vehicle control or rIGFBP3. Arrows indicate pH 3+ CM. Scale bar 100 μm. I) Quantification of pH 3+ CMs in cardiac sections from intracardiac-injected rIGFBP3 or control hearts. N = 3 mice per group (male and female). P-value determined by Student’s t-test. Error bars indicate SEM. J) Representative MADM epifluorescent image from rIGFBP3-injected heart. Scale bar 50 μm. (Inset showing higher-magnification of TdT+ single-label cell and GFP+ single-label cell. Scale bar 12.5 μm.) K-L) Quantification of total single-labeled cells (relative to all labeled cells) and their individual components (GFP+ or TdT+) in the MADM labeling experiment. N = 3 mice per group (male and female). P-value determined by Student’s t-test. Error bars indicate SEM.
Fig. 4.
Fig. 4.
Transgenic IGFBP3 expression stimulates postnatal cardiomyocyte mitosis in vivo. A) Genetic model of knock-in Igfbp3-overexpression model and crosses with endothelial-specific Cre drivers. B) Schematic depicting approach to validate Igfbp3-overexpression mouse model using an in vitro CM-based ELISA assay. C) IGFBP3 protein levels (pg/mL) from conditioned medium of primary mouse ear-tip fibroblasts derived from two knock-in transgenic lines and wild-type control. N = 3 mice per group (male and female) defined as littermates derived from the same knock-in parent. P-value determined by Student’s t-test. Error bars indicate SEM. D) IGFBP3 protein level (pg/mL) from serum determined with ELISA. N = 3 mice per group (male and female). P-value determined by Student’s t-test. Error bars indicate SEM. E) HW/BW ratios (mg/g) of P7 mice. N = 3 mice per group (male and female). P-value determined by Student’s t-test. Error bars indicate SEM. F) Cardiomyocyte Cross-sectional area (CSA) quantification using WGA staining from P7 hearts and representative confocal microscopy images. Scale bar 20 μm. N = 3 mice per group (male and female). P-value determined by Student’s t-test. Error bars indicate SEM. G) Quantification of pH 3+ cardiomyocytes per total CMs from P7 mice. N = 3 control mice and N = 5 Tie2OE mice (male and female). P-value determined by Student’s t-test. Error bars indicate SEM. H) Representative confocal microscope image of cardiac section immunostained against pH 3 and TnT from Tie2OE heart (yellow and brown lines correspond to respective z stack axes). Scale bar 25 μm. I) Quantification of Aurkb+ cardiomyocytes per total CMs from P7 mice. N = 3 control mice and N = 5 Tie2OE mice (male and female). P-value determined by Student’s t-test. Error bars indicate SEM. J) Representative epifluorescent microscope image of cardiac section immunostained against Aurora kinase B (Aurkb) and TnT from Tie2OE heart. Scale bar 25 μm. K) Total number of cardiomyocytes per heart after digestion. N = 3 mice per group (male and female), with representative images from bright-field microscope. P-value determined by Student’s t-test. Error bars indicate SEM. Scale bar 100 μm. L) Timeline for adult MI model experimental setup. M) Representative example of pH 3-positive cardiomyocyte from Cdh5OE MI model. N) Quantification of pH 3-positive cardiomyocytes per total CMs after MI. N = 5 control mice and N = 4 Cdh5OE mice (male and female). P-value determined by Student’s t-test. Error bars indicate SEM. O) Ejection fraction (%) values at different time points post-MI. N = 7 control mice and N = 4 Cdh5OE mice (male and female). P-value determined by Student’s t-test. Error bars indicate SEM. P) Representative Masson Trichrome-stained cross-sections of the post-MI hearts for each genotype. Scale bar 1 mm. Q) Quantification of fibrosis percentage of the total cross-section tissue area according to genotype. N = 7 control mice and N = 4 Cdh5OE mice (male and female). P-value determined by Student’s t-test. Error bars indicate SEM.
Fig. 5.
Fig. 5.
IGFBP3 and its regulators modulate IGF signaling after neonatal MI. A) Epifluorescent microscope image of wild-type NRVMs co-cultured with HEK cells expressing IGFBP3 -mOrange fusion protein (scale bar 25 μm.) B) Immunoblot of pIGF1R/pINSR, total INSR, and GADPH performed on cardiac tissue obtained 3 days after P1 sham or MI injuries in control and Igfbp3− /− and control mice. N = 2 mice per group (male and female). C) Epifluorescent microscope image of P1 MI tissue from control and Igfbp3− /− hearts immunostained for TnT, pINSR, and DAPI 3 days after surgery; scale bar 100 μm. (Inset box in Control displayed in-zoom in Fig. S4F). D) Relative mRNA expression of Pappa2 3 days after P1 MI (red) or sham (blue) operations using qPCR from bulk ventricular tissue (relative to 18S). N = 3 mice per group (male and female). P-value determined by Student’s t-test. Error bars indicate SEM. E) Epifluorescent microscope images of immunofluorescently-labeled PAPPA2 and TnT cardiac sections 3 days after P1 MI (full cardiac section in the top right, scale bar 500 μm). Dashed white lines demarcate infarct border (E’ is boxed inset of E. Scale bar 100 μm.) F) mRNA expression (RPKM) of Stc2 at different time points after P1 sham or MI from bulk ventricular tissue. N = 3 mice per group. P-value determined by Student’s t-test. Error bars indicate SEM [derived from Ref 13]. G) Epifluorescent microscope images of immunofluorescent-labeled Stc2 and TnT cardiac sections 3 days after P1 MI; scale bar 300 μm. Dashed white lines demarcate infarct border. Inset scale bar 100 μm. Error bars indicate S.E.M.

References

    1. Laflamme MA, Murry CE, Heart regeneration, Nature 473 (7347) (2011) 326–335. - PMC - PubMed
    1. Martin SS, Aday AW, Allen NB, Almarzooq ZI, Anderson CAM, Arora P, et al. , 2025 heart disease and stroke statistics: a report of US and global data from the American Heart Association, Circulation 151 (8) (2025) e41–e660. - PMC - PubMed
    1. Ali SR, Lam NT, Sadek HA, 3 - cellular basis for myocardial regeneration and repair, in: Felker GM, Mann DL (Eds.), Heart Failure: A Companion to Braunwald’s Heart Disease, Fourth edition, Elsevier, Philadelphia, 2020, pp. 43–61, e3.
    1. Senyo SE, Steinhauser ML, Pizzimenti CL, Yang VK, Cai L, Wang M, et al. , Mammalian heart renewal by pre-existing cardiomyocytes, Nature 493 (7432) (2013) 433–436. - PMC - PubMed
    1. Ali SR, Hippenmeyer S, Saadat LV, Luo L, Weissman IL, Ardehali R, Existing cardiomyocytes generate cardiomyocytes at a low rate after birth in mice, Proc. Natl. Acad. Sci. USA 111 (24) (2014) 8850–8855. - PMC - PubMed

MeSH terms

Substances

LinkOut - more resources