. 2025 Aug 18;13(8):e008972.
doi: 10.1136/jitc-2024-008972.

Pharmacological and structural characterization of vibostolimab, a novel anti-TIGIT blocking antibody for cancer immunotherapy

Affiliations

Pharmacological and structural characterization of vibostolimab, a novel anti-TIGIT blocking antibody for cancer immunotherapy

Thierry O Fischmann et al. J Immunother Cancer. .

Abstract

Background: Vibostolimab is a humanized anti-T cell immunoreceptor with immunoglobulin (Ig) and ITIM domains (TIGIT) antibody was recently investigated in late-stage clinical trials. Vibostolimab was developed based on its specific binding property to the human and cynomolgus monkey TIGIT protein and its functional blocking activity of the TIGIT:CD155 interaction.

Methods: The biochemical properties of vibostolimab, in a comparison with tiragolumab, were assessed with Biacore, nuclear magnetic resonance (NMR), and X-ray crystallography, while the T-cell activation was examined using engineered Jurkat cells in an in vitro co-culture system by measuring interleukin (IL)-2 production as a readout of T-cell activation. The mouse surrogate anti-TIGIT antibodies were identified and used to extensively investigate the mechanism of action of anti-TIGIT antibodies as monotherapy or in combination with anti-programmed cell death protein-1 (PD-1) antibody in vivo by gene expression profiling and flow cytometry analyses with a mouse syngeneic tumor model.

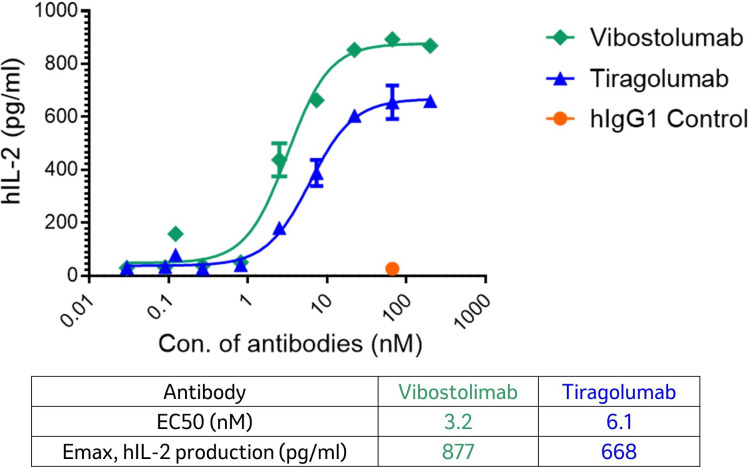
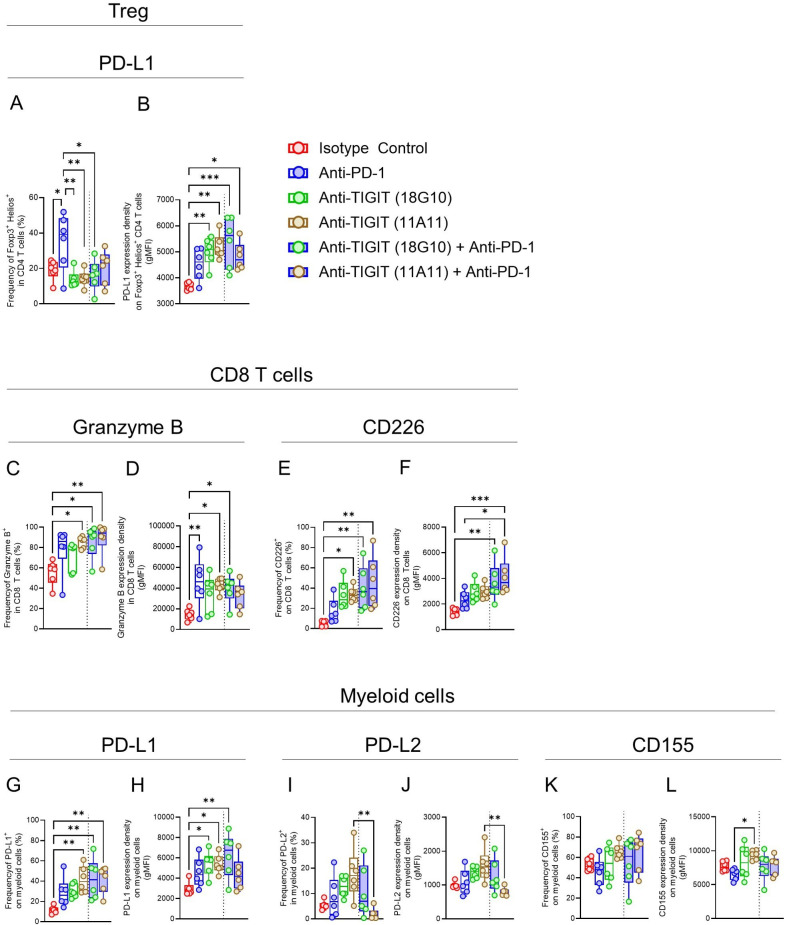
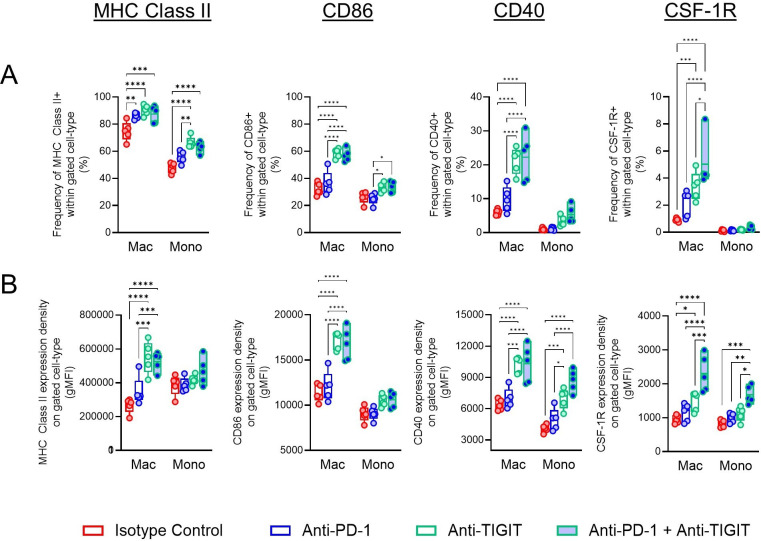
Results: Structural analyses with solution NMR and X-ray crystallography revealed that vibostolimab binds the CC'C''FG loop interface of TIGIT, completely competing for the binding site of CD155 with a larger coverage area than another anti-TIGIT antibody tiragolumab, consistent with surface plasmon resonance analysis, though mouse models with similar antibodies revealed no functional difference in antitumor efficacy. Biacore-based binding data indicate that both vibostolimab and tiragolumab bind on TIGIT with comparable binding affinity (KD), but different binding kinetics characterized by faster on and off rates, which may contribute to enhanced T-cell activation with vibostolimab, as evidenced by greater IL-2 production in an in vitro cell-based assay. Functional experiments in mouse models demonstrated additional detailed biological mechanisms of the mouse equivalent of vibostolimab, including the differentiating role of myeloid cell activation in addition to improved T cell cytolytic activity, both of which are further enhanced by anti-PD-1 combination therapy.

Conclusions: Vibostolimab is a novel anti-TIGIT antibody that completely blocks CD155 binding and induces T-cell activation. From experiments using a mouse tumor model and mouse surrogate anti-TIGIT antibody, we demonstrate direct evidence where it not only activates cytotoxic T cells but also induces the activation of antigen-presenting cells. The clinical relevance of vibostolimab, based on these mechanisms, in combination with pembrolizumab was recently tested in registrational trials.

Keywords: Immune Checkpoint Inhibitor; Immunotherapy; Monoclonal antibody; T cell.


Conflict of interest statement

Competing interests: All authors are employees of Merck Sharp & Dohme LLC, a subsidiary of Merck & Co, Rahway, New Jersey, USA and shareholders of Merck & Co, Rahway, New Jersey, USA.

Figures

Figure 1
Figure 1. Antigen binding and functional ligand blocking property of vibostolimab. (A) Binding of vibostolimab and a tiragolumab analog to TIGIT was assessed using CHO-K1 cells expressing human TIGIT. (B) Recombinant CD155 protein conjugated with HRP was loaded in vibostolimab-bound or tiragolumab-bound TIGIT-expressing CHO-K1 cells to evaluate blocking of TIGIT:CD155 interaction by the anti-TIGIT antibodies. Representatives from two experiments with technical triplicates are shown. HRP, horseradish peroxidase; TIGIT, T cell immunoreceptor with immunoglobulin (Ig) and ITIM domains.
Figure 2
Figure 2. Characterization of vibostolimab and tiragolumab binding to TIGIT by Biacore. (A) vibostolimab and tiragolumab were captured via their Fc regions and human TIGIT was injected at concentrations of 0.51 nM to 20 nM (colored curves). Data were fit to a 1:1 binding model (black curves). Kinetic and affinity constants are in the table below. (B) vibostolimab, tiragolumab, or a buffer control were injected sequentially over immobilized TIGIT to demonstrate that the antibodies have overlapping epitopes and block one another binding to TIGIT. Representatives from two experiments with technical triplicates are shown. Student’s t-test was used for statistical analysis. ns, not significant (p>0.05). RU, response unit; TIGIT, T cell immunoreceptor with immunoglobulin (Ig) and ITIM domains; ka, association rate constant; kd, dissociation rate constant; KD, equilibrium dissociation constant.
Figure 3
Figure 3. Structural analysis of the vibostolimab:TIGIT complex. Molecular interaction between vibostolimab and TIGIT was investigated by (A) Solution NMR or (B–G) X-ray crystallography. (A) Mapping on the TIGIT-CD155 X-ray crystal structure (PDB 3UDW) of amino acids involved in antibody-TIGIT interactions according to NMR. The proteins are represented as a cartoon. The colors are in green for TIGIT and gray for CD155. Red and purple mark the positions of residues with significant shifts and undetermined shifts, respectively. (B) Overall view of the Fab-TIGIT complex. (C) The Fab is represented as a ribbon, with the following coloring scheme: heavy and light chain variable regions in dark blue and cyan, respectively, and heavy and light chain constant regions in red and orange, respectively. The antigen is shown as a cartoon and is colored green. (C) Electron density around the Fab-antigen interface contoured at 2.0 r.m.s.d. The density is represented as a grid, the proteins as sticks, and the waters as spheres. The methyls of each chain are colored according to the chain they belong to using the same hues as in figure 1; otherwise nitrogen, oxygen and sulfur atoms are colored blue, red and yellow, respectively; water molecules are shown as red spheres (D) and (E). Details of the vibostolimab Fab-TIGIT interface. The structures are represented as ribbons. Additionally, the atoms of side chains involved in polar interactions are shown as sticks, and likewise for main-chain atoms, with oxygen and nitrogen painted in red and blue, respectively. A sphere designates the Ca position of an amino acid involved in non-polar interactions only. All epitope residues Ca are labeled. The two views are related by a 90° rotation around a vertical axis. (F) Comparison of the structures of TIGIT in the free (PDB 3Q0H) and Fab-bound structures. The protein structures are represented as ribbons, and the main-chain or side-chain atoms of key residues are displayed as sticks. Key polar interactions are indicated with red dashes, whereas black dashes highlight the largest Ca motions found in two loops. Colors are consistent with (A) for the Fab-antigen complex, while the Fab-free methyls are colored in gray. (G) Comparison of the orientations of the Fab in the Fab-TIGIT complex with that of CD155 in the CD155-TIGIT costructure. The overall orientation, ribbon representation and color scheme are the same as for figure 1; additionally, the TIGIT molecule from the TIGIT-CD155 complex (PDB 3UDW) is shown as a gray ribbon after superposition to its structure in the Fab-bound antigen; in this superposition, the TIGIT-CD155 complex is moved as a rigid block and CD155 is shown as a ribbon in pink color. Fab, fragment antigen-binding; NMR, nuclear magnetic resonance; r.m.s.d., root mean square deviation; TIGIT, T cell immunoreceptor with immunoglobulin (Ig) and ITIM domains.
Figure 4
Figure 4. Vibostolimab versus tiragolumab structural comparison. Comparison of the epitopes in the vibostolimab and tiragolumab Fab-TIGIT complexes. The overall orientation, ribbon representation and color scheme are the same as for figure 3 (heavy and light chain variable regions in dark blue and cyan, respectively, and heavy and light chain constant regions in red and orange, respectively). The antigen is shown as a cartoon and is colored green. Additionally, the TIGIT molecule from the tiragolumab-TIGIT complex is shown as a gray ribbon after a superposition using the same molecule in the vibostolimab-TIGIT complex as reference. In this superposition, the tiragolumab-TIGIT complex is moved as a rigid body. The tiragolumab Fab is colored in pink. (A) is (B) but rotated by 90° around a horizontal axis. (C) to (D) Comparison of the (C) vibostolimab and (D) tiragolumab epitopes. The antigen is oriented with the antigenic surface facing the viewer. The protein is represented with cartoons. The molecular surface of TIGIT is shown as semitransparent and is colored green, except for surface atoms in contact with the antibody, which is defined by being less than 4.0 Å away: the surface is then colored in magenta. Fab, fragment antigen-binding; TIGIT, T cell immunoreceptor with immunoglobulin (Ig) and ITIM domains.
Figure 5
Figure 5. Induction of immune activation by vibostolimab in in vitro stimulation. Human TIGIT-expressing Jurkat cells, stimulated with anti-CD3 antibody, were co-incubated with human CD155-expressing JY cells in the presence of serially diluted anti-TIGIT antibodies. IL-2 was detected after 16–24 hours of incubation. This is a representative of two independent experiments with consistent results. Student’s t-test was used for statistical analysis. *p<0.05. IL-2, interleukin-2; TIGIT, T cell immunoreceptor with immunoglobulin (Ig) and ITIM domains.
Figure 6
Figure 6. Characterization of anti-mouse TIGIT antibody clones, 18G10 and 11A11. (A) Binding and blocking activities of anti-mouse TIGIT antibodies, 18G10 and 11A11, were measured by ELISA assay. Binding of anti-mouse TIGIT antibodies to coated recombinant mouse TIGIT protein was detected by bound anti-mouse IgG. Functional blocking of mouse CD155 and TIGIT by anti-mouse TIGIT antibodies was measured by adding recombinant mouse CD155:hIgG-Fc fusion protein when anti-mouse TIGIT antibodies were bound to the coated recombinant mouse TIGIT protein. (B) Anti-mouse TIGIT antibody clones, 18G10 and 11A11, were injected sequentially over immobilized mouse TIGIT to demonstrate that the antibodies have overlapping epitopes and block one another binding to TIGIT by Biacore. mAb, monoclonal antibody; OD, optical density; RU, response unit; TIGIT, T cell immunoreceptor with immunoglobulin (Ig) and ITIM domains.
Figure 7
Figure 7. Gene expression profile in sorted tumor-infiltrating leukocytes induced by anti-TIGIT antibody treatment in vivo. CD8 T cells, Tregs, myeloid cells, and NK cells were sorted from CT26 tumor, as described in online supplemental figure, after two doses (8 days) of isotype control (red circles), anti-PD-1 (blue circles), or anti-TIGIT (green circles) antibody injection. Relative gene expression was measured using TaqMan analysis for chemokine [(A) Cxcl10 and (B) Cxcl11], Treg identity/function [(C) Foxp3 and (D) Helios], effector molecules [(E) Gzmb, (F) Gzmk, (G) Ifng, and (H) Pfr1], PD-1 pathway [(I) Pdcd1 (PD-1), (J) Cd28, (K) Cd274 (PD-L1), and (L) Pdcd1Ig2 (PD-L2)], TIGIT pathway [(M) Tigit, (N) Cd226 (DNAM-1), and (O) Pvr (CD155)], and costimulatory molecules [(P) Cd80 (B7-1) and Cd86 (B7-2)]. Each value of gene expression is normalized to the values of the house-keeping gene, mouse Ubiquitin B (Ubb), and depicted relative to the normalized value of the gene in the unsorted whole tumors (black circles) as an average of 1. The line inside each box represents a median value of the group. Two-way ANOVA followed by Tukey’s post hoc comparison was used for statistical analysis. *p<0.05; **p<0.01; ***p<0.001; ****p<0.0001; ns, not significant (p>0.05). ANOVA, analysis of variance; NK, natural killer; PD-1, programmed cell death protein-1; PD-L1, programmed death-ligand 1; TIGIT, T cell immunoreceptor with immunoglobulin (Ig) and ITIM domains; Treg, regulatory T cell.
Figure 8
Figure 8. Flow cytometry analysis of coinhibitory and costimulatory receptors in TME induced by anti-TIGIT antibody and its combination with anti-PD-1 in vivo. CT26 tumors were harvested 4 days after two doses (day 0 and day 4) of antibody treatments as indicated for flow cytometry analysis to characterize (A) the frequency of and (B) surface PD-L1 expression on Treg; the frequency and the density of granzyme B (C and D) or CD226 (E and F) expression inside or on the surface of CD8 T cells, respectively; the frequency and the density of PD-L1 (G and H), PD-L2 (I and J), and CD155 (K and L) on myeloid cells. Two-way ANOVA followed by Tukey’s post hoc comparison was used for statistical analysis. Antibody staining procedure is described in Methods and the gating strategy is shown in online supplemental figure 6). *p<0.05; **p<0.01; ***p<0.001; ****p<0.0001. The comparisons with no asterisk mean not statistically significant. ANOVA, analysis of variance; gMFI, or geometric mean fluorescence intensity; PD-1, programmed cell death protein-1; PD-L1, programmed death-ligand 1; TIGIT, T cell immunoreceptor with immunoglobulin (Ig) and ITIM domains; TME, tumor microenvironment; Treg, regulatory T cell.
Figure 9
Figure 9. Flow cytometry analysis of myeloid activation in TME induced by anti-TIGIT antibody and its combination with anti-PD-1 in vivo. CT26 tumors were harvested from WT mice after two doses of treatments as indicated (at day 0 and day 4). Antibody staining procedure is described in Methods and the gating strategy for macrophages (Mac) or monocytes (Mono) is shown in online supplemental figure 7. (A) Frequency of MHC Class II-, CD86-, CD40-, and CSF-1R-expressing macrophages or monocytes and (B) surface expression density of MHC Class II, CD86, CD40, or CSF-1R on macrophages or monocytes are depicted. Two-way ANOVA followed by Tukey’s post hoc comparison was used for statistical analysis. *p<0.05; **p<0.01; ***p<0.001; ****p<0.0001. The comparisons with no asterisk mean not statistically significant. ANOVA, analysis of variance; gMFI, or geometric mean fluorescence intensity; MHC, major histocompatibility complex; PD-1, programmed cell death protein-1; TIGIT, T cell immunoreceptor with immunoglobulin (Ig) and ITIM domains; TME, tumor microenvironment

References

    1. Sung H, Ferlay J, Siegel RL, et al. Global Cancer Statistics 2020: GLOBOCAN Estimates of Incidence and Mortality Worldwide for 36 Cancers in 185 Countries. CA Cancer J Clin. 2021;71:209–49. doi: 10.3322/caac.21660. - DOI - PubMed
    1. Burugu S, Dancsok AR, Nielsen TO. Emerging targets in cancer immunotherapy. Semin Cancer Biol. 2018;52:39–52. doi: 10.1016/j.semcancer.2017.10.001. - DOI - PubMed
    1. Hashimoto M, Kamphorst AO, Im SJ, et al. CD8 T Cell Exhaustion in Chronic Infection and Cancer: Opportunities for Interventions. Annu Rev Med. 2018;69:301–18. doi: 10.1146/annurev-med-012017-043208. - DOI - PubMed
    1. Leach DR, Krummel MF, Allison JP. Enhancement of antitumor immunity by CTLA-4 blockade. Science. 1996;271:1734–6. doi: 10.1126/science.271.5256.1734. - DOI - PubMed
    1. Iwai Y, Ishida M, Tanaka Y, et al. Involvement of PD-L1 on tumor cells in the escape from host immune system and tumor immunotherapy by PD-L1 blockade. Proc Natl Acad Sci U S A. 2002;99:12293–7. doi: 10.1073/pnas.192461099. - DOI - PMC - PubMed

MeSH terms

Substances