. 2025 Dec;57(1):2548042.
doi: 10.1080/07853890.2025.2548042. Epub 2025 Aug 19.

Anoikis-related genes predicts prognosis and therapeutic response in renal cell carcinoma

Affiliations

Anoikis-related genes predicts prognosis and therapeutic response in renal cell carcinoma

Lizhi Zhou et al. Ann Med. 2025 Dec.

Abstract

Background: Metastasis represents the primary cause of cancer-related mortality, with a high incidence observed in renal cell carcinoma (RCC). Anoikis, a specialized form of apoptosis, plays a crucial role in preventing displaced cells from adhering to new extracellular matrices (ECM), thus inhibiting their aberrant growth. Notably, cancer cells, especially metastatic ones, exhibit resistance to anoikis. However, the exact mechanisms of anoikis resistance in RCC are not well understood.

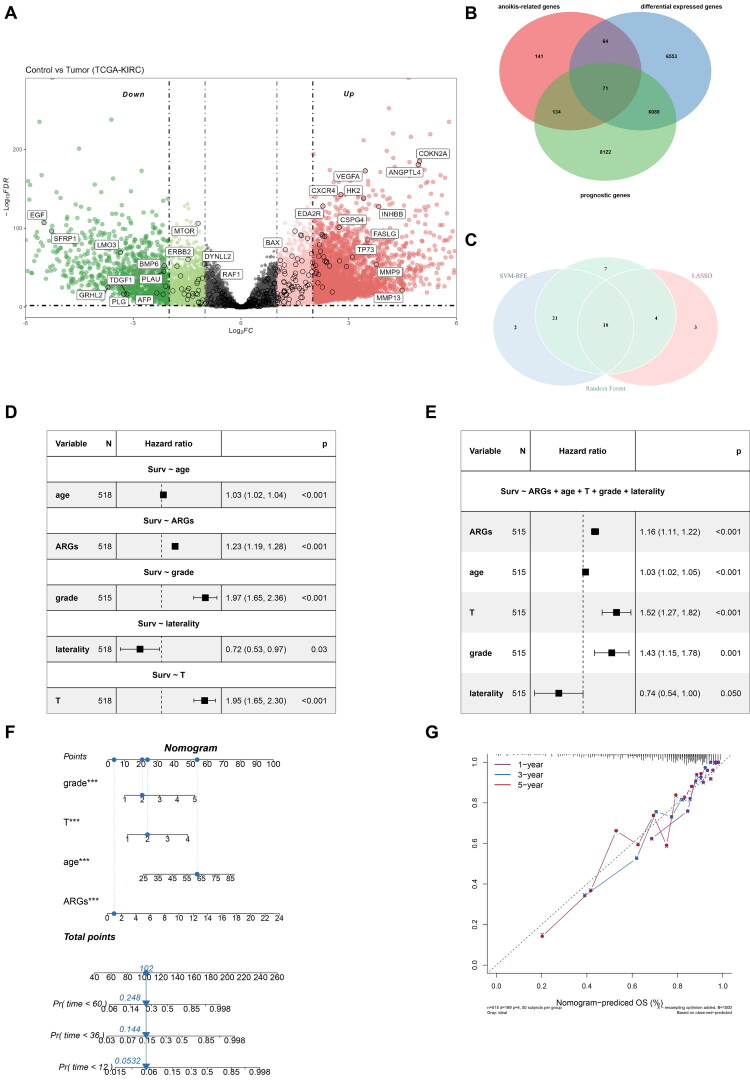
Methods: This study integrates bioinformatics, single-cell RNA sequencing and experimental validation to investigate the role of anoikis-related genes (ARG) in RCC, with a focus on MMP9. RNA-seq data from 518 RCC patients and 71 healthy controls (TCGA-KIRC) and external validation cohorts (E-MTAB-1980, GSE22541) were analyzed to construct an ARG-based prognostic model. Single-cell RNA sequencing (scRNA-seq, GSE159115) was used to assess tumour heterogeneity, while in vitro experiments in RCC cell lines validated MMP9's impact on anoikis resistance, migration and invasion.

Results: We collected all RNA-seq and single-cell RNA-seq (scRNA-seq) data from multiple online databases and utilized these datasets to develop a novel ARG-based prognostic model called ARGs. Using Cox regression and machine learning, our model achieved a 5-year area under curve (AUC) of 0.79, surpassing existing models in predictive performance. Enrichment analysis revealed distinct immune and metabolic landscapes between ARGs high- and low-risk groups. At the single-cell level, tumour cells were categorized based on ARG expression, revealing heterogeneous anoikis resistance mechanisms. MMP9 was identified as a key prognostic gene (HR = 1.5, p = 0.016) associated with anoikis resistance and RCC metastasis. Functional assays confirmed that MMP9 knockdown increased anoikis by 59% and significantly reduced wound-healing migration by about 30% and transwell invasion by 50%, reinforcing its role in RCC progression.

Conclusions: Targeting anoikis-related genes, particularly MMP9, enhances anoikis sensitivity and reduces RCC invasiveness, offering a potential therapeutic strategy to mitigate metastasis and improve clinical outcomes.

Keywords: Anoikis; MMP9; metastasis; renal cell carcinoma.


Conflict of interest statement

No potential conflict of interest was reported by the authors.

Figures

Figure 1.
Figure 1.
Construction of ARGs and the nomogram. (a) Volcano plot of the DEGs between tumour and normal samples (TCGA-KIRC); (b) Venn plot shows the intersection genes for further screen; (c) Venn plot shows the machine-learning result; (d) Univariate cox regression on ARGs; (e) Multivariate cox regression on ARGs; (f) Nomogram constructed with ARGs and other clinical features; (g) The calibration curves of nomogram.
Figure 2.
Figure 2.
The prognostic value of ARGs. (a) K-M plots of two groups in three datasets; (b) The distribution of patients and heatmap of DEGs between two groups; (c) Time-ROC curve of ARGs; (d) The AUC of ARGs compared to other published signatures; (e) ROC curves show the ARGs’ efficacy in discriminating primary and metastases ccRCC.
Figure 3.
Figure 3.
ARGs predict survival and response to immunotherapy and TKIs. (a) K-M plots of two groups in immunotherapy and TKIs treated cohorts; (b) The CR/PR ratio between two groups; (c) Boxplot of immunotherapeutic targets mRNA expression between two groups; (d) Boxplot of targeted-therapeutic targets mRNA expression between two groups.
Figure 4.
Figure 4.
The potential mechanisms and pathways of ARGs. (a) Top GO enrichment; (b) Top KEGG pathway enrichment; (c) GSVA analysis of hallmark pathways; (d) GSVA analysis of metabolic pathways; (e) GSEA analysis of several pathways.
Figure 5.
Figure 5.
ARGs associates with tumour immune microenvironment. (a) The proportion of immune cells between two groups calculated by CIBERSORT; (b) The correlation between immune cells and ARGs; (c) The immune score calculated by ESTIMATE; (d) The correlation between tumour purity and ARGs.
Figure 6.
Figure 6.
Somatic mutations atlas of the ARGs high- and low-risk groups and candidate drugs. (a) The top mutated genes in two groups; (b) Lolipop plots show the mutation sites of genes; (c) The co-mutations observed by heatmap; (d) Boxplots shows TMB; (e) Estimation of drug sensitivity according to CTRP database; (f) Top 5 candidate compounds of ARGs-high group.
Figure 7.
Figure 7.
Heterogeneity between the two groups of tumour cells at single-cell level. (a) tSNE plot shows all cells in GSE159115; (b) tSNE plot shows tumour cells with different Seurat clusters; (c) ARGscore calculated by AddModuleScore; (d) GO/KEGG enrichment between two subgroups of tumour cells; (e) Cancer hallmark pathways between two subgroups; (f) Metabolic pathways between two subgroups.
Figure 8.
Figure 8.
Pseudotime analysis and cell-cell communications. (a) The ARGscores increase with pseudotime; (b) The dynamic change of signature genes during the development of tumour cells; (c) Ligands-receptors-targets regulatory network between ARGs_High tumour cells and T cells; (d) Ligands-receptors-targets regulatory network between ARGs_Low tumour cells and T cells; (e) Scenic predicts the top transcription factors in two subgroups of tumour cells.
Figure 9.
Figure 9.
MMP9 was involved in the anoikis resistance of RCC and knockdown of MMP9 significantly attenuated migration by accelerating anoikis in 786 O cells. (a) Morphological representation of anoikis models established by poly-HEMA, scale bars: 50 μm; (b & c) Flowcytometry analysis showed that the percentage of apoptosis increased with the duration of poly-HEMA treatment; (d) qRT-PCR analysis showed significant overexpression of MMP9 in 786 O cell line compared to HK-2 cell line; (e & f) Western blot studies showed that MMP9 was downregulated in poly-HEMA-treated 786 O cells; (g & h) Western blot studies confirmed lentivirus-mediated knockdown of MMP9; (i & j) Wound-healing assay indicated knockdown of MMP9 attenuated migration capacity of 786 O cells, scale bars: 100 μm; (k & l). Transwell assay indicated knockdown of MMP9 alleviated invasion capacity of 786 O cells; (m – p) Flow cytometry analysis and western blot studies demonstrated that knockdown of MMP9 significantly aggravated poly-HEMA induced anoikis. *p < 0.05, **p < 0.01, ***p < 0.001, ****p < 0.0001.
Figure 10.
Figure 10.
MMP9 knockdown attenuated migration by exacerbating anoikis in Achn cells as well. (a) Morphological representation of Achn anoikis models established by poly-HEMA, scale bars: 50 μm; (b & c) Western blot studies showed that MMP9 was downregulated in poly-HEMA-treated Achn cells; (d & e) Western blot studies confirmed lentivirus-mediated knockdown of MMP9; (f & g) Wound-healing assay indicated knockdown of MMP9 attenuated migration of Achn cells, scale bars: 100 μm; (h & i). Transwell assay alleviated invasion capacity of Achn cells; (j & k). Western blot studies demonstrated that knockdown of MMP9 significantly aggravated poly-HEMA induced anoikis in Achn cells. *p < 0.05, **p < 0.01, ***p < 0.001.

Similar articles

References

    1. Sung H, Ferlay J, Siegel RL, et al. Global Cancer Statistics 2020: GLOBOCAN estimates of incidence and mortality worldwide for 36 cancers in 185 countries. CA Cancer J Clin. 2021;71(3):209–249. doi: 10.3322/caac.21660. - DOI - PubMed
    1. Linehan WM. Genetic basis of kidney cancer: role of genomics for the development of disease-based therapeutics. Genome Res. 2012;22(11):2089–2100. doi: 10.1101/gr.131110.111. - DOI - PMC - PubMed
    1. Pal S, Gong J, Mhatre SK, et al. Real-world treatment patterns and adverse events in metastatic renal cell carcinoma from a large US claims database. BMC Cancer. 2019;19(1):548. doi: 10.1186/s12885-019-5716-z. - DOI - PMC - PubMed
    1. Padala SA, Barsouk A, Thandra KC, et al. Epidemiology of renal cell carcinoma. World J Oncol. 2020;11(3):79–87. doi: 10.14740/wjon1279. - DOI - PMC - PubMed
    1. Sellner F, Compérat E, Klimpfinger M.. Genetic and epigenetic characteristics in isolated pancreatic metastases of clear-cell renal cell carcinoma. Int J Mol Sci. 2023;24(22):16292. doi: 10.3390/ijms242216292. - DOI - PMC - PubMed

MeSH terms

Substances

LinkOut - more resources