. 2025 Aug 19;16(1):7715.
doi: 10.1038/s41467-025-62234-7.

Integrative proteogenomic characterization of Wilms tumor

Affiliations

Integrative proteogenomic characterization of Wilms tumor

Cheng Cheng et al. Nat Commun. .

Abstract

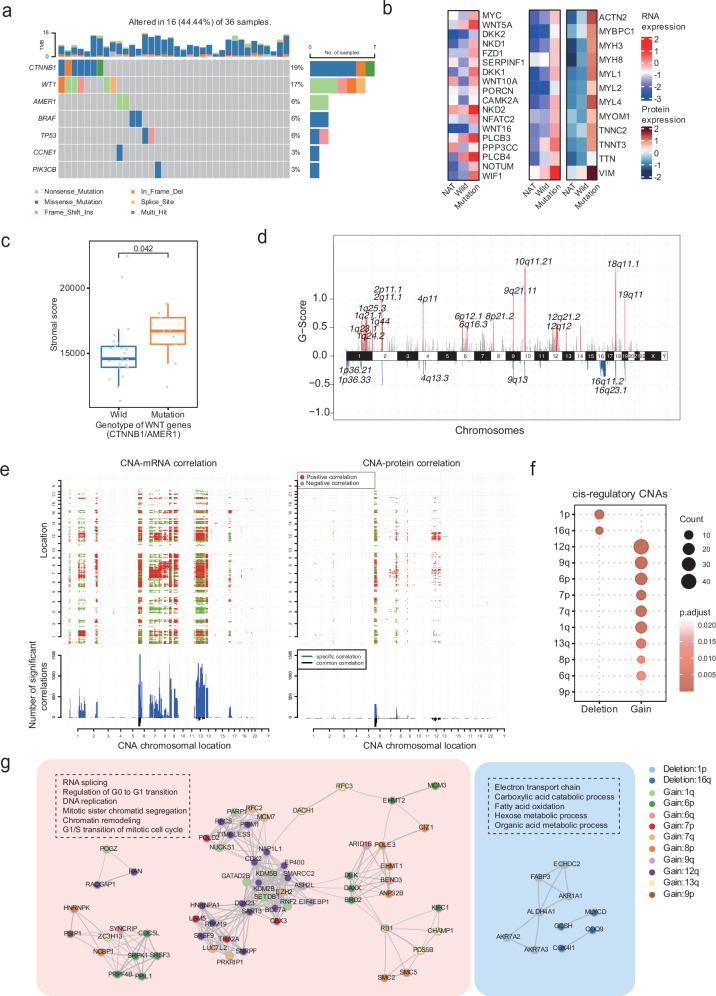
Wilms tumor (WT), the most common pediatric renal malignancy, exhibits a relatively low mutational burden compared to adult cancers, which hinders the development of targeted therapies. To elucidate the molecular landscape of WT, we perform integrative proteomic, phosphoproteomic, transcriptomic, and whole-exome sequencing analyses of WT and normal kidney tissue adjacent to tumor. Our multi-omics approach uncovers prognostic genetic alterations, distinct molecular subgroups, immune microenvironment features, and potential biomarkers and therapeutic targets. Proteome- and transcriptome-based stratification identifies three molecular subgroups with unique signatures, correlating with different histopathological subtypes and putative cellular origins at different stages of embryonic kidney development. Notably, we identify EHMT2 as a promising prognostic biomarker and therapeutic target associated with epigenetic regulation and Wnt/β-catenin pathway. In this work, we provide a comprehensive molecular characterization of WT, offering valuable insights into its pathogenesis and a foundational resource for future therapeutic development.


Conflict of interest statement

Competing interests: All authors declare no competing interests.

Figures

Fig. 1
Fig. 1. Study design and proteogenomic landscape of Wilms Tumor cohort.
a The study design and overview of the multi-omics landscape of Wilms tumor. b Patient-centric Circos plot, with each circle representing one omics of WT (Wilms tumor)/NATs (normal adjacent to tumor). Gray gaps indicate unmeasured data. c Pie charts illustrate the patient distribution within the WT cohort based on key clinical and prognostic variables such as sex, tumor histology, risk group, tumor site, preoperative chemotherapy, distant metastasis, tumor stage, and prognostic outcomes in this study. d Boxplots showing the distribution of the number of RNAs, proteins, phosphorylated sites, and phosphorylated proteins identified by multi-omics profiling in WT and NATs. Blue: NATs; orange: WT. A two-sided Wilcoxon rank sum test was performed to determine the difference between WT and NATs. RNAs: NAT (n = 37), WT (n = 62); proteins: NAT (n = 71), WT (n = 88); phosphorylated sites: NAT (n = 23), WT (n = 23); phosphorylated proteins: NAT (n = 23), WT (n = 23). Data are presented as means ± SEM. Boxplots show median value, box indicates 75 and 25th quartile and whiskers extend to the farthest value (largest and smallest). e Gene-wise mRNA‒protein correlations in NAT (left) and WT (right) samples (Spearman correlation). One-sided hyper-geometric test was performed to test the statistical significance of enrichment results by correlated mRNA-protein pairs in WT and NATs. Source data are provided as a Source Data file.
Fig. 2
Fig. 2. Identification of tumor-specific genes and pathways in WT.
a Venn diagram depicting the overlap of genes upregulated in WT (Wilms tumor) for RNAs, proteins, and phosphorylated proteins. b Venn diagram depicting the overlap of genes downregulated in WT for RNAs, proteins, and phosphorylated proteins. c Boxplot showing the Z-score normalized RNA (upper panel) and protein (lower panel) abundance of the indicated genes in WT (RNA: n = 62, protein: n = 88) and NAT (normal adjacent to tumor) (RNA: n = 37, protein: n = 71). A two-sided Wilcoxon rank sum test was performed to determine the difference. Boxplots show median value, box indicates 75 and 25th quartile and whiskers extend to the farthest value (largest and smallest). d The pathways enriched by the upregulated (left) and downregulated (right) RNAs/proteins/phospho-proteins in WT compared to NAT. Bold texts represent categories of enriched pathways. Each circle represents one pathway, and the pathways are connected if they shared 20% genes. The colors within the nodes represent the omics data. e Representative genes involved in the pathways enriched by the differentially expressed RNAs/proteins between WT and NAT. f The kinases with differential activities between WT and NAT inferred by differently phosphorylated sites. Source data are provided as a Source Data file.
Fig. 3
Fig. 3. The impacts of copy number alterations and mutations on mRNA and protein abundance in WT.
a The recurrently mutated genes in 36 WT (Wilms tumor) samples. Top: mutation counts of the top seven mutated genes in each patient. Mutation types and their frequencies are demonstrated by a bar plot in the right panel. b The expression patterns of genes involved in the Wnt/β-catenin pathway and stroma in normal adjacent to tumor (NAT), wild-type WT samples (Wild), and WT samples carrying Wnt/β-catenin pathway-related mutations (Mutation). c The difference in stromal scores between WT samples with and without Wnt/β-catenin pathway-related mutations. A two-sided Wilcoxon rank sum test was performed to determine the difference. Boxplots show median value, box indicates 75 and 25th quartile and whiskers extend to the farthest value (largest and smallest). Wild type (n = 26), CTNNB1/AMER mutation (n = 9). Data are presented as means ± SEM. d The frequently amplified and deleted genomic regions detected in the Xinhua-WT cohort by GISTIC2. e Genome-wide CNA-mRNA and CNA-protein correlations. Positive and negative correlations are indicated in red and green, respectively. Lower panel: the number of significant correlations. Blue bars stand for specific correlations with mRNA (left) or protein (right), and black bars stand for common correlation on both mRNA and protein levels. f Cis-regulatory CNAs aggregated at chromosomal cytobands. The statistical significance was determined by a two-sided hypergeometric test. g The amplified and deleted genes with potential cis-regulatory effects. Left panel: Gain of copy number located in 13q, 12q, 9q, 9p, 8p, 7p, 7q, 6q, and 1q. Right panel: Deletions located in 16q and 1p. The gray lines between genes represent correlations, and thicker lines indicate stronger correlations. Source data are provided as a Source Data file.
Fig. 4
Fig. 4. Proteomic and transcriptomic stratification of WT and corresponding molecular and pathway features.
a The subgroups identified by spectral clustering and their clinical relevance. Heatmap depicting the RNA and protein expression patterns of the representative genes in the three subgroups, Subgroup 1 (S1), Subgroup 2 (S2) and Subgroup 3 (S3). b Bar chart of the proportions of blastemal, stromal and epithelial components in S1 (n = 24), S2 (n = 13), and S3 (n = 22). A one-sided Chi-squared test was performed to test the difference. c Box plot of the stromal scores (left) and immune scores (right) in S1 (n = 24), S2 (n = 13) and S3 (n = 22). Data are presented as means ± SEM. Boxplots show median value, box indicates 75 and 25th quartile and whiskers extend to the farthest value (largest and smallest). A two-sided Wilcoxon rank sum test was performed to determine the difference between the subtypes. The false discovery rate adjustments were made for multiple comparisons. d Heatmap of alteration pathways in the proteomic subgroups at the RNA, protein and phospho-protein levels. e The mRNA and protein expression level of the signature genes of the alteration pathways highly expressed in S1 (left), S2 (middle), and S3 (right). f Classification of activated kinases in S1, S2 and S3. g Heatmap depicting the subgroup-specific phosphorylation sites and corresponding kinases. The labels on the right represent the phosphorylated sites. h Kaplan‒Meier plots of event-free survival (left) and overall survival (right) of WT subgroups in the TARGET cohort. The p-value was calculated by the log-rank test. i The proportions of tumors with stages I, II, III, IV, or V in subtypes S1, S2, and S3 in database GSE31403. A Chi-square test was performed to test the difference. Source data are provided as a Source Data file.
Fig. 5
Fig. 5. Kidney development-related features of WT and difference in molecular subgroups.
a The scores for 12 developmental phases of the kidney by the ssGSEA algorithm. The mean scores were calculated for each phase in normal tissue as well as in S1 (Subgroup 1), S2 (Subgroup 2), and S3 (Subgroup 3) WT tissues. A two-sided student t test was used to determine the difference between NAT (normal adjacent to tumor), S1, S2 and S3. b Expression of mesenchymal-epithelial transition signature genes in NAT, S1, S2 and S3 WT samples at the mRNA and protein levels. NS p > 0.05, * p < 0.05, ** p < 0.01, *** p < 0.001. A two-sided Wilcoxon rank sum test was performed to test the difference. c Normalized enrichment score (NES) of the kidney development phase-related gene sets in NATs, S1, S2 and S3. The normalized enrichment score was calculated using GSEA function from R clusterProfiler package. A two-sided Kolmogorov–Smirnov (K–S) test was performed to test the statistical significance. The false discovery rate adjustments were made for multiple comparisons. d Normalized enrichment score for TF target genes in WT samples. Bottom: highly expressed TFs in WT. The normalized enrichment score was calculated using GSEA function from R clusterProfiler package. A two-sided Kolmogorov–Smirnov (K–S) test was performed to test the statistical significance. The false discovery rate adjustments were made for multiple comparisons. Source data are provided as a Source Data file.
Fig. 6
Fig. 6. Immuno-features of WT on mRNA and protein levels.
a Ridge plot of the immune signature score of WT (Wilms tumor) from our cohort and the TARGET database and 3 adult kinds of kidney tumors from the TCGA database, TCGA-KICH (Kidney Chromophobe), TCGA-KIRC (Kidney Renal Clear Cell Carcinoma), and TCGA-KIRP (Kidney Renal Papillary Cell Carcinoma). b Correlation analysis between tumor mutation burden (TMB) and immune signature score. c Cell abundance of listed immune cells in S1, S2 and S3. Kruskal test was used to determine the difference between subgroups. d RNA (upper) and protein (lower) abundance of chemokines, interferons, interleukins and other cytokines in S1, S2 and S3. e RNA (left) and protein (right) abundance of immune checkpoint genes/proteins in S1, S2 and S3. A two-sided student’s t test was used to determine the difference between subgroups. NS p > 0.05, * p < 0.05, ** p < 0.01, *** p < 0.001. Source data are provided as a Source Data file.
Fig. 7
Fig. 7. Identification and validation of prognostic biomarkers and potential therapeutic targets.
a Potential drug targets with FDA-approved drugs (left) by multi-omics data analysis in the Xinhua-WT cohort and their hazard ratios (right), as well as 95% confidence intervals (CIs), of EFS and OS using the TARGET-WT cohort (n = 125). The forest plots show the 95% confidence interval of hazard ratio with median value, 97.5 and 2.5th quartiles. A two-sided log-rank test was performed to test the difference. b The pathways enriched by the potential drug targets. A one-sided hypergeometric test was used to determine the statistical significance. c Heatmap depicting the kinase activities and RNA/protein expression levels of CDK1 and CDK2, phosphorylation levels of RB1 (pS249 and pS37), and RNA and protein expression levels of E2F target genes. d Western blot of EHMT2 and GADPH expression in WT (Wilms tumor) and NAT (normal adjacent to tumor) samples. N: NATs (n = 18); T: Tumors (n = 18). Western blot was repeated three times independently with similar results. e Western blot of the expression of dimethylated H3K9 and H3 in SK-NEP-1 cells after EHMT2 knockdown. EHMT2 knockdown and Western blot was repeated three times independently with similar results. f mRNA expression of pre-rRNAs after EHMT2 knockdown in SK-NEP-1 cells. A two-sided student t test was performed to test the difference. Data are presented as means ± SEM. EHMT2: **** p  =  8.1E-05 (NC and siEHMT2-1), **** p  =  2.9E-05 (NC and siEHMT2-2). Pre-rRNA_1: * p  =  1.2E-02 (NC and siEHMT2-1), ** p  =  2.7E-03 (NC and siEHMT2-2). Pre-rRNA_2: ** p  =  6.9E-03 (NC and siEHMT2-1), ** p  =  2.9E-03 (NC and siEHMT2-2). The false discovery rate adjustments were made for multiple comparisons. Each group has three biological replicates. g Pathway enrichment results of downregulated and upregulated genes after EHMT2 knockdown. h Heatmap of the RNA abundance of differentially expressed genes related to genes controlling nephrogenesis, the cell cycle and the Wnt signaling pathway. i. Western blot of the expression of dimethylated H3K9 and H3 in SK-NEP-1 cells after treatment with the EHMT2 inhibitor at the indicated concentrations. Inhibitor treatment and Western blot was repeated three times independently with similar results. Source data are provided as a Source Data file.

References

    1. Breslow, N., Olshan, A., Beckwith, J. B. & Green, D. M. Epidemiology of Wilms tumor. Med. Pediatr. Oncol.21, 172–181 (1993). - PubMed
    1. Nakata, K. et al. Incidence of childhood renal tumours: an international population-based study. Int J. Cancer147, 3313–3327 (2020). - PMC - PubMed
    1. Ni, X. et al. Socioeconomic inequalities in cancer incidence and access to health services among children and adolescents in China: a cross-sectional study. Lancet400, 1020–1032 (2022). - PubMed
    1. Wilms Tumor and Other Childhood Kidney Tumors Treatment (PDQ(R)): health Professional Version. In: PDQ Cancer Information Summaries) (PDQ, 2002). - PubMed
    1. Ooms, A. H. A. G. et al. Significance of TP53 mutation in wilms tumors with diffuse anaplasia: a report from the Children’s Oncology Group. Clin. Cancer Res.22, 5582–5591 (2016). - PMC - PubMed

MeSH terms

LinkOut - more resources