. 2025 Aug 19;16(1):7721.
doi: 10.1038/s41467-025-63085-y.

O-GlcNAc transferase plays dual antiviral roles by integrating innate immunity and lipid metabolism

Affiliations

O-GlcNAc transferase plays dual antiviral roles by integrating innate immunity and lipid metabolism

Hong Dong et al. Nat Commun. .

Abstract

Viral infection induces robust reprogramming of metabolic pathways in host cells. However, whether host metabolic enzymes detect viral components remains unknown. Our group and others previously identified O-GlcNAc transferase (OGT), an important glucose metabolic enzyme, as a crucial mediator of the antiviral immune responses. Here, by studying a mouse model with a catalytically impaired OGT, we discover a catalytic activity-independent function of OGT in restraining influenza A virus (IAV) infection in addition to its catalytic activity-dependent effect on MAVS-mediated antiviral immunity. Biochemical studies reveal a critical antiviral effect based on OGT interacting with IAV genomic RNA that requires its N-terminal tetracopeptide repeat-4 motif. This interaction causes the translocation of nuclear OGT to cytosolic lipid droplets (LDs) to destabilize LDs-coating perilipin 2, thereby limiting LDs accumulation and in turn virus replication. In sum, our findings reveal OGT as a multifaceted metabolic sensor that integrates MAVS signaling and lipid metabolism to combat viral infection.


Conflict of interest statement

Competing interests: The authors declare no competing interests.

Figures

Fig. 1
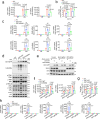
Fig. 1. OGT inhibits IAV infection via both catalytic activity-dependent and -independent manner.
ag Mouse embryonic fibroblasts (MEFs) generated from Ogtfl/fl, Ogt-K908Afl/fl, Ogt KO and OgtK908A mice were infected with PR8 or PR8-GFP virus at a multiplicity of infection (MOI) = 1 for 12 h. Viral mRNAs (a), viral titers (b), expression of IAV HA and NA proteins (c), and virus infected cells (d) were measured by RT-PCR, TCID50 assays, immunoblotting with corresponding antibodies and flow cytometry respectively. e Gene transcripts including Ifna4, Ifnb1, Mx1, Isg15, Cxcl10, Il6, and Tnfa in the cells were measured with RT-PCR. f Immunoblotting of phosphorylated TBK1, IRF3, NF-κB signaling molecules and protein O-GlcNAcylation was performed with indicated antibodies. g Immunoprecipitated MAVS from the MEFs was assessed for O-GlcNAcylation with anti-O-GlcNAc antibody. Data are representative of three independent experiments (a, b and d, e). Statistical significance was determined by two-way ANOVA followed by Tukey’s test (a, b and d, e), P values of statistical comparisons are shown in each graph. The error bars represent SEM from n = 3 independent biological replicates (a, b and d, e). Source data are provided as a Source Data file.
Fig. 2
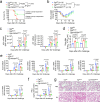
Fig. 2. OGT inhibits IAV infection via both catalytic activity-dependent and -independent manner in human cells.
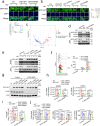
ad OGT-KO HT29 cells were reconstituted with empty vector (EV), GFP-tagged OGT (OGT-WT) or its K908A mutants, followed by the infection with PR8 virus at a MOI = 1 for 12 h. Viral mRNAs (a), and viral titers (b) were measured by RT-PCR, and TCID50 assays respectively. c Gene transcripts including IFNA4, IFNB, MX1, ISG15, IL6, and TNFA in the cells were measured with RT-PCR. d Immunoblotting of phosphorylated TBK1, IRF3, IKKα/β, IκBα, and NF-κB signaling molecules and protein O-GlcNAcylation was performed with indicated antibodies. eh, MAVS-KO or IRF3-KO and WT control of HT29 EV, OGT-WT and OGT-K908A cells were infected with PR8 virus at a MOI = 1 for 12 h. e The expression of MAVS and IRF3 proteins in cells were assessed by immunoblotting. Viral mRNAs (f), and viral titers (g) were measured by RT-PCR and TCID50 assays respectively. h Gene transcripts including IFNB, MX1, ISG15, IL6, and TNFA in the cells were measured with RT-PCR. Data are representative of three independent experiments (ac and fh). Statistical significance was determined by two-way ANOVA followed by Tukey’s test (ac and fh), P values of statistical comparisons are shown in each graph. The error bars represent SEM from n = 3 independent biological replicates (ac and fh). Source data are provided as a Source Data file.
Fig. 3
Fig. 3. Catalytic activity-dependent and -independent antiviral function of OGT in vivo.
ag Ogtfl/fl, OgtΔLEC and Ogt-K908AΔLEC mice were infected with 10 TCID50 of PR8 virus. Survival (a) and changes in body weight (b) of mice were monitored every 2 days. Ogtfl/fl mice (n = 18), OgtΔLEC mice (n = 17) and Ogt-K908AΔLEC mice (n = 18). Viral mRNAs (c), and viral titers (d) in the lung were measured by RT-PCR and TCID50 assays respectively. e Gene transcripts including Ifna4, Ifnb1, Mx1, Isg15 and Cxcl10 in the lung were measured with RT-PCR. f IFN-β protein in the lung was measured with ELISA. g Histological analysis of the lung tissue collected from animals at day 2 after viral infection. Scale bars, 20 μm. Data are representative of three independent experiments (af). Statistical significance was determined by log-rank (Mantel-Cox) test survival analysis (a) or two-way ANOVA followed by Tukey’s test (bf), P values of statistical comparisons are shown in each graph. The error bars represent SEM from n = 3 independent experiments (af), each dot represents the means of each of the three experiments (cf). Source data are provided as a Source Data file.
Fig. 4
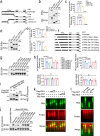
Fig. 4. OGT interacts with IAV genomic RNA.
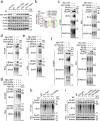
ah, 293T cells were transfected with indicated vectors. At 12 h after transfection, cells were infected with PR8 virus at MOI = 1 and cell lysates were harvested at 48 h after transfection and immunoprecipitated with anti-Myc Agarose. a Schematic diagram of full-length OGT and its truncated mutants. N-ter, N-terminal; C-ter, C-terminal; TPR, tetratricopeptide repeats motif; b, d Immunoblotting of full-length OGT and its truncated mutants in immunoprecipitation assay. c, e Viral PA and PB2 genomic RNAs in immunoprecipitation assay were quantified by RT-PCR. f Schematic diagram of full-length OGT and its TPR motif deletion mutants. g Immunoblotting of full-length OGT and its TPR motif deletion mutants in immunoprecipitation assay. h Viral PA, PB2 genomic RNAs and human housekeeping gene transcripts in immunoprecipitation assay were quantified by RT-PCR. i, j 293T cells were transfected with indicated vectors for 36 h, cell lysates were incubated with biotin-labeled viral PB2 genomic RNA and immunoprecipitated with streptavidin beads. Immunoblotting of Flag-RIG-I (Positive control) and OGT (i) or OGT and its mutants (j) in immunoprecipitation assay. k, l Electrophoretic mobility shift assay (EMSA) of in vitro transcribed viral PB2 genomic RNA in the presence of purified Flag-RIG-I (Positive control), Flag-OGT or its mutants. Mobility of viral PB2 genomic RNA (600 ng) in the presence of purified Flag-RIG-I (1, 2, and 4 μg) and Flag-OGT (1, 3, and 6 μg) (k) or in the presence of purified Flag-OGT and its mutants (4 μg for each sample) (l). Data are representative of three independent experiments (c, e, h). Statistical significance was determined by one-way ANOVA followed by Tukey’s test (c, e, h), P values of statistical comparisons are shown in each graph. The error bars represent SEM from n = 3 independent biological replicates (c, e, h). Source data are provided as a Source Data file.
Fig. 5
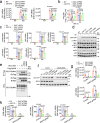
Fig. 5. OGT interaction with IAV genomic RNA inhibits viral replication independently of MAVS.
ad OGT-KO HT29 cells were reconstituted with empty vector (EV), GFP-tagged OGT (OGT FL) or its indicated mutants, followed by the infection with PR8 virus at a MOI = 1 for 12 h. Viral mRNAs (a) and viral titers (b) were measured by RT-PCR and TCID50 assays, respectively. c Gene transcripts including IFNB, MX1, ISG15, IL6, and TNFA in the cells were measured with RT-PCR. d Immunoblotting of phosphorylated TBK1, IRF3, NF-κB signaling molecules was performed with indicated antibodies. e 293T cells were transfected with indicated vectors. After 48 h of transfection, cell lysates were harvested and immunoprecipitated with anti-Flag Agarose. Immunoprecipitated Flag-MAVS was assessed for O-GlcNAcylation with anti-O-GlcNAc antibody by immunoblotting. fhMAVS-KO and WT control of HT29 EV, OGT-FL and its indicated mutant cells were infected with PR8 virus at a MOI = 1 for 12 h. f MAVS protein expression in cells was assessed by immunoblotting. Viral mRNAs (g), and gene transcripts including IFNB, MX1, and ISG15 in the cells (h) were measured with RT-PCR. Data are representative of three independent experiments (ac and g, h). Statistical significance was determined by two-way ANOVA followed by Tukey’s test (ac and g, h), P values of statistical comparisons are shown in each graph. The error bars represent SEM from n = 3 independent biological replicates (ac and g, h). Source data are provided as a Source Data file.
Fig. 6
Fig. 6. OGT counteracts lipid droplets accumulation upon IAV infection.
a, b OGT-KO HT29 cells were reconstituted with empty vector (EV), GFP-tagged OGT (OGT-WT) or its indicated mutants, followed by the infection with PR8 virus at a MOI = 1 for 12 h. Representative confocal microscopy images and quantification of subcellular localizations of OGT-WT and its K908A mutant in cells (a), n = 50 cells in EV group, n = 49 cells in OGT-WT group, n = 46 cells in OGT-K908A group. Scale bar: 15 μm. Representative confocal microscopy images and quantification of subcellular localizations of OGT-WT and its indicated mutants in cells (b), n = 50 cells in EV group, n = 43 cells in OGT-WT group, n = 47 cells in OGT ΔTPR4 group, n = 46 cells in OGT ΔTPR5 group, n = 50 cells in OGT-K908A group. Scale bar, 15 μm. c Volcano Plot of differential protein level analysis and subcellular localization of the OGT interactome from raw MS assay count data comparing the OGT and OGT PR8 infection groups. Red: upregulated protein (log2 Fold Change > 1 and adjust p < 0.01; Gray: protein with no significant change (−1 < log2 Fold Change < 1 or adjust p > 0.01); Blue: downregulated protein (log2 Fold Change < -1 and adjust p < 0.01). Circle: nuclear protein; Triangle: non- nuclear protein. df OGT-WT or its indicated mutants HT29 cells were infected with PR8 virus at a MOI = 1 for 12 h. OGT-WT and its K908A mutant (d) or OGT-WT and its indicated mutants (e)-interacting proteins were assessed by immunoprecipitation assay and immunoblotting with indicated antibodies. f Lipid droplets levels in OGT-WT and its mutant cells were stained with LipidTOX Deep Red and assessed by flow cytometry. gj PLIN2-KO and WT control of HT29 EV, OGT-FL and its indicated mutant cells were infected with PR8 virus at a MOI = 1 for 12 h. g PLIN2 protein expression in cells was assessed by immunoblotting. Viral mRNAs (h), viral titers (i), and gene transcripts including IFNB, MX1, and ISG15 in the cells (j) were measured with RT-PCR and TCID50 assays, respectively. Data are representative of three independent experiments (a, b, f and hj). Statistical significance was determined by two-way ANOVA followed by Tukey’s test (a, b, f and hj), P values of statistical comparisons are shown in each graph. The error bars represent SEM from n = 50 cells in EV group, n = 49 cells in OGT-WT group, n = 46 cells in OGT-K908A group in (a), n = 50 cells in EV group, n = 43 cells in OGT-WT group, n = 47 cells in OGT ΔTPR4 group, n = 46 cells in OGT ΔTPR5 group, n = 50 cells in OGT-K908A group in (b), and n = 3 independent biological replicates (f, hj). Statistical significance was calculated using two-sided Wald test and adjusted with Benjamini and Hochberg method (c). Source data are provided as a Source Data file.
Fig. 7
Fig. 7. OGT promotes PLIN2 degradation via K48-linked ubiquitination.
a, b OGT-KO HT29 cells were reconstituted with empty vector (EV), GFP-tagged OGT (OGT-WT) or its indicated mutants, followed by the infection with PR8 virus at a MOI = 1 for 12 h. PLIN2-5 proteins expression (a) and PLIN2 mRNA (b) in cells were assessed by immunoblotting and RT-PCR respectively. ce 293T cells were transfected with GFP-tagged PLIN2 and Myc-tagged OGT, in the presence of HA-tagged ubiquitin WT, K48-only, or K63-only mutants. After 48 h of transfection, cell lysates were immunoprecipitated with anti-GFP Agarose. Total (c), K48-only (d) or K63-only (e) ubiquitinated PLIN2 was assessed by immunoblotting with indicated antibodies. f, g 293T cells were transfected with GFP-tagged PLIN2 and Myc-tagged OGT, in the presence of HA-tagged ubiquitin WT and K48-only. After 30 h of transfection, cells were treated with MG132 (10 μΜ) for 6 h, and then the cell lysates were immunoprecipitated with anti-GFP Agarose. Total (f) and K48-only (g) ubiquitinated PLIN2 was assessed by immunoblotting with indicated antibodies. OGT-WT and its K908A mutant (h) or OGT-WT and its indicated mutants (i) HT29 cells were infected with PR8 virus at a MOI = 1 for 24 h, total PLIN2 was immunoprecipitated and followed by immunoblotting with anti-ubiquitin antibody. Data are representative of three independent experiments (b). Statistical significance was determined by two-way ANOVA followed by Tukey’s test (b), P values of statistical comparisons are shown in each graph. The error bars represent SEM from n = 3 independent biological replicates (b). Source data are provided as a Source Data file.

References

    1. Ablasser, A. & Hur, S. Regulation of cGAS- and RLR-mediated immunity to nucleic acids. Nat. Immunol.21, 17–29 (2020). - PubMed
    1. Brubaker, S. W., Bonham, K. S., Zanoni, I. & Kagan, J. C. Innate immune pattern recognition: a cell biological perspective. Annu. Rev. Immunol.33, 257–290 (2015). - PMC - PubMed
    1. Rehwinkel, J. & Gack, M. U. RIG-I-like receptors: their regulation and roles in RNA sensing. Nat. Rev. Immunol.20, 537–551 (2020). - PMC - PubMed
    1. Seth, R. B., Sun, L., Ea, C. K. & Chen, Z. J. Identification and characterization of MAVS, a mitochondrial antiviral signaling protein that activates NF-kappaB and IRF 3. Cell122, 669–682 (2005). - PubMed
    1. Kenney, A. D. et al. Human genetic determinants of viral diseases. Annu. Rev. Genet.51, 241–263 (2017). - PMC - PubMed

MeSH terms