. 2025 Aug 20;16(1):7740.
doi: 10.1038/s41467-025-62714-w.

Molecular mechanisms of thiazide-like diuretics-mediated inhibition of the human Na-Cl cotransporter

Affiliations

Molecular mechanisms of thiazide-like diuretics-mediated inhibition of the human Na-Cl cotransporter

Chien-Ling Lee et al. Nat Commun. .

Abstract

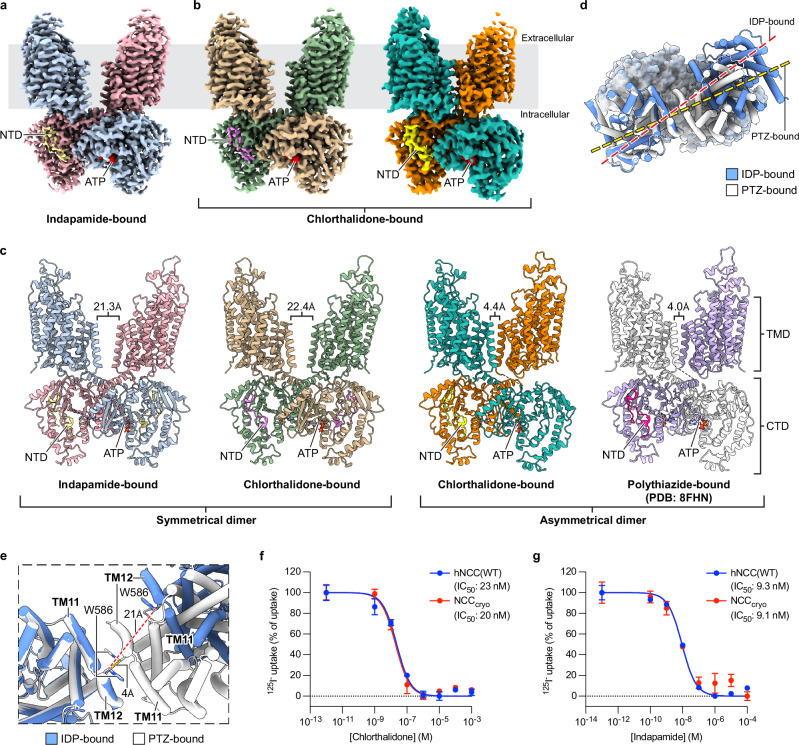
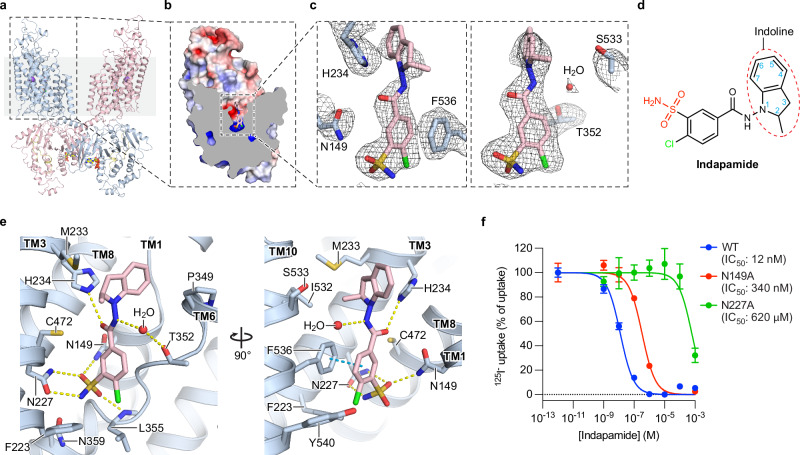
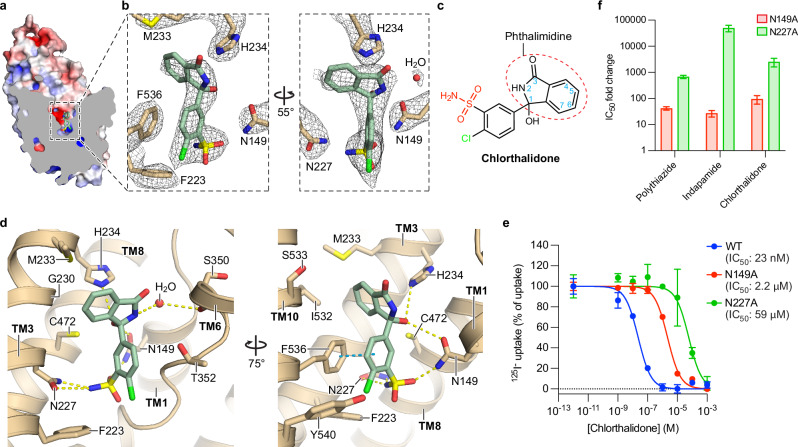
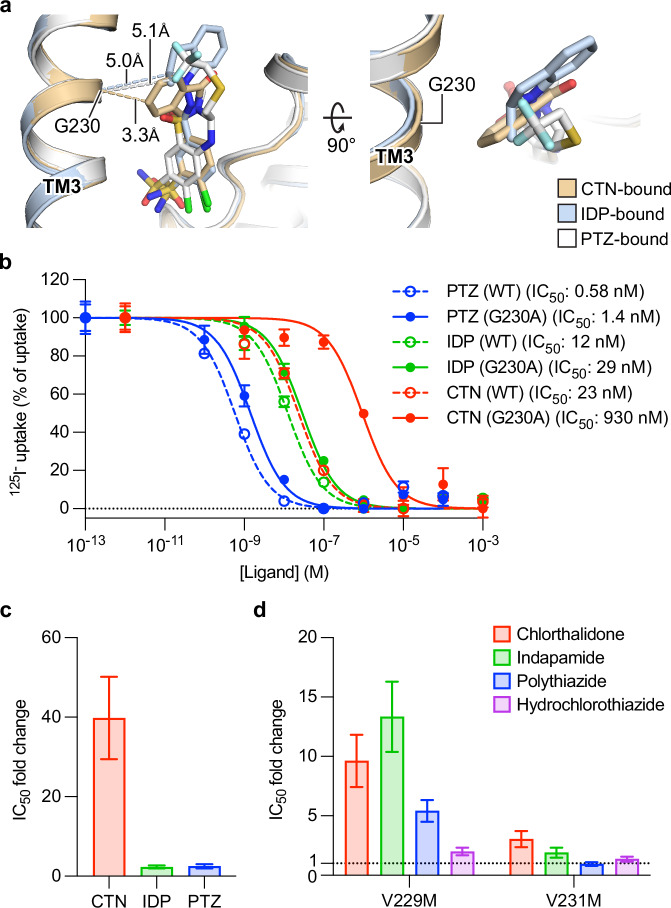
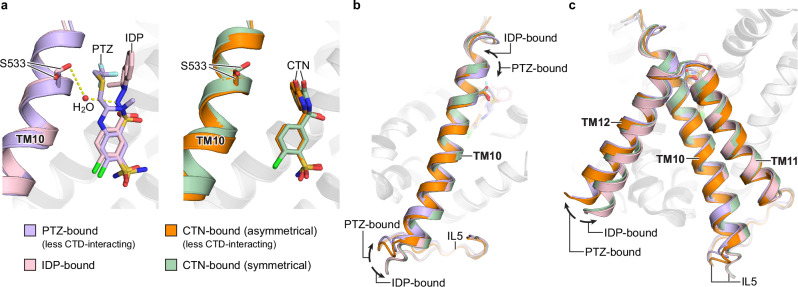
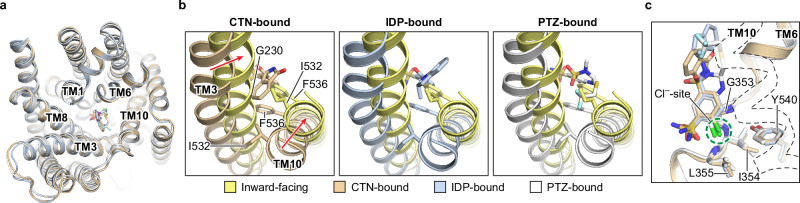
Thiazide-type and thiazide-like diuretics are structurally distinct first-line antihypertensive drugs that target the sodium-chloride cotransporter (NCC) in the kidney. Thiazide-like diuretics are reported to have better cardioprotective effects than thiazide-type diuretics, but whether this is due to differences in NCC-inhibition mechanisms, if there is any, remains unclear. To understand the molecular mechanisms of NCC inhibition by thiazide-like diuretics, we determine the structures of human NCC (hNCC) bound to two of the most widely used thiazide-like diuretics, chlorthalidone and indapamide, using cryogenic electron microscopy (cryo-EM). Structural analyses reveal shared features and distinctions between NCC-inhibition by thiazide-like and thiazide-type diuretics. Furthermore, structural comparisons allow us to identify polymorphisms in hNCC that have substantial differential effects on the potencies of specific thiazide-like and thiazide-type diuretics. Our work provides important insights into the molecular pharmacology of NCC and a blueprint for developing precision medicine to manage hypertension with thiazide-like and thiazide-type diuretics.


Conflict of interest statement

Competing interests: The authors declare no competing interests.

Figures

Fig. 1
Fig. 1. Overall architecture of indapamide-bound and chlorthalidone-bound hNCC.
a, b Cryo-EM density maps of indapamide (IDP)- and chlorthalidone (CTN)-bound NCCcryo. The IDP-bound and symmetrical and asymmetrical CTN-bound maps are contoured at 4.3 σ, 5.1 σ, and 4.3 σ, respectively. The two protomers and NTD of the IDP-bound structure are colored light blue, pink, and pale yellow, respectively. The two protomers and NTD of the symmetrical CTN-bound structure are colored tan, green, and violet, respectively. The non-NTD-bound and NTD-bound protomers and NTD of the asymmetrical CTN-bound structure are colored teal, orange, and yellow, respectively. All ATP/ADP densities are colored red. c Ribbon representations of the structures of IDP-, CTN-, and polythiazide (PTZ)-bound hNCC. The color schemes of IDP- and CTN-bound structures are the same as in (a). The NTD-bound and non-NTD-bound protomers and NTD of the PTZ-bound structure are colored light purple, white, and deep pink, respectively. Bound ATP/ADP molecules are shown as color-matched sticks. The distances between TMD subunits (the distance between the Cβ of W586 pair) are labeled. d, e Ligand-specific hNCC dimer configurations. The IDP- and PTZ-bound structures are colored blue and white, respectively. The TMD and CTD are shown as cylinder and surface representations, respectively, and the cap domains are not shown for clarity. The structural alignment is based on TMD subunits forming extensive TMD-CTD interactions. In e the distances between the two TMD subunits are outlined with red and yellow dashed lines for IDP-bound and PTZ-bound hNCC structures, respectively. f, g NCCcryo sensitivity to chlorthalidone and indapamide. Data are shown as mean ± SEM (n = 3 independent experiments). The baseline of the thiazide-sensitive iodide uptake is marked by a dotted line.
Fig. 2
Fig. 2. Indapamide-binding site.
a Ribbon representation of indapamide (IDP)-bound NCCcryo. The two protomers and NTD are colored light blue, pink, and pale yellow, respectively. The bound indapamide and ATP molecules are displayed as sticks, colored light blue/pink and yellow, respectively. The bound Na+ ions are shown as purple spheres. b Sliced view of one TMD subunit of IDP-bound NCCcryo. The protein surface representation is colored by electrostatic potential, in range of red (−5 kT e−1) to blue (+5 kT e−1), and the bound indapamide molecule is shown as sticks. c Densities of indapamide and nearby residues. Indapamide and nearby selected residues are shown as pink and light blue sticks, respectively, and the densities are shown as meshes. The contour levels of the left and right panels are 9.5 σ and 6.5 σ, respectively. d Chemical structure of indapamide. The sulfamoyl and chlorine groups are colored red and green, respectively. The indoline moiety is outlined with a red dashed oval, and the numbering system of the indoline moiety is shown as blue numbers. e Indapamide-hNCC interactions. Hydrogen bonds are shown as dashed lines in yellow, and π–π stacking interactions in cyan. The color scheme is the same as in (c). f Effects of alanine substitutions of key IDP-interacting residues on hNCC sensitivity to indapamide. Data are shown as mean ± SEM (n = 3 independent experiments).
Fig. 3
Fig. 3. Chlorthalidone-binding site.
a Sliced view of one TMD subunit of chlorthalidone (CTN)-bound NCCcryo. The surface representation of the protein is colored by electrostatic potential, in range of red (−5 kT  e−1) to blue (+5 kT e−1). The bound chlorthalidone molecule is shown as sticks. b Densities of chlorthalidone and nearby residues. hNCC and chlorthalidone are colored in tan and green, respectively. The contour levels of the left and right panels are 9.5 σ and 7.5 σ, respectively. c Chemical structure of chlorthalidone. The sulfamoyl and chlorine groups are colored red and green, respectively. The phthalimidine moiety is outlined with a red dashed oval, with the numbering system shown as blue numbers. d Chlorthalidone-NCC interactions. Hydrogen bonds are shown as dashed lines in yellow, and π–π stacking interactions in cyan. The color scheme is the same as in (b). e Effects of alanine substitutions of key CTN-interacting residues on hNCC sensitivity to chlorthalidone. Data are shown as mean ± SEM (n = 3 independent experiments). Data for WT are the same as in Fig. 1f. f Differential effects of N149A and N227A substitutions on hNCC sensitivities to several thiazide diuretics. The bar heights are best-fit values of IC50 fold change relative to hNCC(WT) calculated from Figs. 2f (indapamide) and 3e (chlorthalidone) using the EC50 shift analysis in GraphPad Prism 10. For polythiazide, best-fit values were calculated from sensitivities reported in ref. . The error bar depicts the standard error reported by GraphPad Prism 10, which serves as an indicator of the confidence of calculated IC50 fold change.
Fig. 4
Fig. 4. Ligand-specific interactions with hNCC.
a Interactions between G230 and several thiazide diuretics. The CTN-, IDP-, and PTZ-bound structures are colored tan, light blue, and white, respectively. The three structures are aligned based on TM3. The closest distances between the Cα of G230 and the three molecules are outlines with color matched dashed lines. b Dose-response curves of several thiazide diuretics against hNCC(WT) or hNCC(G230A). Curves for hNCC(WT) and hNCC(G230A) are shown as dashed and solid lines, respectively. Curves for chlorthalidone, indapamide, and polythiazide are colored red, green, and blue, respectively. Data are shown as mean ± SEM (n = 3 independent experiments). Data for IDP(WT) and CTN(WT) are the same as in Figs. 2f and 1f, respectively. c Differential effects of G230A substitution on hNCC sensitivities to several thiazide diuretics. The bar heights stand for best-fit values of IC50 fold change relative to hNCC(WT) calculated from Fig. 4b using the EC50 shift analysis in GraphPad Prism 10. d Differential effects of V229M and V231M polymorphisms on hNCC sensitivities to different thiazide diuretics. The bar heights are best-fit values of IC50 fold change relative to hNCC(WT) calculated from Supplementary Fig. 9g (V229M) and 9 h (V231M) using the EC50 shift analysis in GraphPad Prism 10. The level of IC50 fold change equal to 1 is outlined with a dashed line. In c, d the error bar represents the standard error, which serves as an indicator of the confidence of IC50 fold change calculation by GraphPad Prism 10.
Fig. 5
Fig. 5. Ligand-specific conformational changes.
a Ligand-specific interactions with S533. The PTZ-bound (less CTD-interacting), IDP-bound, asymmetrical CTN-bound (less CTD-interacting), and symmetrical CTN-bound NCC structures are colored purple, pink, orange, and green, respectively. Polar interactions are shown as yellow dashed lines. b, c Ligand-specific conformational changes of TM10-12. The less CTD-interacting TMD subunits of PTZ-bound and asymmetrical CTN-bound structures are aligned to the TMD subunits of IDP-bound and symmetrical CTN-bound structures. The color scheme is the same as in (a). TM11 and TM12 are not shown in b for clarity.
Fig. 6
Fig. 6. NCC inhibition mechanisms of different thiazide diuretics.
a Superposition of the TMDs of CTN-, IDP-, and PTZ-bound NCC structures, which are colored tan, light blue, and white, respectively. The color scheme is the same in (b, c). The bound ligands are shown as color matched sticks. For clarity, the cap domains are not shown. b Structural comparisons of TM3 and TM10 in the inward-facing (yellow) and outward-facing (CTN-, IDP-, or PTZ-bound) NCC. Movements of individual helices during outward-facing to inward-facing conformational switches are indicated with red arrows. c Relationships between NCC’s Cl-binding site and the chlorine groups of bound chlorthalidone, indapamide, and polythiazide molecules. The Cl-binding site is outlined with a green dashed circle, and Cl-coordinating residues are shown as sticks. TM10 is shown as a dashed outline for clarity.

Similar articles

References

    1. World Health Organization. Global report on hypertension: The race against a silent killer (World Health Organization, 2023).
    1. N. C. D. Risk Factor Collaboration Worldwide trends in hypertension prevalence and progress in treatment and control from 1990 to 2019: a pooled analysis of 1201 population-representative studies with 104 million participants. Lancet398, 957–980 (2021). - PMC - PubMed
    1. Messerli, F. H., Williams, B. & Ritz, E. Essential hypertension. Lancet370, 591–603 (2007). - PubMed
    1. Oparil, S. et al. Hypertension. Nat. Rev. Dis. Prim.4, 18014 (2018). - PMC - PubMed
    1. G. B. D. Diseases and Injuries Collaborators Global burden of 369 diseases and injuries in 204 countries and territories, 1990-2019: a systematic analysis for the Global Burden of Disease Study 2019. Lancet396, 1204–1222 (2020). - PMC - PubMed

MeSH terms

LinkOut - more resources