

Comparative analysis of the mitogenomes of multiple species of Fagaceae, with special focus on Quercus gilva
- PMID: 40830429
- PMCID: PMC12363117
- DOI: 10.1186/s12870-025-07072-x
Comparative analysis of the mitogenomes of multiple species of Fagaceae, with special focus on Quercus gilva
Abstract
Background: Quercus, as the most abundant and widely distributed genus within the family Fagaceae, has been extensively studied at nuclear genome and plastome. However, mitogenome studies in Quercus remain scarce. In this study, we assemble and annotate the mitogenome of Quercus gilva based on Illumina and Nanopore data. Additionally, we explore the structural features of its mitogenome and provide comprehensive analyses of the phylogeny and evolution of Fagaceae.
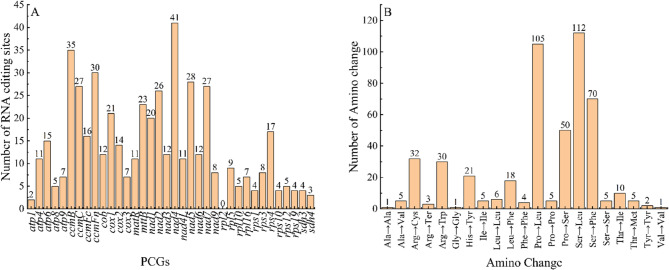
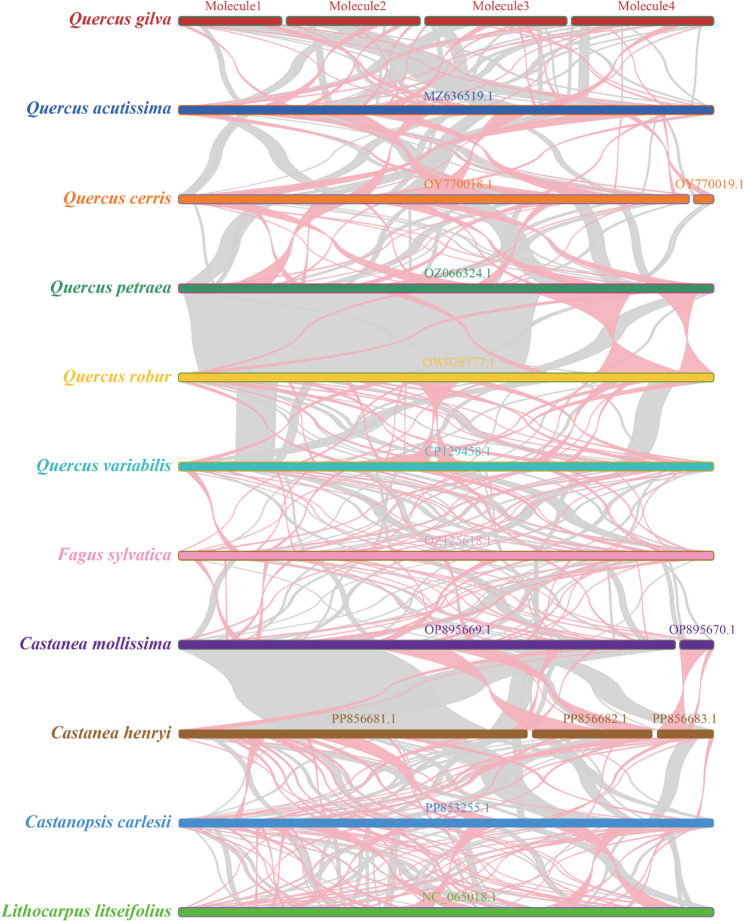
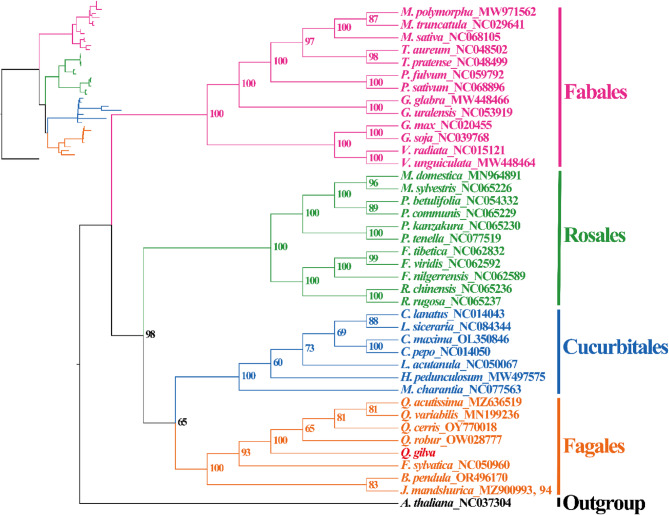
Results: The Q. gilva mitogenome consists of four molecules (three circular molecules and one linear molecule) with 490,015 bp in total length and 45.68% in guanine-cytosine (GC) content. The mitogenome encodes 59 genes, including 37 protein-coding genes (PCGs), 19 transfer RNA genes (tRNAs), and three ribosomal RNA genes (rRNAs). We also examine the repeat sequences, codon usage bias, RNA editing sites, and endosymbiotic gene transfer in the mitogenome. The wide distribution of repeat sequences is a key factor in mitogenome rearrangement. These is widespread gene transfer among the mitogenome, plastome, and nuclear genome of Q. gilva. Comparative genomic analyses of the 11 Fagaceae mitogenomes reveal significant structural variations in size and gene loss. Synteny analysis further indicates extensive genome rearrangements and inversions within the 11 mitogenomes. However, analyses of nucleotide diversity (Pi) and nonsynonymous and synonymous substitution ratio (Ka/Ks) values reveal a low rate of evolution in the mitogenomes of Fagaceae. Finally, phylogenetic analysis based on 12 conserved mitochondrial PCGs of 40 taxa strongly supports the classification of Fabids.
Conclusions: In this study, the mitogenome of Q. gilva is newly assembled, providing important genomic resources for the phylogeny, resource conservation and development of Quercus. At the same time, the study of structural variation among the mitogenomes of Fagaceae species also help to elucidate the formation mechanism of mitogenome structural diversity.
Keywords: Quercus; Endosymbiotic gene transfer; Mitogenome; RNA editing site.
© 2025. The Author(s).
Conflict of interest statement
Declarations. Ethics approval and consent to participate: The collection and usage of plant specimens in current study complied with the IUCN Policy Statement on Research Involving Species at Risk of Extinction and the Convention on the Trade in Endangered Species of Wild Fauna and Flora. Ethical approval was not applicable for this study. Consent for publication: Not applicable. Competing interests: The authors declare no competing interests.
Figures


References
-
- Drouin G, Daoud H, Xia JN. Relative rates of synonymous substitutions in the mitochondrial, chloroplast and nuclear genomes of seed plants. Mol Phylogenet Evol. 2008;49(3):827–31. - PubMed
-
- Muse SV. Examining rates and patterns of nucleotide substitution in plants. Plant Mol Biol. 2000;42(1):25–43. - PubMed
-
- Hu HY, Sun PC, Yang YZ, Ma JX, Liu JQ. Genome-scale angiosperm phylogenies based on nuclear, plastome, and mitochondrial datasets. J Integr Plant Biol. 2023;65(6):1479–89. - PubMed
Publication types
MeSH terms
Substances
Grants and funding
LinkOut - more resources
Full Text Sources
Research Materials
Miscellaneous
