

ZEB1 stratifies the response to Sorafenib and Mdivi-1 combination therapy in hepatocellular carcinoma
- PMID: 40830586
- PMCID: PMC12365315
- DOI: 10.1038/s41598-025-16379-6
ZEB1 stratifies the response to Sorafenib and Mdivi-1 combination therapy in hepatocellular carcinoma
Abstract
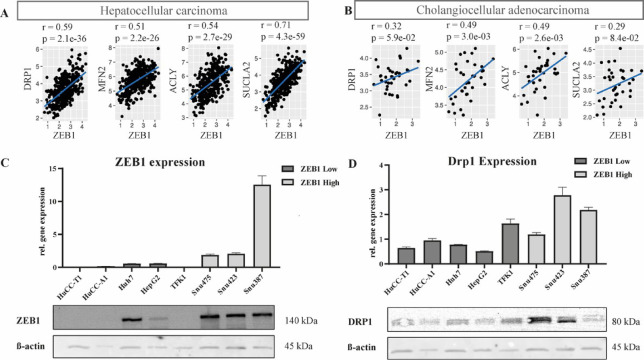
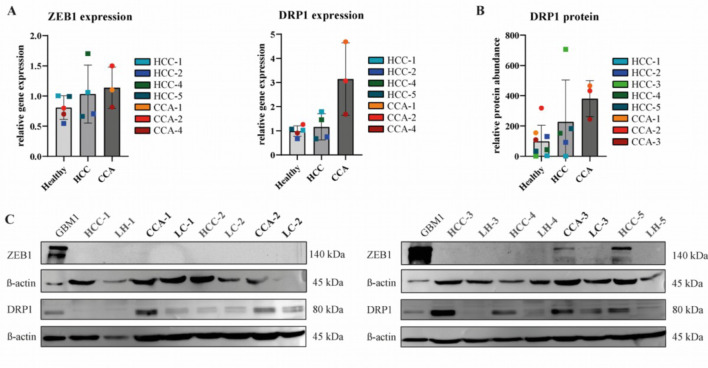
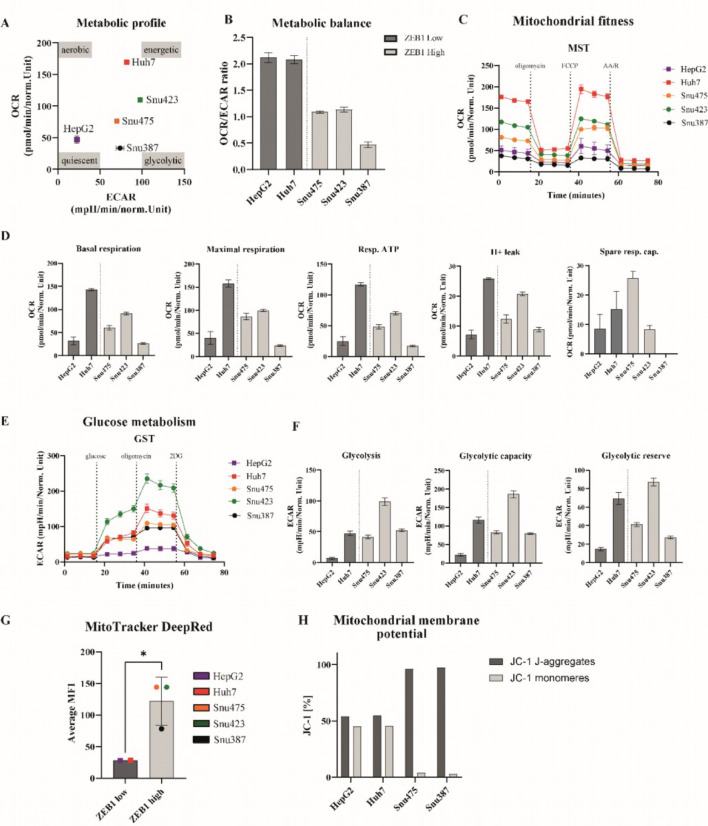
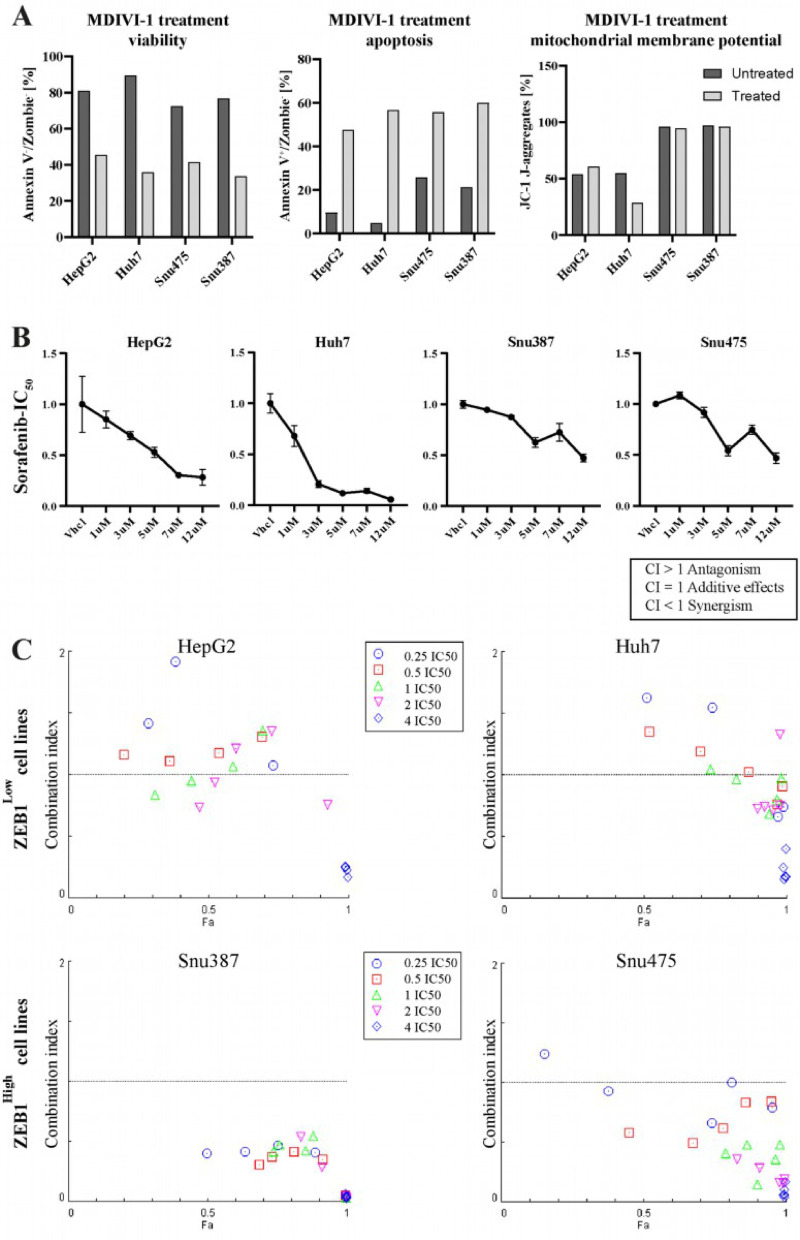
Primary liver cancer is one of the most frequently diagnosed and deadliest cancers. Zinc finger E-box binding homeobox 1 (ZEB1) is negative prognostic factor in liver cancer by promoting therapy resistance and tumorigenesis. Interfering in pathways of cellular metabolism emerges as a potent strategy to overcome tumor cells resistance to therapy. Our study aims to investigate the apoptotic potential of pharmacological inhibition of mitochondrial metabolism in primary liver cancer and whether this strategy can reduce ZEB1-associated resistance to standard of care chemotherapy Sorafenib. ZEB1 mRNA levels in patient samples and cancer cell lines were computationally screened using public datasets. Transcript and protein abundance of ZEB1 and regulators of mitochondrial fission and fusion were quantified in patient-matched tumor and non-tumor tissues of hepatocellular carcinoma (HCC) and cholangiocellular adenocarcinoma (CCA) from our clinic and common liver cancer cell lines. Functional assays on cell models with varying ZEB1 expression exposed to mitochondrial division inhibitor Mdivi-1 included mitochondrial mass quantification, mitochondrial membrane potential examination, apoptosis, extracellular flux, and cell growth analyses. Mdivi-1 treatment in human-physiological achievable concentration effectively induced apoptosis in all tested cell models. ZEB1 expression was heightened in younger patients, and dynamin-related protein 1 (Drp1) protein abundance was elevated in a subgroup of tumor tissue compared to healthy tissue. Cancer cell lines with high ZEB1 expression showed increased mitochondrial fission marker Drp1 and larger total mitochondrial mass, preserved membrane potential with reduced mitochondrial ATP production and respiration, resulting in an overall reduced mitochondrial fitness. Pharmacological inhibition of mitochondrial fission using Mdivi-1 reduced HCC resistance to Sorafenib in ZEB1-driven liver cancer. A subset of HCC cell lines with elevated ZEB1 levels exhibit increased mitochondrial mass and reduced metabolic activity. Targeting mitochondrial division in HCC by treatment with Mdivi-1 in combination with Sorafenib demonstrates a synergistic therapeutic effect in hepatocellular carcinoma (HCC) cell lines characterized by high ZEB1 expression. Further in vivo validation is needed to confirm these findings and evaluate this potential combined treatment option.
Keywords: EMT; Hepatocellular carcinoma; Mdivi-1; Mitochondrial metabolism; Sorafenib; ZEB1.
© 2025. The Author(s).
Conflict of interest statement
Declarations. Competing interests: The authors declare no competing interests.
Figures
Similar articles
-
Bacterial metabolite butyrate in modulating sorafenib-targeted microRNAs to curtail its resistance in hepatocellular carcinoma.J Cancer Res Clin Oncol. 2023 Aug;149(9):5823-5839. doi: 10.1007/s00432-022-04544-7. Epub 2022 Dec 30. J Cancer Res Clin Oncol. 2023. PMID: 36583742 Free PMC article.
-
Inhibition of Wnt/β-catenin increases anti-tumor activity by synergizing with sorafenib in hepatocellular carcinoma.Cell Death Dis. 2025 Jul 1;16(1):466. doi: 10.1038/s41419-025-07789-5. Cell Death Dis. 2025. PMID: 40593458 Free PMC article.
-
A novel mitochondrial unfolded protein response-related risk signature to predict prognosis, immunotherapy and sorafenib sensitivity in hepatocellular carcinoma.Apoptosis. 2024 Jun;29(5-6):768-784. doi: 10.1007/s10495-024-01945-6. Epub 2024 Mar 17. Apoptosis. 2024. PMID: 38493408
-
Insights into Sorafenib resistance in hepatocellular carcinoma: Mechanisms and therapeutic aspects.Crit Rev Oncol Hematol. 2025 Aug;212:104765. doi: 10.1016/j.critrevonc.2025.104765. Epub 2025 May 17. Crit Rev Oncol Hematol. 2025. PMID: 40389183 Review.
-
External beam radiotherapy for unresectable hepatocellular carcinoma.Cochrane Database Syst Rev. 2017 Mar 7;3(3):CD011314. doi: 10.1002/14651858.CD011314.pub2. Cochrane Database Syst Rev. 2017. PMID: 28267205 Free PMC article.
References
-
- Allemani, C., et al. Global surveillance of trends in cancer survival: analysis of individual records for 37,513,025 patients diagnosed with one of 18 cancers during 2000–2014 from 322 population-based registries in 71 countries (CONCORD-3). Lancet Lond. Engl.391 (10125), 1023–1075. 10.1016/S0140-6736(17)33326-3 (2018). - PMC - PubMed
-
- Khan, S. A., Tavolari, S. & Brandi, G. Cholangiocarcinoma: epidemiology and risk factors. Liver Int.39 (1), 19–31. 10.1111/liv.14095 (2019). - PubMed
-
- El-Sheikh, R. et al. Carbamoyl phosphate synthetase 1 (CPS1) as a prognostic marker in chronic hepatitis C infection. APMIS127, 93–105. 10.1111/apm.12917 (2019). - PubMed
MeSH terms
Substances
LinkOut - more resources
Full Text Sources
Medical
Research Materials
Miscellaneous
