. 2025 Oct;5(10):1957-1969.
doi: 10.1038/s43587-025-00940-z. Epub 2025 Aug 19.

Targeting iron-associated protein Ftl1 in the brain of old mice improves age-related cognitive impairment

Affiliations

Targeting iron-associated protein Ftl1 in the brain of old mice improves age-related cognitive impairment

Laura Remesal et al. Nat Aging. 2025 Oct.

Abstract

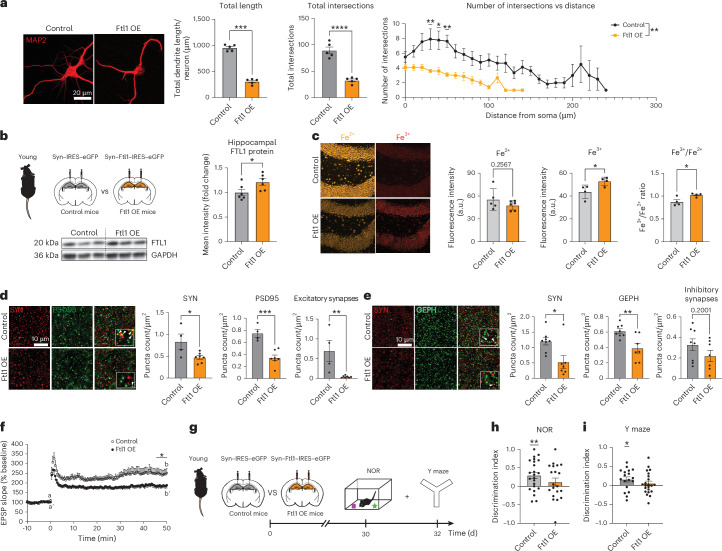
Understanding cellular and molecular drivers of age-related cognitive decline is necessary to identify targets to restore cognition at old age. Here we identify ferritin light chain 1 (FTL1), an iron-associated protein, as a pro-aging neuronal factor that impairs cognition. Using transcriptomic and mass spectrometry approaches, we detect an increase in neuronal FTL1 in the hippocampus of aged mice, the levels of which correlate with cognitive decline. Mimicking an age-related increase in neuronal FTL1 in young mice alters labile iron oxidation states and promotes synaptic and cognitive features of hippocampal aging. Targeting neuronal FTL1 in the hippocampi of aged mice improves synaptic-related molecular changes and cognitive impairments. Using neuronal nuclei RNA sequencing, we detect changes in metabolic processes, such as ATP synthesis, and boosting these metabolic functions through NADH supplementation mitigated pro-aging effects of neuronal FTL1 on cognition. Our data identify neuronal FTL1 as a key molecular mediator of cognitive rejuvenation.


Conflict of interest statement

Competing interests: S.A.V. consulted for SV Health Investors and The Herrick Company, Inc. All other authors declare no competing interests.

Figures

Fig. 1
Fig. 1. Neuronal FTL1 increases in the hippocampus with age and negatively correlates with cognitive function.
a, Schematic of transcriptomics workflow for RNA-seq of hippocampal neuronal nuclei (N = 3 young (3 months) and N = 2 aged (18 months) mice). Volcano plot illustrating differential gene expression in hippocampal neurons of young compared to aged mice. Red dots represent significantly increased genes, and light blue dots represent significantly decreased genes. b, Gene Ontology (GO) terms of biological processes associated with upregulated and downregulated genes in hippocampal neurons during aging. Numerals indicate number of genes in each process. c, Schematic of proteomics workflow for mass spectrometry of cortical and hippocampal synaptosomes (N = 3 young (3 months) biological replicates (20 mice per replicate) and N = 3 aged (18–20 months) biological replicates (20 mice per replicate)). Volcano plot illustrating differential protein levels in synaptosomes of young compared to aged mice. Red dots represent significantly increased proteins, and light blue dots represent significantly decreased proteins. d, GO terms of biological processes associated with upregulated and downregulated proteins in synaptosomes during aging. Numerals indicate number of genes in each process. e, Venn diagram illustrating the two datasets used for candidate selection (P= 0.05 and FC ≥1.4). f, Quantification of neuronal Ftl1 mRNA levels from young (3 months) and aged (18–20 months) mice by qPCR (N = 6 young and N = 6 aged mice (P = 0.0219)). g, Quantification of hippocampal FTL1 protein levels from young (3 months) and aged (24 months) mice by western blot (N = 12 young and N = 9 aged mice (P < 0.0001)). h, Pearson’s correlation between hippocampal FTL1 protein levels and overall cognition performance. Hippocampus-dependent learning and memory was assessed by Y maze, NOR and RAWM. A z-score was calculated for each behavioral test, and the average z-score across behavioral tests was used as a readout for overall cognitive performance (N = 15 young (3 months) and N = 11 aged (20 months) mice). Data are shown as mean ± s.e.m.; *P < 0.05, ****P < 0.0001, two-tailed t-test (f,g). FDR, false discovery rate; MS, mass spectrometry; FC, fold change; HH3, histone H3; S.F., synaptic fraction; N/M, nuclear/mitochondrial. Source data
Fig. 2
Fig. 2. Increasing neuronal FTL1 in the young hippocampus promotes aging-associated synaptic molecular changes and cognitive impairments.
a, Representative images and quantification of total neurite length and Sholl analysis of primary mouse neurons after viral-mediated Ftl1 overexpression (Ftl1 OE) or control. Neurons were infected at DIV8 and analyzed at DIV18. Five images per coverslip were taken, and 5–9 neurons were analyzed per coverslip, with the average per coverslip serving as a replicate (N = 5 control and N = 5 Ftl1 OE replicates per group) (total length P < 0.0001; total intersections P < 0.0001; intersections versus distance P = 0.0054). b, Schematic of hippocampal stereotaxic injections of young mice after neuronal-specific viral-mediated overexpression of Ftl1 (Ftl1 OE) or GFP control and representative western blot and quantification of hippocampal FTL1 protein (N = 6 control and N = 6 Ftl1 OE mice per group (P = 0.0434)). c, Representative images and quantification of labile Fe3+, Fe2+ and Fe3+/Fe2+ ratio in young mice hippocampus after neuronal-specific viral-mediated overexpression of (Ftl1 OE) or GFP (control) (N = 5 control and N = 6 Ftl1 OE for Fe2+ (P = 0.2567); N = 4 per group for Fe3+ (P = 0.0382) and Fe3+/Fe2+ ratio (P = 0.0279)). d, Representative images and quantification of excitatory synapses in the hippocampus of mice after neuron-specific, viral-mediated overexpression of Ftl1 (Ftl1 OE) or GFP (control) (N = 4 control and N = 7 Ftl1 OE mice per group (SYN P = 0.0265, PSD95 P = 0.0006; excitatory P = 0.0089)). e, Representative images and quantification of inhibitory synapses in the hippocampus of mice after neuronal-specific viral-mediated overexpression of Ftl1 (Ftl1 OE) or GFP (control) (N = 8 control and N = 6 Ftl1 OE mice per group (SYN P = 0.0129, GEPH P = 0.0053; inhibitory P = 0.2001)). f, EPSP recorded from the hippocampus of young mice after neuron-specific, viral-mediated overexpression of Ftl1 (Ftl1 OE) or GFP (control). LTP levels shown represent the average of the last 5 minutes (N = 16 control and N = 16 Ftl1 OE mice per group (P = 0.029)). g, Schematic of the timeline of hippocampal stereotaxic injections and cognitive behavioral testing for young mice overexpressing Ftl1. h, Object recognition memory assesed by NOR as the discrimination index for the novel object relative to the familiar object (N = 23 control (P = 0.0023) and N = 20 Ftl1 OE (P = 0.2764) young mice per group). i, Spatial working memory assessed by Y maze as the discrimination index for the novel arm relative to the trained arm (N = 18 control (P = 0.0336) and N = 22 Ftl1 OE (P = 0.4315) young mice per group). Data are shown as mean ± s.e.m; *P < 0.05, **P < 0.001, ***P < 0.0001, two-tailed t-test (ae), two-way ANOVA with Sidak’s post hoc test (a), unpaired Studentʼs t-test (g) and one-sample t-test with theoretical mean 0% (h,i). d, days; GEPH, gephyrin; min, minutes; SYN, synapsin. Source data
Fig. 3
Fig. 3. Targeting neuronal FTL1 in the aged hippocampus increases synaptic protein expression and rescues age-related cognitive impairments.
a, Representative images and quantification of total neurite length and Sholl analysis of primary mouse neurons after viral-mediated knockdown of Ftl1 (Ftl1 KD) or luciferase (control). Neurons were infected at DIV8 and analyzed at DIV18. Five images per coverslip were taken, and 5–9 neurons were analyzed per coverslip, with the average per coverslip serving as a replicate (N = 5 control and N = 5 Ftl1 KD replicates per group) (total length P = 0.0182; total intersections P = 0.0004; intersections versus distance P < 0.0001). b, Schematic of hippocampal stereotaxic injections of aged (18 months) mice after viral-mediated knockdown of Ftl1 (Ftl1 KD) or control and representative western blot and quantification of hippocampal FTL1 protein (P = 0.0323). c, Representative images and quantification of excitatory synapses in the hippocampus of mice after viral-mediated Ftl1 knockdown (Ftl1 KD) or control (N = 5 control and N = 4 Ftl1 KD mice per group (SYN P = 0.0132, PSD95 P = 0.1324; excitatory P = 0.0777)). d, Representative images and quantification of inhibitory synapses in the hippocampus of mice after viral-mediated Ftl1 knockdown (Ftl1 KD) or control (N = 5 control and N = 4 Ftl1 KD mice per group (SYN P = 0.0257, GEPH P = 0.0031; inhibitory P = 0.2984)). e, Schematic of the timeline of hippocampal stereotaxic injections and cognitive behavioral testing for aged mice after Ftl1 abrogation (Ftl1 KD). f, Object recognition memory assesed by NOR as the discrimination index for the novel object relative to the familiar object (N = 16 control (P = 0.4977) and N = 17 Ftl1 KD (P = 0.0010) aged mice per group). g, Spatial working memory assessed by Y maze as the discrimination index for the novel arm relative to the trained arm (N = 17 control (P = 0.1895) and N = 18 Ftl1 KD (P = 0.0072) aged mice per group). h, Schematic of hippocampal stereotaxic injections of aged Rosa26-loxP-STOP-loxP-Cas9-eGFP transgenic mice after neuronal-specific viral-mediated expression of guide RNAs targeting Ftl1 (Ftl1 cKO) or control and representative western blot and quantification of hippocampal FTL1 protein (N = 5 control and N = 6 Ftl1 cKO mice per group (P = 0.0076)). i, Representative images and quantification of excitatory synapses in the hippocampus of Ftl1 cKO or control mice (N = 6 control and N = 6 Ftl1 cKO mice per group (SYN P = 0.0028, PSD95 P = 0.0140; excitatory P = 0.0773)). j, Representative images and quantification of inhibitory synapses in the hippocampus of Ftl1 cKO or control mice (N = 5 control and N = 9 Ftl1 cKO mice per group (SYN P = 0.1091, GEPH P = 0.1091, inhibitory P = 0.0472)). k, Schematic of the timeline of hippocampal stereotaxic injections and cognitive behavioral testing for aged Rosa26-loxP-STOP-loxP-Cas9-eGFP transgenic mice with loss of neuronal Ftl1. i, Object recognition memory assesed by NOR as the discrimination index for the novel object relative to the familiar object (N = 17 aged control (P = 0.1423) and N = 9 aged Ftl1 cKO (P = 0.0087) mice per group). j, Spatial working memory assessed by Y maze as the discrimination index for the novel arm relative to the trained arm (N = 21 aged control (P = 0.5796) and N = 14 aged Ftl1 cKO (P = 0.2676) mice per group). Data are shown as mean ± s.e.m; *P < 0.05, **P < 0.005, ***P < 0.0001, two-tailed t-test (ad,hj), two-way ANOVA with Sidak’s post hoc test (a) and one-sample t-test with theoretical mean 0% (f,g,l,m). d, days; GEPH, gephyrin; mo, months; SYN, synapsin; scr, scramble. Source data
Fig. 4
Fig. 4. Pro-aging effects of increased neuronal FTL1 on cognitive function are mediated in part through alterations in metabolic processes.
a, Schematic of hippocampal stereotaxic injections of young mice after neuronal-specific viral-mediated overexpression of Ftl1 (Ftl1 OE) or GFP control. b, Volcano plot illustrating differential gene expression in hippocampal neurons of Ftl1 OE compared to control mice. Red dots represent significantly upregulated genes, and light blue dots represent significantly downregulated genes. c, Gene Ontology (GO) terms of biological processes associated with upregulated and downregulated genes. d, Schematic of hippocampal stereotaxic injections of aged (18 months) mice after viral-mediated knockdown of Ftl1 (Ftl1 KD) or control. e, Volcano plot illustrating differential gene expression in hippocampal neurons of aged Ftl1 KD mice compared to aged control mice. Red dots represent significantly upregulated genes, and light blue dots represent significantly downregulated genes. f, GO terms of biological processes associated with upregulated and downregulated genes. g, Schematic of hippocampal stereotaxic injections of aged Rosa26-loxP-STOP-loxP-Cas9-eGFP transgenic mice after neuronal-specific viral-mediated expression of guide RNAs targeting Ftl1 (Ftl1 cKO) or control. h, Combined two-dimensional visualization of single-nuclei clusters in the hippocampus from aged Ftl1 cKO and control mice (N = 2 pooled mice per group). il, GO terms of biological processes associated with upregulated and downregulated genes identified through single-nuclei RNA-seq analysis in excitatory neuron (i), CA1 (j), CA2/CA3 (k) and DG (l) clusters of aged Ftl1 cKO and control mice. m, Venn diagram illustrating three RNA-seq datasets used for gene expression comparison among Ftl1 OE, Ftl1 KD and Ftl1 cKO conditions. n, GO terms of biological processes associated with 32 shared genes identified across all conditions. o, Heatmap of proton-motive force-driven mitochondrial ATP synthesis. p, Mitochondrial ATP production rate in primary neurons after viral-mediated Ftl1 overexpression on DIV0 quantified by Seahorse on DIV11 (N = 9 control and N = 10 Ftl1 OE replicates per condition (P < 0.0001)). q, Mitochondrial ATP production rate in primary neurons after viral-mediated Ftl1 KD on DIV8 quantified by Seahorse on DIV11 (N = 17 control and N = 18 replicates per condition (P = 0.0784)). r, Representative images of total neurite length and Sholl analysis of primary mouse neurons after viral-mediated Ftl1 overexpression (Ftl1 OE) or control, treated with NADH at 200 µM or saline daily for 5 days. Neurons were infected at DIV8, treated with NADH from DIV14 to DIV18 and analyzed at DIV18 (N = 5 control+saline, N = 5 Ftl1 OE+saline, N = 6 control+NADH and N = 6 Ftl1 OE+NADH replicates per group) (total length (control+saline versus OE+saline P = < 0.0001; OE+saline versus OE+NADH P = 0.0002); total intersections (control+saline versus OE+saline P = 0.0075; OE+saline versus OE+NADH P = 0.0039); intersections versus distance (control+saline versus OE+saline P = <0.0001; OE+saline versus OE+NADH P = <0.0001)). s, Schematic of the timeline of hippocampal stereotaxic injections and cognitive testing for young Ftl1 OE with control mice treated with either NADH or saline control. t, Object recognition memory assesed by NOR as the discrimination index for the novel object relative to the familiar object (N = 12 control+saline (P = 0.0046), N = 12 Ftl1 OE+saline (P = 0.0616), N = 13 control+NADH (P = 0.0016), N = 14 Ftl1 OE+NADH (P = 0.0017)). u, Spatial working memory assessed by Y maze as the discrimination index for the novel arm relative to the trained arm (N = 17 control+saline (P = 0.0250), N = 12 Ftl1 OE+saline (P = 0.0551), N = 14 control+NADH (P = 0.0238), N = 13 Ftl1 OE+NADH (P = 0.0020)). Data are shown as mean ± s.e.m; *P < 0.05, **P < 0.005, ***P < 0.0001, ****P < 0.0001, two-tailed t-test (p,q), two-way ANOVA with Tukey’s post hoc test (r) and one-sample t-test with theoretical mean 0% (t,u). Ctrl, control; d, days; DG, dentate gyrus; FDR, false discovery rate; h, hour; min, minutes; IP, intraperitoneal; pyramid., pyramidal; Sal, saline; STX, stereotaxic; tr, treatment.
Extended Data Fig. 1
Extended Data Fig. 1. FTL1 increases with age in the mouse hippocampus.
(a) Quantification of hippocampal FTL1 protein levels from young (3 months) and aged (18 months) mice by Western blot. N = 12 young and N = 9 aged mice (p-value < 0.0001). Data shown as mean±s.e.m.; ****P < 0.001, two-tailed t-test. Source data
Extended Data Fig. 2
Extended Data Fig. 2. Ftl1 overexpression in primary neurons does not induce cell death in vitro.
Primary neurons were infected with lentivirus encoding Ftl1 or control at 8 days in vitro (DIV8) and analyzed at DIV18. (a) Illustration showing the coverslip regions used for neurite analysis of primary neurons following lentiviral-mediated overexpression of Ftl1 (Ftl1 OE) or control. (b) Representative images of GFP-positive neurons used as a redout for lentiviral infection for both Ftl1 OE and control conditions. (c) Representative Western blot and quantification of FTL1 protein levels N = 8 replicates/condition (p-value < 0.0001). (d) Quantification of cell death in primary neurons following viral-mediated overexpression of Ftl1 by LDH assay. N = 5 positive control, N = 5 control and N = 5 Ftl1 OE replicates/condition (p-value < 0.0001). (e) Representative images and quantification of DAPI-positive nuclei of Ftl1 OE and control neurons at DIV18. N = 5 controls and N = 5 Ftl1 OE replicates/condition (p-value = 0.8956). Data shown as mean±s.e.m.; ****P < 0.001, two-tailed t-test (c,d,e). Source data
Extended Data Fig. 3
Extended Data Fig. 3. Neuronal Ftl1 overexpression decreases synaptic related proteins in the young hippocampus but does not alter health metrics.
(a) Schematic of hippocampal stereotaxic injections of young mice following neuronal specific viral-mediated overexpression of Ftl1 (Ftl1 OE) or GFP control (left). (a) Representative image of infected GFP-positive neurons (right). (b) Representative Western blot and quantification of synaptic proteins in the hippocampus of mice following viral-mediated Ftl1 overexpression (Ftl1 OE) or GFP (control). N = 5 control and N = 6 Ftl1 OE mice/group. NR2A (p-value = 0.0390), AMPA (p-value = 0.0206), SYN (p-value = 0.0258). (c-e) Baseline anxiety and activity assessed by open field (c) Center distance p-value = 0.3739, Perimeters and corners distance p-value = 0.2415, (d) Total distance p-value = 0.2198 and (e) weight (p-value = 0.9237) of young mice overexpressing Ftl1 or control. N = 23 control and N = 24 young Ftl1 OE mice. Data shown as mean±s.e.m.; *P < 0.05; two-tailed t-test. Source data
Extended Data Fig. 4
Extended Data Fig. 4. Abrogation of Ftl1 in primary neurons does not induce cell death in vitro.
Primary neurons were infected with lentivirus encoding shRNA targeting Ftl1 or control at 8 days in vitro (DIV8) and analyzed at DIV18. (a) Illustration showing the coverslip regions used for neurite analysis of primary neurons following lentiviral-mediated Ftl1 knockdown (Ftl1 KD) or control. (b) Representative images of GFP-positive neurons used as a redout for lentiviral infection for both Ftl1 KD and control conditions. (c) Representative Western blot and quantification of FTL1 protein levels. N = 8 replicates/condition N= (p-value < 0.0001) (d) Quantification of cell death in primary neurons following viral-mediated overexpression of Ftl1 by LDH assay. (d) Representative images and quantification of DAPI-positive nuclei of Ftl1 KD and control neurons at DIV18. N = 5 positive control, N = 5 control and N = 5 Ftl1 KD replicates/condition (p-value < 0.0001). (e) Representative images and quantification of DAPI-positive nuclei of Ftl1 KD and control neurons at DIV18. N = 5 controls and N = 5 Ftl1 KD replicates/condition (p-value = 0.2130). Data shown as mean±s.e.m.; ****P < 0.001, two-tailed t-test (c,d,e). Source data
Extended Data Fig. 5
Extended Data Fig. 5. Abrogation of Ftl1 increases synaptic related proteins in the aged hippocampus but does not alter health metrics.
(a) Schematic of hippocampal stereotaxic injections of aged mice following neuronal specific viral-mediated overexpression of Ftl1 (Ftl1 OE) or control. (b) Representative image of infected GFP-positive cells. (c) Representative Western blot and quantification of synaptic proteins in the hippocampus of Ftl1 KD and control mice following viral infection. N = 6 control and N = 6 Ftl1 OE mice/group. (d-f) Baseline anxiety and activity assessed by open field (d) Center distance p-value = 0.4282, Perimeters and corners distance p-value = 0.6428, (e) Total distance p-value = 0.7927 and (f) weight (p-value = 0.0787) of aged mice following abrogation of Ftl1 or control. N = 18 aged Ftl1 KD and N = 17 control mice. Data shown as mean±s.e.m.;*P < 0.05; ***P < 0.001; two-tailed t-test. Source data
Extended Data Fig. 6
Extended Data Fig. 6. Loss of neuronal Ftl1 decreases synaptic related proteins in the aged hippocampus but does not alter health metrics.
(a) Schematic of hippocampal stereotaxic injections of aged Rosa26-fl-stop-fl-Cas9-eGFP transgenic mice following neuronal specific viral-mediated expression of guide RNAs targeting Ftl1 (Ftl1 cKO) or control (left). (b) Representative image of infected GFP-positive neurons (right). (c) Representative Western blot and quantification of synaptic proteins in the hippocampus of Ftl1 cKO and control mice following neuronal specific viral infection. N = 6 control and N = 6 Ftl1 cKO mice/group. NR2A (p-value = 0.0166), AMPA (p-value = 0.0572), SYN (p-value = 0.0040). (c-e) Baseline anxiety and activity assessed by open field (c) Center distance p-value = 0.7044, Perimeters and corners distance p-value = 0.1993, (d) Total distance p-value = 0.2451 and (f) weight (p-value = 0.2408) of aged mice following abrogation of Ftl1 or control. N = 18 aged Ftl1 KD and N = 17 control mice. Data shown as mean±s.e.m.; ***P < 0.001; two-tailed t-test. Source data
Extended Data Fig. 7
Extended Data Fig. 7. Single-nuclei RNA-seq gene signature for each cell cluster.
Heatmap of the expression levels of the top marker genes for each of the 18 cell clusters.
Extended Data Fig. 8
Extended Data Fig. 8. Neuronal single-nuclei expression of enriched GO biological processes.
(a) Violin plot of module score of differentially expressed genes within significantly enriched GO biological processes relating to neuronal signaling transmission. (b) Violin plot of representative genes within GO biological processes relating to neuronal signaling transmission. (c) Violin plot of module score of differentially expressed genes within significantly enriched GO biological processes relating to mitochondrial processes. (d) Violin plot of representative genes within GO biological processes relating to mitochondrial processes.; ****P adj<0.001, DESeq2, Wald test.
Extended Data Fig. 9
Extended Data Fig. 9. Ftl1 overexpression and NADH treatment does not induce cell death in primary neurons in vitro.
Primary neurons were infected with lentivirus encoding Ftl1 or control at 8 days in vitro (DIV8) subsequently treated with NADH (200uM) for 5 consecutive days starting at DIV14 and analyzed at DIV18. (a) Schematic illustrating experimental timeline for lentiviral-mediated overexpression of Ftl1 (Ftl1 OE) or control and NADH treatment in primary neurons. (b) Quantification of cell death in primary neurons following viral-mediated overexpression of Ftl1 and NADH treatment by Lactate Dyhydrogenase (LDH) assay. Each data point represents the average of 3 replicates. Data shown as mean±s.e.m, two-way ANOVA followed by Tukey’s post hoc t-test.
Extended Data Fig. 10
Extended Data Fig. 10. NADH administration does not alter health metrics in young mice following neuronal Ftl1 overexpression.
(a) Schematic of the timeline of hippocampal stereotaxic injections and behavioral assessment for young mice overexpressing Ftl1 (Ftl1 OE) with control mice treated with either NADH (100 mg/kg) or saline control. (b-d) Baseline anxiety (b) and activity (c) assessed by open field and weight (d) of young Ftl1 OE or controls mice treated with NADH or saline. n = 10 young Ftl1 OE/NADH treated; n = 8 young Ftl1 OE/saline treated, N = 9 young control/NADH treated and N = 7 young control/saline treated. Data shown as mean±s.e.m.; two-way analysis of variance (ANOVA) with Tukey correction for multiple comparisons.

References

    1. Bieri, G., Schroer, A. B. & Villeda, S. A. Blood-to-brain communication in aging and rejuvenation. Nat. Neurosci.26, 379–393 (2023). - PubMed
    1. Aron, L., Zullo, J. & Yankner, B. A. The adaptive aging brain. Curr. Opin. Neurobiol.72, 91–100 (2022). - PMC - PubMed
    1. Villeda, S. A. et al. The aging systemic milieu negatively regulates neurogenesis and cognitive function. Nature477, 90–94 (2011). - PMC - PubMed
    1. Villeda, S. A. et al. Young blood reverses age-related impairments in cognitive function and synaptic plasticity in mice. Nat. Med.20, 659–663 (2014). - PMC - PubMed
    1. Katsimpardi, L. et al. Vascular and neurogenic rejuvenation of the aging mouse brain by young systemic factors. Science344, 630–634 (2014). - PMC - PubMed