. 2025 Oct;31(10):3440-3450.
doi: 10.1038/s41591-025-03890-6. Epub 2025 Aug 19.

A plasma proteomics-based candidate biomarker panel predictive of amyotrophic lateral sclerosis

Affiliations

A plasma proteomics-based candidate biomarker panel predictive of amyotrophic lateral sclerosis

Ruth Chia et al. Nat Med. 2025 Oct.

Abstract

Identifying a reliable biomarker for amyotrophic lateral sclerosis (ALS) is crucial for clinical practice. Here, in this cross-sectional study, we used the Olink Explore 3072 platform to investigate plasma proteomics as a biomarker tool for this neurodegenerative condition. Thirty-three proteins were differentially abundant in the plasma of patients with ALS (n = 183) versus controls (n = 309). We replicated our findings in an independent cohort (n = 48 patients with ALS and n = 75 controls). We then applied machine learning to create a model that diagnosed ALS with high accuracy (area under the curve, 98.3%). By analyzing plasma samples from individuals before ALS symptoms emerged, we estimated the age of clinical onset and showed that the disease process-impacting skeletal muscle, nerves and energy metabolism-occurs years before symptoms appear. Our research suggests that plasma proteins can be a biomarker for this fatal disease and offers molecular insights into its prodromal phase.


Conflict of interest statement

Competing interests: R.C., R.M., J.Y.K., L.F., C.L.D., S.W.S. and B.J.T. have a patent pending (US Patent application no. 63/717,807) on the diagnostic testing for ALS based on the proteomic panel. B.J.T. holds patents on the clinical testing and therapeutic intervention for the hexanucleotide repeat expansion of C9orf72. B.J.T. and S.W.S. receive research support from Cerevel Therapeutics. S.W.S. serves on the scientific advisory committees of the Lewy Body Dementia Association, Mission MSA and the GBA1 Canada Initiative. The other authors declare no competing interests.

Figures
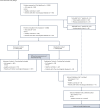
Fig. 1
Fig. 1. Study workflow.
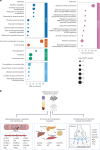
We conducted a cross-sectional study to identify ALS biomarkers via proteomic analysis of plasma samples. We performed differential abundance analysis on proteomic data generated from plasma samples of patients with ALS, healthy controls and patients with other neurological diseases in both the Discovery Cohort and the Replication Cohort. The other neurological diseases included corticobasal syndrome (n = 8 patients), Lewy body dementia (n = 8 patients), multiple system atrophy (n = 5 patients), Parkinson’s disease (n = 153 patients), progressive supranuclear palsy (n = 19 patients) and dementia, not otherwise specified (n = 1 patient). After this, we applied supervised machine learning using plasma protein levels and clinical parameters to identify a molecular signature of ALS. The same samples from the Discovery Cohort and the Replication Cohort sequentially formed the Training Set and the Testing Set in the machine learning process. The 46 samples withheld from the initial analyses due to the absence of genetic data were labeled as External Validation Set 1. For External Validation Set 2, we obtained proteomic data from the UK Biobank. Additionally, a web tool was created for clinical researchers to analyze their own data. ‘Neurological’ pertains to neurological conditions other than ALS. 1°, first degree; UKB, UK Biobank.
Fig. 2
Fig. 2. Differential abundance of plasma proteins in patients diagnosed with ALS compared with control individuals.
a, Volcano plot showing the differential abundance of proteins in the Discovery Cohort (n = 183 ALS cases versus n = 172 healthy controls plus n = 137 other neurological diseases). The dotted vertical lines delineate a ±1.4-fold change threshold, and the dotted horizontal lines represent the 0.05 P-value threshold. Blue and red dots denote statistically significant downregulated or upregulated proteins determined by generalized linear regression (adjusted to 5% FDR for multiple comparisons). b, Volcano plot showing the differential abundance of proteins in the Replication Cohort (n = 48 ALS cases versus n = 42 healthy controls and n = 33 other neurological diseases). Black circles highlight the proteins that were significant in the Discovery Cohort. c, Scatter plot comparing the discovery and replication z-scores of the 33 proteins significantly associated with ALS in the Discovery Cohort. The error band is shown as a gray band representing the 95% confidence interval for the mean prediction (blue linear regression line) at each x value. Pearson correlation coefficients (R) were calculated to assess the linear association between variables. P values were computed using a two-sided test of the null hypothesis that the correlation coefficient equals 0. d, A comparison of the proteins significantly associated with ALS in plasma and their abundances in CSF. The CSF protein levels were derived from SomaScan data generated for n = 14 ALS cases and n = 89 healthy controls. The 6 proteins significantly correlated with ALS in the CSF are highlighted in color, whereas the other 21 appear in gray. The additional six proteins were not tested by the SomaScan platform. The y axis indicates a log2(fold change) relative to the control cohort.
Fig. 3
Fig. 3. Pathway analysis of ALS based on differentially abundant plasma proteins.
a, Functional enrichment analysis of ALS based on the differentially abundant plasma proteins (n = 33) performed using the ‘clusterProfiler’ software package. The x axis corresponds to the fold enrichment of the category in ALS cases compared with controls. A one-sided t-test was used to test for enrichment of genes in a particular pathway, followed by FDR correction to account for multiple testing comparisons. The size of each respective dot indicates the FDR-adjusted P value on a −log10 scale. Significant Gene Ontology (GO) enrichments for biological processes (BP, blue), molecular functions (MF, orange) and cellular functions (CC, green) as well as pathways from Reactome (magenta) and Kyoto Encyclopedia of Genes and Genomes (KEGG) (light blue) are shown. b, The three main BPs identified in ALS based on the enrichment analysis of the differentially abundant plasma proteins are shown. The proteins involved in each category are listed. Panels a and b created with BioRender.com.
Fig. 4
Fig. 4. Supervised machine learning to diagnose ALS based on plasma proteins.
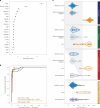
a, The mean importance score of the 20 features (17 proteins plus sex, age at collection and blood collection tube type) making up the random forest model. The importance score quantifies the contribution of each feature, when permuted, to the model’s predictive performance. Features are ranked from most influential at the top (NEFL) to the least influential at the bottom (sex). Error bars represent the s.d. of the mean feature importance estimates across 100 repeated permutations. b, The performance of the random forest model is displayed as ROC curves. The ROC curves show the performance of the Testing Set (green, n = 48 ALS versus n = 42 healthy controls plus n = 32 other neurological diseases; one other neurological disease sample was excluded due to incomplete protein data), the External Validation Set 1 (red, n = 14 ALS versus n = 15 healthy controls plus n = 17 other neurological diseases) and the External Validation Set 2 (yellow, n = 13 ALS versus n = 23,601 healthy controls). The black curve denotes the average AUC across these three cohorts. c, Classification of individual samples using the ALS risk scores generated by the random forest model using the 20 features. The white area on the right denotes ALS risk scores consistent with a diagnosis of ALS. In contrast, the gray area on the left, which was manually added to the plot, delineates scores consistent with healthy control status or other neurological diseases. A black circle around a dot indicates a sample misclassified by the model.
Fig. 5
Fig. 5. Regression analysis of ALS risk score derived from supervised machine learning predicts the age of ALS onset in asymptomatic patients.
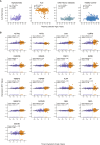
a, Scatter plot comparing the ALS risk score based on the random forest model and the years before symptom onset in patients with ALS. The purple dots represent plasma samples taken from presymptomatic individuals (n = 109 from the UK Biobank and n = 1 from this study) who subsequently developed ALS. The orange dots denote plasma samples taken from individuals with ALS cases in the Training Set, the Testing Set and External Validation Sets 1 and 2 (n = 251 ALS cases whose samples were collected within 5 years of symptom onset). The regression line with the 95% confidence interval for the mean prediction is presented as a black line with a gray band. The slope, associated P value, R2 and RMSE of the regression model are displayed. The statistical significance of each coefficient was assessed using a two-sided hypothesis test with a null hypothesis that the coefficient equals 0. The vertical dashed line indicates the rough boundary between presymptomatic individuals and those diagnosed with ALS. The data sourced from the UK Biobank are represented in whole years, explaining why some cases seem to exhibit symptoms prior to 0 years. b, The slope coefficients of the 17 plasma protein levels included in the random forest model when regressed individually against the time to symptom onset. Data are presented as estimated coefficient values from linear regression ± s.e., and the P values derived from two-sided hypothesis testing are displayed. The color of the bars denotes the Olink panel category of the protein: yellow, cardiometabolic panel; red, inflammation; green, neurology; blue, oncology.
Extended Data Fig. 1
Extended Data Fig. 1. Comparison of proteins quantified using Olink and ELISA assays.
ELISA assays were performed on plasma samples from the Discovery and Replication datasets (n = 16 ALS cases and n = 16 healthy controls). ELISA kits were available for 30 of the 33 differentially abundant proteins. We present exploratory data for 16 proteins, while the other ELISA assays are excluded due to either lack of protein detection (n = 13) or assay failure (n = 1). Each row displays data for an individual protein. The agreement between protein measurements from the ELISA or ProQuantumTM (abbreviated as ProQ) and Olink assays was evaluated using three methods: correlation (first panel), Bland-Altman analysis (second panel), and differential analysis comparing ALS (orange dots) with healthy controls (blue dots) through either ELISA or ProQuantumTM (third panel) or Olink (fourth panel) measurements. Pearson correlation coefficients (R) were calculated to assess the linear association between variables. P-values were computed using a two-sided test of the null hypothesis that the correlation coefficient equals zero. The grey area indicates the 95% confidence interval for the mean prediction (black linear regression line) at each x-value. In the Bland-Altman (B-A) plots, the mean bias difference between the two assays is depicted as a solid horizontal black line in the center of the plot. The shaded grey area reflects the 95% limits of agreement for the paired measurements from each sample, with upper and lower limit values shown in red font. The box-and-whisker plots in the differential analysis panels present the range (whiskers) alongside the first, median, and third quartiles of the measurements within the box. The effect size of the regression, or beta, along with the corresponding p-values, is included in each panel.
Extended Data Fig. 2
Extended Data Fig. 2. Comparison between SomaScan 7k and Olink 3072 Explore in BLSA samples.
Plasma profiling was performed on a random subset of the Baltimore Longitudinal Study of Aging (BLSA) samples (n = 9) using the SomaScan 7 K and Olink 3072 Explore platforms. a, The Venn diagram shows the overlap of the UniProt targets assayed on the two platforms. Of the 2,886 proteins assayed on the Olink platform, there were 2,868 unique UniProt IDs. Of these, 2,120 proteins overlapped with the SomaScan 7 K platform. b, Spearman correlations between the overlapping protein measurements on the Olink and SomaScan platforms. K-means clustering, defined by Katz and colleagues, divided the distribution into three clusters. c, The heatmap illustrates Spearman correlations among overlapping protein measurements from the Olink and SomaScan platforms, specifically for 27 differentially expressed proteins in ALS cases. Data for the six other differentially expressed proteins (CORO6, DTNB, FGF21, NEB, RBFOX3, and SSC4D) were unavailable.
Extended Data Fig. 3
Extended Data Fig. 3. Differential abundance of plasma proteins in ALS patients with C9orf72 expansions.
These volcano plots illustrate the differential protein abundance in a, ALS patients with the pathogenic C9orf72 repeat expansion (n = 29) compared to ALS patients without the expansion (n = 202), b, ALS patients with C9orf72 (n = 29) compared to ALS patients without the expansion (n = 202) combined with control subjects (n = 383; comprising 169 neuro-control non-carriers, and 214 healthy control non-carriers), and c, asymptomatic individuals with C9orf72 (n = 12) compared to symptomatic ALS patients with the expansion (n = 29). The dotted vertical lines indicate a ± 1.4-fold change threshold, while the dotted horizontal lines represent the 0.05 p-value threshold. Blue and red dots depict statistically significant down-regulated or up-regulated proteins identified through generalized linear regression. Significance was assessed using two-sided moderated t-tests with p-values adjusted by the false discovery rate (FDR) method.
Extended Data Fig. 4
Extended Data Fig. 4. SHAP values for the features used in the supervised machine learning model to predict ALS diagnosis.
Distribution of the SHAP values calculated using the machine-learning model for the 20 features with the most substantial effect on the ALS diagnosis classification model. The Training Set (n = 183 ALS cases, n = 172 healthy controls, and n = 137 patients with other neurological diseases), the Testing Set (n = 48 ALS cases, n = 42 healthy controls, and n = 33 patients with other neurological diseases; one sample from the other neurological diseases group was dropped due to incomplete protein data), the External Validation Set 1 (n = 14 ALS cases, n = 15 healthy controls, and n = 17 patients with other neurological diseases), and the External Validation Set 2 (i.e., UK Biobank, n = 13 ALS cases, n = 23,601 healthy controls) are shown. Each point represents a sample; orange dots represent ALS cases, dark blue dots represent healthy individuals, and light blue dots represent patients with other neurological diseases. A black circle around a dot indicates a sample misclassified by the model.
Extended Data Fig. 5
Extended Data Fig. 5. Relationship of the proteomic data to age at plasma sample collection and time to symptom onset.
a, The distributions of the ALS Risk Score according to the age at the time of plasma collection are shown for asymptomatic individuals (purple, n = 126), ALS cases (orange, n = 259), patients with other neurological diseases (light blue, n = 186), and a representative sample of the healthy controls (blue, n = 533). Asymptomatic individuals were the only ones showing a slight correlation with time with a 5 to 14-fold steeper slope coefficient compared to healthy individuals and those with ALS or other neurological diseases. This indicates that the increase in ALS Risk Score seen in preclinical ALS is not influenced solely by normal aging or pathological aging associated with neurodegenerative diseases. The bands represent the 95% confidence intervals of the linear regression lines at each x-value. The statistical significance of each coefficient was assessed using a two-sided hypothesis test with a null hypothesis that the coefficient equals zero. The slopes, the R2 values, and the associated p-values are displayed. A black circle around a dot indicates a sample misclassified by the Random Forest model. b, Scatterplots comparing time to symptom onset in patients with ALS with expression levels for the 17 individual proteins included in the Random Forest model. The purple dots represent plasma samples taken from pre-symptomatic individuals (n = 109 from the UK Biobank, n = 1 from this study) who subsequently developed ALS. The orange dots denote plasma samples taken from individuals with ALS cases (n = 12 from the UK Biobank, n = 239 from this study). The gray bands represent the 95% confidence intervals of the linear regression line at each x-value. The slopes and the associated p-values derived from two-sided hypothesis testing are displayed.

References

    1. Feldman, E. L. et al. Amyotrophic lateral sclerosis. Lancet400, 1363–1380 (2022). - PMC - PubMed
    1. Arthur, K. C. et al. Projected increase in amyotrophic lateral sclerosis from 2015 to 2040. Nat. Commun.7, 12408 (2016). - PMC - PubMed
    1. Fournier, C. N. Considerations for amyotrophic lateral sclerosis (ALS) clinical trial design. Neurotherapeutics19, 1180–1192 (2022). - PMC - PubMed
    1. Masrori, P. & Van Damme, P. Amyotrophic lateral sclerosis: a clinical review. Eur. J. Neurol.27, 1918–1929 (2020). - PMC - PubMed
    1. Turner, M. R. et al. Controversies and priorities in amyotrophic lateral sclerosis. Lancet Neurol.12, 310–322 (2013). - PMC - PubMed