

Association between the triglyceride to high-density lipoprotein cholesterol ratio and diabetes mellitus likelihood in patients with chronic kidney disease
- PMID: 40830768
- PMCID: PMC12362956
- DOI: 10.1186/s12882-025-04377-9
Association between the triglyceride to high-density lipoprotein cholesterol ratio and diabetes mellitus likelihood in patients with chronic kidney disease
Abstract
Background: Patients with chronic kidney disease (CKD) are at an increased risk of diabetes mellitus (DM) and dyslipidemia, yet the specific relationship between lipid profiles, particularly triglyceride-to-high-density lipoprotein cholesterol ratio (TG/HDL-C ratio), and DM likelihood in this population has not been thoroughly elucidated.
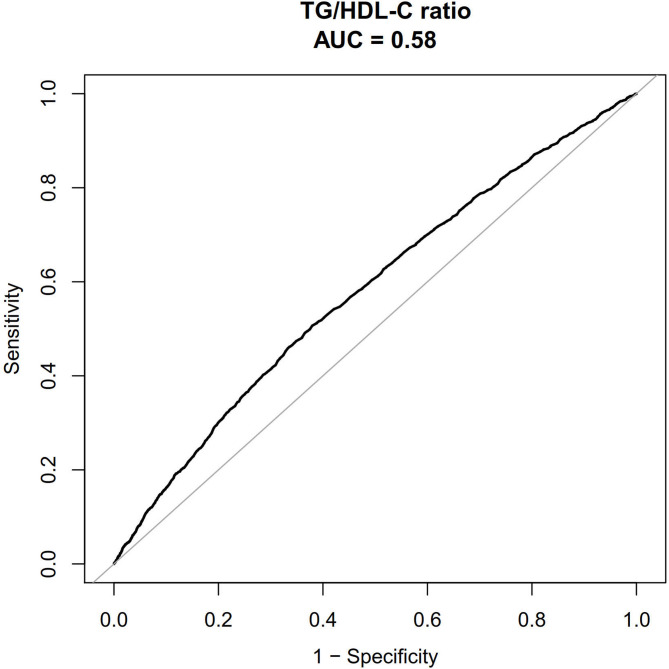
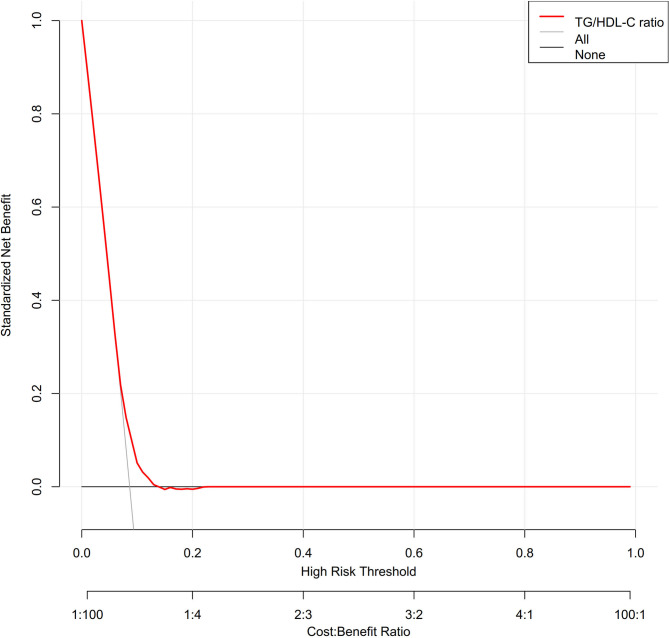
Methods: We conducted a cross-sectional analysis of 20,310 unselected patients with CKD enrolled from 2006 to 2015. The relationship between the TG/HDL-C ratio and the likelihood of DM was evaluated using binary logistic regression. Sensitivity and subgroup analyses were performed, and a generalized additive model with smooth curve fitting assessed potential non-linear associations. We also performed the receiver operating characteristic (ROC) curve and decision curve analysis to assess the determination and clinical use, respectively.
Results: Among the participants (mean age 60.907 ± 10.044 years; 79.580% male), 1,758 (8.656%) had DM. The median TG/HDL-C ratio was 0.655(interquartile range 0.465-0.920). After adjusting for covariates, a significant positive association was found between the TG/HDL-C ratio and DM likelihood (odds ratio [OR], 1.494; 95% confidence interval [CI], 1.354-1.648; P < 0.001). A non-linear relationship was observed with an inflection point at a TG/HDL-C ratio of 1.030. The ORs below and above this point were 1.866 (95% CI, 1.472-2.365) and 1.297 (95% CI, 1.094-1.538), respectively. The area under curve (AUC) of the nomogram was of 0.580 (95% CI, 0.566-0.594). Subgroup analyses indicated a stronger association in patients without hypertension, in female and patients with AF.
Conclusion: The TG/HDL-C ratio is independently associated with DM likelihood in patients with CKD, exhibiting a non-linear relationship particularly significant when the ratio is below 1.030. The TG/HDL-C ratio may serve as a useful marker for DM likelihood assessment in CKD patients, though prospective studies are needed to determine its role in prevention strategies.
Clinical trial number: Not applicable.
Keywords: Chronic kidney disease; Cross-sectional study; Diabetes; Non-linear; Triglyceride to high-density lipoprotein cholesterol ratio.
© 2025. The Author(s).
Conflict of interest statement
Declarations. Ethics approval and consent to participate: The previously published article indicates that ethical approval was obtained from the Ethics Committees of Kailuan General Hospital, Beijing Chaoyang Hospital, and TianTan Hospital, in accordance with the ethical principles outlined in the Declaration of Helsinki. Written informed consent was acquired from all participants prior to their enrollment in the study [33–37, 43]. Consent for publication: Not applicable. Competing interests: The authors declare no competing interests.
Figures


Similar articles
-
Study on the correlation between triglyceride glucose index, triglyceride glucose index to high-density lipoprotein cholesterol ratio, and the risk of diabetes in nonalcoholic fatty liver disease.Front Endocrinol (Lausanne). 2025 Jun 23;16:1594548. doi: 10.3389/fendo.2025.1594548. eCollection 2025. Front Endocrinol (Lausanne). 2025. PMID: 40626240 Free PMC article.
-
Association between atherogenic index of plasma and hypertension combined with diabetes mellitus in United States adults: an analysis of the NHANES surveys from 2011 to 2016.J Health Popul Nutr. 2025 Jul 30;44(1):269. doi: 10.1186/s41043-025-01013-y. J Health Popul Nutr. 2025. PMID: 40739270 Free PMC article.
-
Elevated small dense low-density lipoprotein cholesterol to high-density lipoprotein cholesterol ratio is associated with an increased risk of metabolic dysfunction associated fatty liver disease in Chinese patients with type 2 diabetes mellitus.J Diabetes Investig. 2024 May;15(5):634-642. doi: 10.1111/jdi.14148. Epub 2024 Jan 22. J Diabetes Investig. 2024. PMID: 38251808 Free PMC article.
-
Signs and symptoms to determine if a patient presenting in primary care or hospital outpatient settings has COVID-19.Cochrane Database Syst Rev. 2022 May 20;5(5):CD013665. doi: 10.1002/14651858.CD013665.pub3. Cochrane Database Syst Rev. 2022. PMID: 35593186 Free PMC article.
-
Angiotensin-converting enzyme inhibitors and angiotensin receptor blockers for adults with early (stage 1 to 3) non-diabetic chronic kidney disease.Cochrane Database Syst Rev. 2023 Jul 19;7(7):CD007751. doi: 10.1002/14651858.CD007751.pub3. Cochrane Database Syst Rev. 2023. PMID: 37466151 Free PMC article.
References
-
- Nanditha A, Ma RC, Ramachandran A, Snehalatha C, Chan JC, Chia KS, Shaw JE, Zimmet PZ. Diabetes in Asia and the pacific: implications for the global epidemic. Diabetes Care. 2016;39(3):472–85. - PubMed
-
- Zhang L, Wang F, Wang L, Wang W, Liu B, Liu J, Chen M, He Q, Liao Y, Yu X, et al. Prevalence of chronic kidney disease in china: a cross-sectional survey. Lancet. 2012;379(9818):815–22. - PubMed
-
- Stenvinkel P. Chronic kidney disease: a public health priority and harbinger of premature cardiovascular disease. J Intern Med. 2010;268(5):456–67. - PubMed
MeSH terms
Substances
Grants and funding
LinkOut - more resources
Full Text Sources
Medical
Miscellaneous
