. 2025 Aug 19;23(1):937.
doi: 10.1186/s12967-025-06838-z.

Construction of a feature gene and machine prediction model for inflammatory bowel disease based on multichip joint analysis

Affiliations

Construction of a feature gene and machine prediction model for inflammatory bowel disease based on multichip joint analysis

Yan Chaosheng et al. J Transl Med. .

Abstract

Background: Inflammatory bowel disease (IBD) is a chronic nonspecific inflammatory disorder triggered by immune responses and genetic factors. Currently, there is no cure for IBD, and its etiology remains unclear. As a result, early detection and diagnosis of IBD pose significant challenges. Therefore, investigating biomarkers in peripheral blood is highly important, as they can assist doctors in the early identification and management of IBD.

Methods: We used a multichip joint analysis approach to explore the database thoroughly. On the basis of methods such as artificial neural networks (ANNs), machine learning techniques, and the SHAP model, we developed a diagnostic model for IBD. To select genetic features, we utilized three machine learning algorithms, namely, least absolute shrinkage and selection operator (LASSO), support vector machine (SVM), and random forest (RF), to identify differentially expressed genes. Additionally, we conducted an in-depth analysis of the enriched molecular pathways of these differentially expressed genes through Gene Ontology (GO) and Kyoto Encyclopedia of Genes and Genomes (KEGG) pathway enrichment analyses. Moreover, we used the SHAP model to interpret the results of the machine learning process. Finally, we examined the relationships between the differentially expressed genes and immune cells.

Results: Through machine learning, we identified four crucial biomarkers for IBD, namely, LOC389023, DUOX2, LCN2, and DEFA6. The SHAP model was used to elucidate the contribution of the differentially expressed genes to the diagnostic model. These genes were associated primarily with immune system modulation and microbial alterations. GO and KEGG pathway enrichment analyses indicated that the differentially expressed genes demonstrated associations with molecular pathways such as the antimicrobial and IL-17 signaling pathways. By performing correlation and differential analyses between differentially expressed genes and immune cells, we found that M1 macrophages exhibited stable differential changes in all four differentially expressed genes. M2 macrophages, resting mast cells, neutrophils, and activated memory CD4 T cells all showed significant differences in three of the differentially expressed genes.

Conclusion: We identified differentially expressed genes (LOC389023, DUOX2, LCN2, and DEFA6) with significant immune-related effects in IBD. Our findings suggest that machine learning algorithms outperform ANNs in the diagnosis of IBD. This research provides a theoretical foundation for the clinical diagnosis, targeted therapy, and prognostic evaluation of IBD.

Keywords: Artificial neural network; Diagnostic model; Immune differences; Inflammatory bowel disease; Machine learning.


Conflict of interest statement

Declarations. Ethics approval and consent to participate: According to local legislation and institutional requirements, research on human participants requires ethical review and approval. In compliance with the ethical requirements of Jiangnan University Affiliated Hospital in Wuxi, Jiangsu Province, the ethical approval number for this study is LS2024012. Consent for publication: Not required. Competing interests: The author declares that there are no conflicts of interest.

Figures
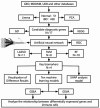
Fig. 1
Fig. 1
Flowchart of this study
Fig. 2
Fig. 2
Analysis of the differences in gene expression between different datasets and the effectiveness of batch effect correction. (A) Distribution of samples from different experiments before batch calibration. (B) PCA involved randomly shuffling samples from different experiments. (C) Heatmap of DEGs in the IBD dataset. Red and blue indicate upregulated and downregulated DEGs, respectively. (D) Volcanic map of DEGs in the IBD dataset with |log2FC|>2. Red indicates an increase, and blue indicates a decrease
Fig. 3
Fig. 3
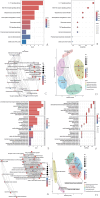
This set of images shows the analysis of DEGs, demonstrating different pathways and functional classifications. (A-B) KEGG pathway analysis, with the color becoming redder as the P value decreases. (E-F) GO analysis, including biological processes, cellular components, and molecular functions. The color becomes redder as the P value decreases. (C, D, G, H) Pathways enriched in the DEGs; the size of the dots indicates the number of DEGs contained in the corresponding pathways. The larger the number is, the larger the number of dots
Fig. 4
Fig. 4
DEGs were screened through various methods, and the differential results were visualized. (A, E) The experimental group was distinguished from the control group with an ANN. A ROC curve was constructed to evaluate the overall diagnostic performance. (B, F) The genes were screened with the LASSO algorithm. To obtain the optimal model, a 10-fold cross-validation method was used. The lowest gene number (n = 11) at the lowest point of the curve was most suitable for LASSO. (C, G) Through the SVM algorithm for screening genes, accurate graphs and cross-validation error graphs were obtained, and 8 disease-characteristic genes were identified. (D, H) Screening genes through the random forest algorithm. Ten important genes were identified through the random forest method. IncNodePurity was used to sort genes on the basis of their relative importance. (I) The intersection of the results of the three algorithms yielded four genes. (J) Volcanic diagram of DEGs, with red indicating upregulation and green indicating downregulation. (K) Box plot of DEGs, with the horizontal axis representing the names of the intersecting characteristic genes and the vertical axis representing the expression levels of the genes. Blue indicates the sample of the control group, and red indicates the sample of the experimental group. (L) The outermost circle of the chromosome diagram represents the chromosome number, and the second circle represents the shape of the chromosome. The names of the intersecting genes are labeled at the corresponding positions on the chromosome
Fig. 5
Fig. 5
Prediction of the samples with machine learning models, and SHAP analysis of the machine learning models. (A) Ten machine learning models were used to construct ROC curves to evaluate the overall diagnostic performance. (B) Bar chart, with the vertical axis representing the gene name and the horizontal axis representing the mean absolute value of the SHAP value. The larger the value is, the more likely it is to indicate the gene and the greater the effect on the predicted results. (C) To present the results of the prediction of a single sample, the benchmark value was first determined, and then, for each gene, the result of the prediction was obtained. (D) The bee colony plot, with the vertical axis representing gene names and the horizontal axis representing SHAP values, allowed us to obtain the mean SHAP value for each gene. The larger the value is, the greater the contribution of that gene is. Each dot represents a sample, the color of the dot represents the gene expression level, with purple indicating low expression and orange indicating high expression. (E) Waterfall chart displaying the predicted results of a single sample. In this graph, the vertical axis represents the gene expression level, and the horizontal axis represents the predicted value. The larger the absolute value of the value is, the greater the effect of this gene on the predicted results. (F) Scatter plot in which the horizontal axis represents the expression level of one gene and the vertical axis represents the SHAP value. The dots represent the expression level of the gene, with purple indicating low expression and orange indicating high expression. The interaction relationship between these two genes and SHAP values can be observed
Fig. 6
Fig. 6
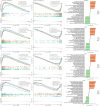
The GSEA/GSVA results of the target gene analysis were visualized. (A, B, D, E, F, H, J, K). The bar chart of the GSEA data, with the horizontal axis representing the sorted genes and the vertical axis representing the enriched scores, visualizes the top five pathways with the most significant enrichment. (C, F, I, L). In the GSVA bar chart, the vertical axis represents pathways, the horizontal axis represents T test values, red indicates upregulation of the target gene, and green indicates downregulation of the target gene. Gray indicates no difference in the target gene. (A-C) LOC389023, (D-F) DUOX2, (G-I) LCN2, (J-L) DEFA6
Fig. 7
Fig. 7
Immune-related analysis results. (A) Relationships between immune cells and target genes; *: P < 0.05, **: P < 0.01, ***: P < 0.001. (B) The number of immune cells in each sample was determined through immune cell infiltration analysis. The results of immune cell recordings were visualized with a bar chart, where the horizontal axis represents the sample and the vertical axis represents the content of the immune cells. The sum of all immune cells is one. Different colors indicate different immune cells. (C) The horizontal and vertical axes of the graph represent the names of the immune cells. The values inside represent the correlation coefficient, with red indicating a positive correlation and green indicating a negative correlation. (D) Box plot of the differences, with the horizontal axis representing the names of immune cells and the vertical axis representing the content of immune cells. Green indicates the samples of the control group, and red indicates the samples of the experimental group. *: P < 0.05, **: P < 0.01, ***: P < 0.001
Fig. 8
Fig. 8
Correlation analysis between differentially expressed genes and immune cells. (A) LOC389023, (B) DUOX2, (C) LCN2, and (D) DEFA6. Correlation lollipop charts in which the vertical axis represents the names of immune cells, the horizontal axis represents the correlation coefficient, the size of the circle represents the absolute value of the correlation coefficient, and the color of the circle represents the P value of the correlation test. Scatter plots in which the horizontal axis represents the expression level of the target gene, the vertical axis represents the content of immune cells, the R value represents the correlation coefficient, and the P value represents statistical validity
Fig. 9
Fig. 9
Detection of DUOX2, LCN2, and DEFA6 expression in 20 frozen human intestinal tissues with WB (A: first WB experiment, B: second WB experiment)
Fig. 10
Fig. 10
The 2−ΔΔCt values of different genes (DUOX2, LCN2, DEFA6, and LOC389023) in multiple sample groups were determined by real-time PCR. The vertical axis represents relative gene expression levels, whereas the horizontal axis represents grouping information (*p < 0.05, **p < 0.01, ***p < 0.001)

Similar articles

References

    1. Saeid Seyedian S, Alimentary tract research center, ahvaz jundishapur university of medical science ahvaz. A review of the diagnosis, prevention, and treatment methods of inflammatory bowel disease[J/OL]. J Med Life. 2019;12(2):113–22. 10.25122/jml-2018-0075 - PMC - PubMed
    1. Hodson R. Inflammatory bowel disease[J/OL]. Nature. 2016;540(7634):S97–97. 10.1038/540S97a - PubMed
    1. Diez-Martin E, Hernandez-Suarez L, MuÑoz-Villafranca C, et al. Inflammatory bowel disease: A comprehensive analysis of molecular bases, predictive biomarkers, diagnostic methods, and therapeutic Options[J/OL]. Int J Mol Sci. 2024;25(13):7062. 10.3390/ijms25137062 - PMC - PubMed
    1. Bisgaard T H, Allin K H Keeferl, et al. Depression and anxiety in inflammatory bowel disease: epidemiology, mechanisms and treatment[J/OL]. Nat Reviews Gastroenterol Hepatol. 2022;19(11):717–26. 10.1038/s41575-022-00634-6 - PubMed
    1. Eftekhar Z, Aghaei M, Saki N. DNA damage repair in megakaryopoiesis: molecular and clinical aspects[J/OL]. Expert Rev Hematol. 2024;17(10):705–12. 10.1080/17474086.2024.2391102 - PubMed

LinkOut - more resources