. 2025 Aug 19;32(1):77.
doi: 10.1186/s12929-025-01153-7.

Activation of mitophagy and proteasomal degradation confers resistance to developmental defects in postnatal skeletal muscle

Affiliations

Activation of mitophagy and proteasomal degradation confers resistance to developmental defects in postnatal skeletal muscle

Fasih A Rahman et al. J Biomed Sci. .

Abstract

Background: Postnatal skeletal muscle development leads to increased muscle mass, strength, and mitochondrial function, but the role of mitochondrial remodeling during this period is unclear. This study investigates mitochondrial remodeling during postnatal muscle development and examines how constitutive autophagy deficiency impacts these processes.

Methods: We initially performed a broad RNA-Seq analysis using a publicly available GEO database of skeletal muscle from postnatal day 7 (P7) to postnatal day 112 (P112) to identify differentially expressed genes. This was followed by investigation of postnatal skeletal muscle development using the mitophagy report mouse line (mt-Kiema mice), as well as conditional skeletal muscle knockout (Atg7f/f:Acta1-Cre) mice.

Results: Our study observed rapid growth of body and skeletal muscle mass, along with increased fiber cross-sectional area and grip strength. Mitochondrial maturation was indicated by enhanced maximal respiration, reduced electron leak, and elevated mitophagic flux, as well as increased mitochondrial localization of autophagy and mitophagy proteins. Anabolic signaling was also upregulated, coinciding with increased mitophagy and fusion signaling, and decreased biogenesis signaling. Despite the loss of mitophagic flux in skeletal muscle-specific Atg7 knockout mice, there were no changes in body or skeletal muscle mass; however, hypertrophy was observed in type IIX fibers. This lack of Atg7 and loss of mitophagy was associated with the activation of mitochondrial apoptotic signaling as well as ubiquitin-proteasome signaling, suggesting a shift in degradation mechanisms. Inhibition of the ubiquitin-proteasome system (UPS) in autophagy-deficient skeletal muscle led to significant atrophy, increased reactive oxygen species production, and mitochondrial apoptotic signaling.

Conclusion: These results highlight the role of mitophagy in postnatal skeletal muscle development and suggest that autophagy-deficiency triggers compensatory degradative pathways (i.e., UPS) to prevent mitochondrial apoptotic signaling and thus preserve skeletal muscle integrity in developing mice.

Keywords: Apoptosis; Autophagy; BNIP3; Development; Mitochondria; Mitophagy; Skeletal muscle; UPS.


Conflict of interest statement

Declarations. Ethics approval and consent to participate: All animal procedures were conducted in accordance with the standards set by the Canadian Council on Animal Care (CCAC) and were approved by the Animal Care Committee (ACC) at the University of Waterloo. Consent for publication: Not applicable. Competing interests: The authors declare that they have no competing interests.

Figures
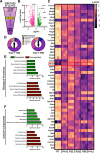
Fig. 1
Fig. 1
RNA sequencing analysis of gastrocnemius-plantaris muscle during development. A Representative visualization of genes analyzed from the publicly available Gene Expression Omnibus database (Accession ID: 1025). B Volcano plot displaying differential gene expression in skeletal muscle. The horizontal line delineates a significance threshold of p < 0.05. Vertical lines mark a z-score change greater than Log2. Green labels indicate upregulated differentially expressed genes (DEGs), while red labels indicate downregulated DEGs. C List of top 50 DEGs identified by DESeq2 analysis. D Gene ontology analyses and donut graph outputs summarizing changes in genes associated with five major remodeling processes: muscle remodeling, metabolism, apoptosis, mitochondria, autophagy, and the ubiquitin proteasome system (UPS). A total of 7402 genes related to these processes are upregulated while 5992 genes related to these processes are downregulated. E, F Gene ontology analyses output of the number of genes linked to the top five upregulated (green) and downregulated (red) biological processes. P7-P112 refers to animals collected at their respective postnatal timepoints. N = 3 mice per group
Fig. 2
Fig. 2
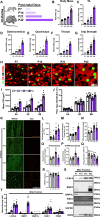
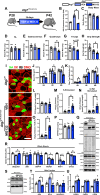
Changes in skeletal muscle during postnatal development of mt-Keima mice. A Representative visualization of collection timepoints. Quantification of B Body mass, relative skeletal muscle mass of C tibialis anterior (TA), D gastrocnemius, E quadriceps, and F triceps, and G peak forelimb grip strength. H Representative immunofluorescent images of TA muscle cross sections from P7 to P42 mice. Samples were stained with antibodies specific for individual MYH isoforms: type IIA (green), type IIX (red), type IIB (unstained), and dystrophin (DMD; red). Scale bars indicate 50 μm. I, J Quantification of mean cross-sectional area (CSA) and distribution of type IIA, IIX, and IIB fibers. K Representative confocal images of mitophagic flux from longitudinal TA muscle sections of mt-Keima reporter mice. Green fluorescence indicates healthy mitochondria. Red fluorescence indicates degrading mitochondria. Scale bar indicates 25 μm. L Quantification of mitophagic (i.e., red) puncta count per field. M Quantification of average individual mitophagic puncta size. N Quantification of maximal oxygen consumption rate (i.e., respiration) of permeabilized bundles from TA muscle. Simultaneous quantification of O succinate-stimulated hydrogen peroxide (H2O2) production, and P succinate + pyruvate/malate-stimulated H2O2 production in permeabilized TA muscle bundles. Q Quantification of mitochondrial fraction of electron leak. R Quantification of oxidative phosphorylation (OXPHOS) coupling. S Representative immunoblots of mitochondrial fractions derived from gastrocnemius. T Quantification of LC3B-II, BNIP3, BNIP3L, PINK1, and PRKN from mitochondrial-enriched fractions. GAPDH and SOD2 shown as subcellular fraction controls. * p < 0.05 compared to P7 group. N = 4–8 mice per group
Fig. 3
Fig. 3
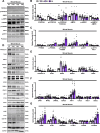
Quantitative analysis of upstream kinases and mitochondrial remodeling proteins in skeletal muscle during development. A Representative immunoblots of whole gastrocnemius lysate of mt-Keima mice. Ponceau stained membrane shown as loading control. B Quantitative analysis of FOXO3A, p-FOXO3A (Ser318/321), p-FOXO3A/FOXO3A, AMPK, p-AMPK (Thr172), and p-AMPK/AMPK. C Quantification of P70S6K, p-P70S6K (Thr421/424), p-P70S6K/P70S6K, AKT1, p-AKT1 (Thr308), and p-AKT1/AKT1. D Representative immunoblots of whole gastrocnemius lysate of mt-Keima mice. GAPDH shown as loading control. E Quantitative analysis of PPARGC1A, TFAM, BNIP3, BNIP3L, PINK1, and PRKN. F Quantification of OPA1, MFN2, DNM1L, VDAC1, ANT1, CYCS, SOD1, and SOD2. G Quantification of 4HNE, ATG7, SQSTM1, LC3B-I, LC3B-II, and LC3B-II:I. * p < 0.05 compared to P7. N = 6 mice per group
Fig. 4
Fig. 4
Developmental changes in skeletal muscles from Atg7f/f and Atg7f/f:Acta1−Cre mice. A Representative visualization of genotypes collected at P42. Quantification of B Body mass, relative skeletal muscle mass of C tibialis anterior (TA), D gastrocnemius, E quadriceps, and F triceps, and G peak forelimb grip strength. H Representative immunofluorescent images of TA muscle cross sections from P42 Atg7f/f and Atg7f/f:Acta1−Cre mice. Samples were stained with antibodies specific for individual MYH isoforms: type IIA (green), type IIX (red), type IIB (unstained), and dystrophin (DMD; red). Scale bars indicate 50 μm. I, J Quantification of mean cross-sectional area (CSA) and distribution of type IIA, IIX, and IIB fibers. * p < 0.05 compared to Atg7f/f group. N = 4–8 mice per group
Fig. 5
Fig. 5
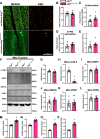
Postnatal development-associated changes in mitophagy and mitochondrial function in autophagy-deficient skeletal muscle. A Representative confocal images of mitophagic flux from longitutudinal TA muscle sections of Atg7f/f and Atg7f/f:Acta1−Cre mice crossed with mt-Keima reporter mice (mt-Keima:Atg7f/f and mt-Keima:Atg7f/f:Acta1−Cre). Green fluorescence indicates healthy mitochondria. Red fluorescence indicates degrading mitochondria. Scale bar indicates 50 μm. B Quantification of maximal oxygen consumption rate (i.e., respiration) of permeabilized bundles from TA muscle. Simultaneous quantification of C succinate-stimulated hydrogen peroxide (H2O2) production, and D succinate + pyruvate/malate-stimulated H2O2 production in permeabilized TA muscle bundles. E Quantification of mitochondrial fraction of electron leak. F Representative immunoblots of gastrocnemius mitochondrial fractions. SOD1 and SOD2 shown as subcellular fraction controls. G Quantification of oxidative phosphorylation (OXPHOS) coupling. Quantification of H LC3B-II, I BNIP3, J BNIP3L, K PINK1, and L PRKN from mitochondrial-enriched fractions. Quantification of M CASP9, N CASP3, O CAPN, and P 20S proteasome activity. * p < 0.05 compared to Atg7f/f group. N = 4–8 mice per group
Fig. 6
Fig. 6
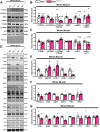
Quantitative analysis of upstream kinases and mitochondrial remodeling proteins in autophagy-deficient skeletal muscle. A Representative immunoblots of gastrocnemius lysate of Atg7f/f and Atg7f/f:Acta1−Cre mice. Ponceau stained membrane shown as loading control. B Quantitative analysis of FOXO3A, p-FOXO3A (Ser318/321), p-FOXO3A/FOXO3A, AMPK, p-AMPK (Thr172), and p-AMPK/AMPK. C Quantification of P70S6K, p-P70S6K (Thr421/424), p-P70S6K/P70S6K, AKT1, p-AKT1 (Thr308), and p-AKT1/AKT1. D Representative immunoblots of whole gastrocnemius lysate of Atg7f/f and Atg7f/f:Acta1−Cre mice. GAPDH shown as loading control. E Quantitative analysis of ATG7, SQSTM1, LC3B-I, LC3B-II, and LC3B-II:I. F Quantitative analysis of PPARGC1A, TFAM, BNIP3, BNIP3L, PINK1, and PRKN. G Quantitative analysis of OPA1, MFN2, DNM1L, VDAC1, ANT1, CYCS, SOD1, and SOD2, * p < 0.05 compared to Atg7f/f. N = 6 mice per group
Fig. 7
Fig. 7
Developmental changes in skeletal muscle of Atg7f/f and Atg7f/f:Acta1−Cre mice treated with either vehicle (VEH) or proteasome inhibitor MG132. A Representative visualization of Atg7f/f:Acta1−Cre mice treated with VEH or MG132 and collected at P42. B Quantification of 20S proteasome activity. Quantification of C Body mass, skeletal muscle mass of D tibialis anterior (TA), E gastrocnemius, F quadriceps, and G triceps, and H peak forelimb grip strength. I Representative immunofluorescent images of TA muscle cross sections from P42 Atg7f/f and Atg7f/f:Acta1−Cre mice. Samples were stained with antibodies specific for individual MYH isoforms: type IIA (green), type IIX (red), type IIB (unstained), and dystrophin (DMD; red). Scale bars indicate 50 μm. J, K Quantification of mean cross-sectional area (CSA) and distribution of type IIA, IIX, and IIB fibers. L Quantification of maximal oxygen consumption rate (i.e., respiration) of permeabilized bundles from TA muscle. Simultaneous quantification of M succinate-stimulated hydrogen peroxide (H2O2) production, and N succinate + pyruvate/malate-stimulated H2O2 production in permeabilized TA muscle bundles. Quantification of O mitochondrial fraction of electron leak and P oxidative phosphorylation (OXPHOS) coupling. Q Representative immunoblots of whole gastrocnemius lysate of Atg7f/f (P42) or Atg7f/f:Acta1−Cre (P42) mice treated with VEH or MG132. R Quantitative analysis of ubiquitin, 20S proteasome, USP14, VDAC1, ANT1, and CYCS. S Representative immunoblots of mitochondrial-enriched fraction from the gastrocnemius of Atg7f/f (P42) or Atg7f/f:Acta1−Cre (P42) mice treated with VEH or MG132. T Quantitative analysis of mitochondrial localized BAX, BCL2, and BAX:BCL2 ratio. U Quantification of CASP9, CASP3, and CAPN activity. * p < 0.05 compared to VEH group. N = 4–8 mice per group. Atg7f/f group data shown for visualization purposes only

Similar articles

References

    1. Buckingham M, Bajard L, Chang T, Daubas P, Hadchouel J, Meilhac S, et al. The formation of skeletal muscle: from somite to limb. J Anat. 2003;202:59–68. - PMC - PubMed
    1. Gattazzo F, Laurent B, Relaix F, Rouard H, Didier N. Distinct phases of postnatal skeletal muscle growth govern the progressive establishment of muscle stem cell quiescence. Stem Cell Rep. 2020;15:597–611. - PMC - PubMed
    1. Bachman JF, Chakkalakal JV. Insights into muscle stem cell dynamics during postnatal development. FEBS J. 2022;289:2710–22. - PMC - PubMed
    1. White RB, Biérinx A-S, Gnocchi VF, Zammit PS. Dynamics of muscle fibre growth during postnatal mouse development. BMC Dev Biol. 2010;10:21. - PMC - PubMed
    1. Gokhin DS, Ward SR, Bremner SN, Lieber RL. Quantitative analysis of neonatal skeletal muscle functional improvement in the mouse. J Exp Biol. 2008;211(Pt 6):837–43. - PubMed

Substances

LinkOut - more resources