. 2025 Aug 19;26(1):252.
doi: 10.1186/s13059-025-03722-3.

A message passing framework for precise cell state identification with scClassify2

Affiliations

A message passing framework for precise cell state identification with scClassify2

Wenze Ding et al. Genome Biol. .

Abstract

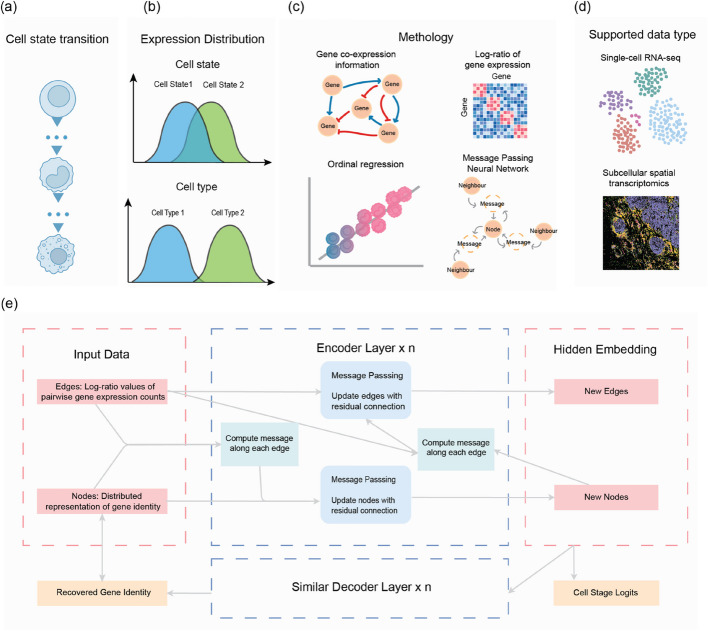
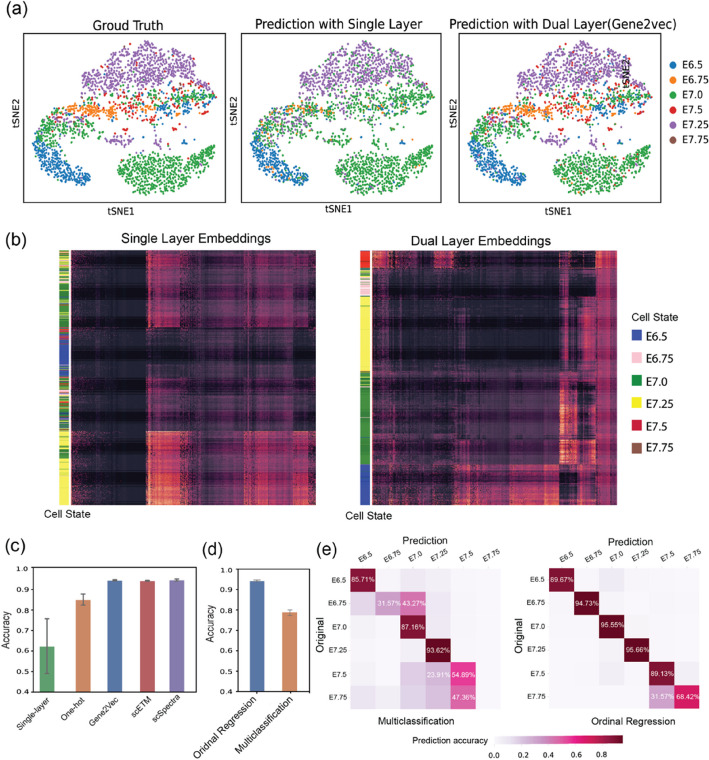
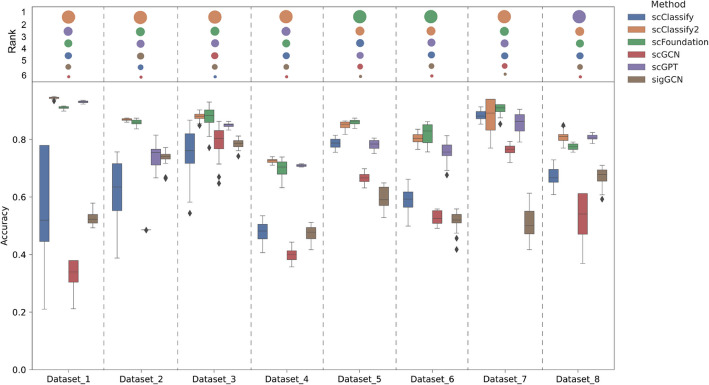
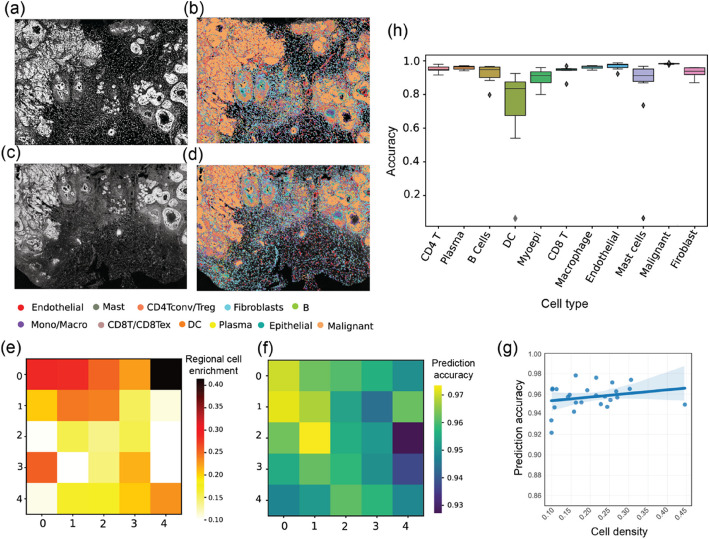
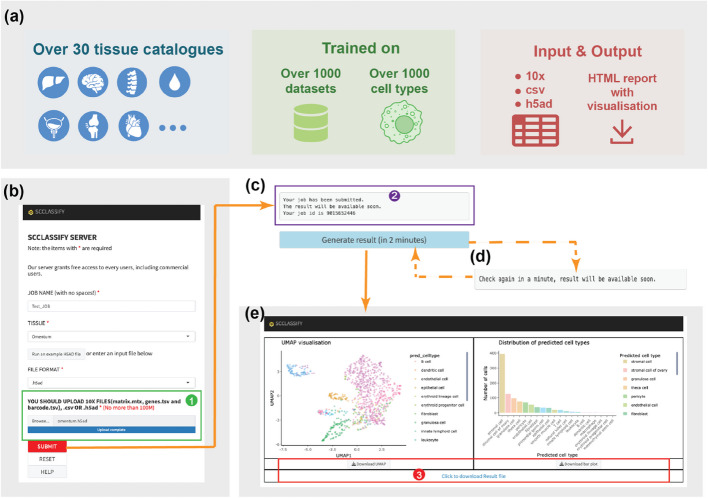
Cell annotation is crucial for downstream exploration. Although many approaches, spanning from classic statistics to large language models, have been developed, most of their focus is on distinct cell types and overlook sequential cell populations. Here, we propose an annotation method, scClassify2, to specifically focus on adjacent cell state identification. By incorporating prior biological knowledge through a novel dual-layer architecture and ordinal regression, scClassify2 achieves competitive performance compared to other state-of-the-art methods. Besides single-cell RNA-sequencing data, scClassify2 is generalizable from different platforms including subcellular spatial transcriptomics data. We also develop a web server for academic uses.

Keywords: Cell state identification; Dual layer architecture; MPNN; Ordinal regression; ScRNA-seq.


Conflict of interest statement

Declarations. Ethics approval and consent to participate: Not applicable. Competing interests: The authors declare no competing interests.

Figures

Fig. 1
Fig. 1
Overview of the scClassify2 framework for sequential cell state identification. a Linear cell state transformation is one of the most common and important phenomena in nature when external disturbance factors like signal molecules, drugs, or stresses occur. b Conceptual illustration of expression distribution difference between distinct cell types and adjacent cell states. c Brief illustration of our work. scClassify2 adapts stable log-ratio values of expression data and incorporates prior gene co-expression knowledge via a dual-layer graph neural network (MPNN) to capture the expression topology of cells and then identify them accurately with a novel ordinal regression component. d scClassify2 could be applied to not only the traditional scRNA-seq data but also sequencing data from subcellular spatial transcriptomics. e Brief illustration of the MPNN architecture adopted by scClassify2. Gene identities are encoded as nodes of the graph; meanwhile, the log-ratio of corresponding expression is encoded as edges. The model contains an encoder for topology capturing and a decoder for better learning
Fig. 2
Fig. 2
scClassify2 uses dual-layer architecture based on message-passing neural network. a tSNE plots of validation mouse gastrulation embryo dataset to show the prediction difference between single-layer architecture and dual-layer (with gene2vec). The left panel is annotated by ground truth. The middle and right panels are the predictions of single-layer and dual-layer architecture correspondingly. b Clustered cell embeddings captured by single-layer (left panel) and dual-layer (right panel) architecture correspondingly. In the heatmap, each row represents a cell, whose state is marked by the very left colored stripes. As we can see, cell embeddings obtained from dual-layer architecture show certain patterns which are highly correlated with corresponding cell states, while single-layer ones do not. c Comparison among single-layer using only gene expression data and dual-layer integrating different sources of prior biological knowledge. d Prediction accuracy comparison between classifiers of general multi-classification and specifically designed ordinal regression across various cell states. e Confusion matrices of predictions from different classifiers show more details
Fig. 3
Fig. 3
Performance comparison for eight different datasets. Comparison of model performance for 6 advanced approaches on 8 different sequential cell state datasets. Relative ranks of these methods on each dataset are presented at the top
Fig. 4
Fig. 4
Applicability of scClassify2 for SST data. scClassify2 could be directly applied on subcellular spatial transcriptomics (SST) data. ad The raw image and cell types identified by scClassify2 of human breast tissues, where a and b is replicate 1 while c and d stand for replica 2. eg We equally divided the vision into 25 regions to observe the annotation results of scClassify2. e Regional cell enrichment (how many cells in one specific region compared with the whole vision). f scClassify2’s prediction accuracy for each region. g The relationship between regional cell enrichment (x-axis) and scClassify2’s prediction accuracy (y-axis). h We also checked scClassify2’s precision for each cell type when applied to SST data
Fig. 5
Fig. 5
Overview of scClassify-catalogue—the web server. a A brief overview of our web server, scClassify-catalogue. b Homepage of scClassify-catalogue. The window for uploading expression profiles of query data is marked by a green rectangular (Box 1). After filling all necessary information in, click the “SUBMIT” button. c After submission, the waiting panel would pop up. The prompt window of the waiting panel is marked by a purple rectangular (Box 2). Job ID in this window is important for us to trace the backend activity of the user’s submission. Please wait enough time (usually less than 2 min) before clicking the “Generate result” button. d If the job has not been finished, another waiting panel would pop up. e The result page of the finished job. A UMAP of input data with annotations and a brief statistical bar plot of analysis results is available on this page. Downloadable and editable result table and analysis plot mentioned above could be reviewed by users (Box 3)

Similar articles

References

    1. Armingol E, Officer A, Harismendy O, Lewis NE. Deciphering cell-cell interactions and communication from gene expression. Nat Rev Genet. 2021;22:71–88. - PMC - PubMed
    1. Jovic D, Liang X, Zeng H, Lin L, Xu F, Luo Y. Single-cell RNA sequencing technologies and applications: A brief overview. Clin Transl Med. 2022;12: e694. - PMC - PubMed
    1. Papalexi E, Satija R. Single-cell RNA sequencing to explore immune cell heterogeneity. Nat Rev Immunol. 2018;18:35–45. - PubMed
    1. Stark R, Grzelak M, Hadfield J. RNA sequencing: the teenage years. Nat Rev Genet. 2019;20:631–56. - PubMed
    1. Stubbington MJT, Rozenblatt-Rosen O, Regev A, Teichmann SA. Single-cell transcriptomics to explore the immune system in health and disease. Science. 2017;358:58–63. - PMC - PubMed

LinkOut - more resources