Spatiotemporal dynamics and associated drivers of COVID-19 incidence in Nepal
- PMID: 40830992
- PMCID: PMC12362871
- DOI: 10.1186/s41182-025-00741-5
Spatiotemporal dynamics and associated drivers of COVID-19 incidence in Nepal
Abstract
Background: COVID-19 has been a major global health concern, severely impacting Nepal with thousands of cases and deaths. The patterns of COVID-19 incidence in the country may have varied over time during the pandemic, with geographic factors playing different roles in the early, middle, and later phases of transmission.
Methods: We utilized spatial statistics and GeoDetector methods to analyze district-level variations in COVID-19 incidence across Nepal from January 2020 to December 2022 using laboratory confirmed cases of the disease and a range of physical, biological and socioenvironmental explanatory variables. The analysis focused on identifying spatial patterns, hotspots, and key driving factors contributing to the uneven distribution of COVID-19 cases.
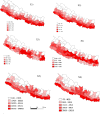
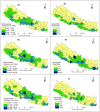
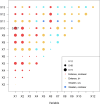
Results: We found an uneven distribution of COVID-19 in Nepal, with persistent hotspots in major cities, such as Kathmandu and Pokhara, reaching up to 133 cases per 1000 population. GeoDetector analysis identified the key drivers, including road density (q = 0.59, p < 0.001), ICU bed distribution (q = 0.51, p < 0.001), and population density (q = 0.46, p < 0.001). While natural environmental factors such as temperature, precipitation, and NDVI had low and statistically insignificant independent explanatory power, their interaction with variables such as nighttime light, NDVI, and population density enhanced explanatory strength, highlighting the complex spatial distribution of COVID-19 incidence.
Conclusions: We recommend that the Nepalese government implement more targeted and region-specific interventions to address COVID-19 outbreaks, especially in persistent hotspot areas, such as Kathmandu and other emerging cities.
Keywords: Epidemic hotspots; GeoDetector; Incidence rate; Spatial statistics; Targeted intervention.
© 2025. The Author(s).
Conflict of interest statement
Declarations. Ethics approval and consent to participate: Ethical approval is not applicable for this study as this study is based on publicly available secondary data and all the data were aggregated in district and month. No human subject was contacted for this study. Consent for publication: Not applicable. Competing interests: The authors declare no competing interests.
Figures


References
-
- WHO. WHO Director-General’s opening remarks at the media briefing on COVID-19 - 11 March 2020 [Internet]. 2020 [cited 2024 Jul 8]. Available from: https://www.who.int/director-general/speeches/detail/who-director-genera....
LinkOut - more resources
Full Text Sources
