. 2025 Aug;15(8):e70442.
doi: 10.1002/ctm2.70442.

The absence of IL17A favours cytotoxic cell function and improves antigen-specific immunotherapies in pancreatic adenocarcinoma

Affiliations

The absence of IL17A favours cytotoxic cell function and improves antigen-specific immunotherapies in pancreatic adenocarcinoma

Giorgia Tiberi et al. Clin Transl Med. 2025 Aug.

Abstract

Background and aims: The pancreatic tumour microenvironment (TME) is a complex ecosystem where tumour cells, cancer-associated fibroblasts and immune cells interact, often in ways that contribute to tumour growth. The role of interleukin (IL17)A in pancreatic cancer progression is now more defined, and it is known to sustain a pro-tumoural microenvironment and inhibit the immune response. Here, we explore the effect of combining IL17A depletion with a cancer vaccine to enhance anti-tumour immunity.

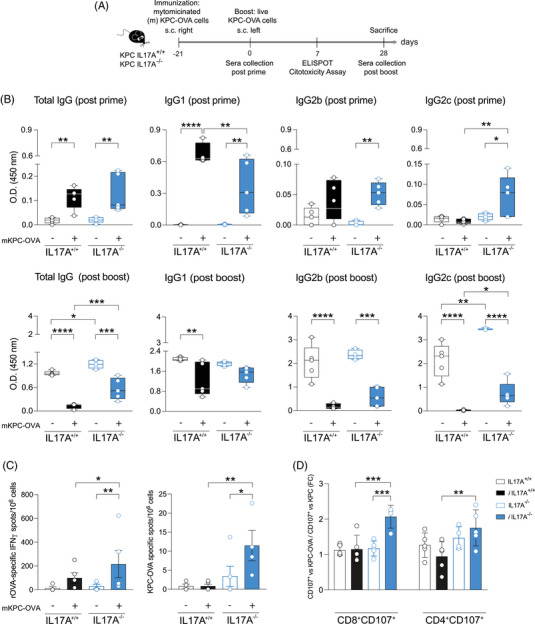
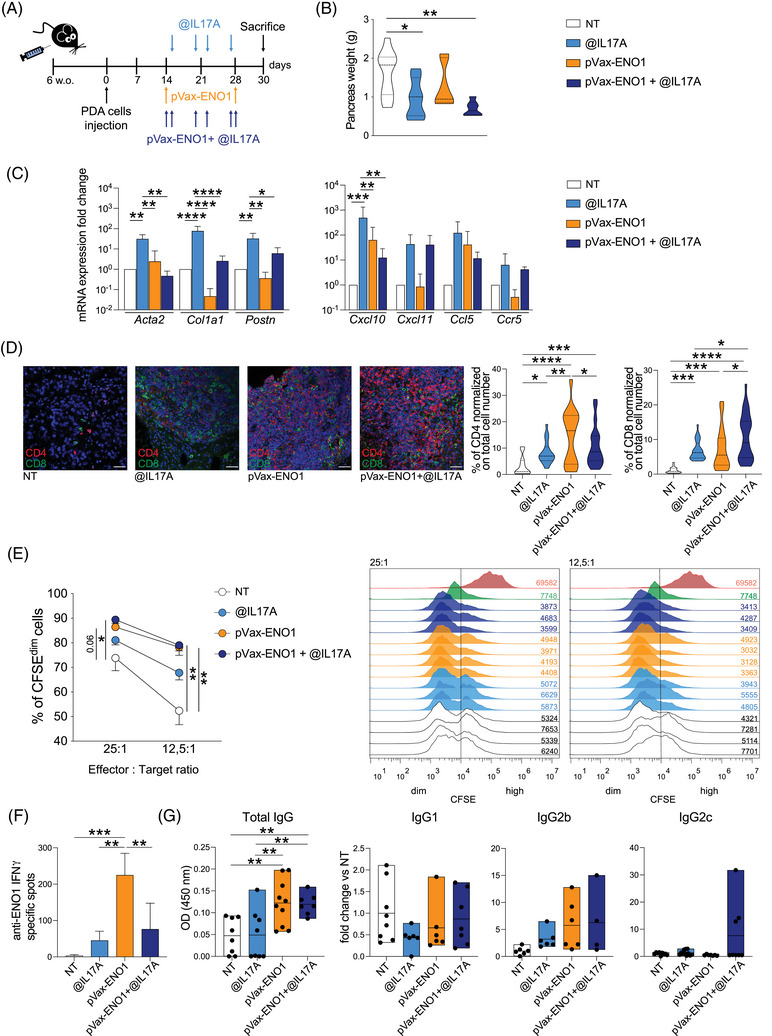
Methods: We used genetically engineered mice proficient or deficient in IL17A, and orthotopically injected mice with pancreatic tumour cells depleted or not in IL17A, to examine the vaccine effects on tumour growth and immune responses. Both humoral and cellular immune responses were analysed following vaccination in IL17A-deficient and control mice.

Results: Mice lacking IL17A-either genetically or through pharmacological depletion-exhibited prolonged survival and smaller tumours, compared to vaccinated controls. Vaccination in IL17A-deficient mice significantly increased the influx of immune cells, including Natural Killer (NK) and effector/memory CD8 T cells, which displayed higher cytotoxic activity. CD8 T-cell depletion in these models notably reduced vaccine efficacy, underscoring the essential role of these cells. NK cell depletion in untreated models further demonstrated NK cells' critical function in controlling tumour growth when IL17A was absent. Overall, IL17A depletion enhanced both antigen-specific humoral and cellular immune responses, indicating a shift towards a more robust and responsive immune environment.

Conclusions: Our findings reveal that the absence of IL17A in the pancreatic TME reprograms it into a more immune-supportive environment, favouring the recruitment of effector/memory immune cells upon vaccination. This approach paves the way for novel therapeutic combinations in pancreatic cancer, where IL17A depletion may boost both immunotherapy efficacy and anti-tumour responses.

Keywords: IL17A; cancer vaccine; humoral response; pancreatic cancer; tumour immune microenvironment.


Figures

FIGURE 1
FIGURE 1
IL17A affects antigen‐specific immune response. (A) Scheme of the experimental model (n = 5 mice/group). (B) Evaluation of specific anti‐ovalbumin (OVA) antibodies in the sera of immunised (filled pattern) and not (empty pattern) IL17A+/+ (black) and IL17A−/− (blue) mice before the injection of live KPC‐OVA cells (post‐prime, upper row) or at time of sacrifice (post‐boost, lower row). Total IgG, IgG1, IgG2b and IgG2c were measured through a direct enzyme‐linked immunosorbent assay (ELISA). Box and whiskers represent the min to max OD values ± SD; median is indicated; each dot represents a biological replicate. *p ≤ .0332, **p ≤ .0021, ***p ≤ .0002, ****p < .0001 (C) OVA‐specific IFN‐γ‐secreting cells (left graph) were evaluated from splenocytes isolated from immunised (filled pattern) and not (empty pattern) IL17A+/+ (black) and IL17A−/− (blue) mice and subtracted of spots obtained in the absence of stimuli. The number of IFN‐γ‐secreting cells was also measured after stimulation with KPC‐OVA cells (right graph) and subtracted of that evaluated in the presence of parental KPC cells. Data are represented as mean ± SD. *p ≤ .0332, **p ≤ .0021. (D) Degranulation activity was evaluated as CD107 positivity in CD8+ (left) and CD4+ (right) T cells isolated from spleens of immunised (filled pattern) and not (empty pattern) IL17A+/+ (black) and IL17A−/− (blue) mice and exposed to either KPC‐OVA or parental KPC cells. Data are represented as mean fold change ± SD of CD107 positivity in the presence of KPC‐OVA cells, compared to parental KPC cells **p ≤ .0021, ***p ≤ .0002.
FIGURE 2
FIGURE 2
The absence of IL17A further increases DNA vaccine efficacy in prolonging pancreatic ductal adenocarcinoma (PDA)‐bearing mouse survival. (A) Treatment protocol of KPC/IL17A+/+ (n = 10) or KPC/IL17A−/− (n = 12‐17) mice with ENO1 DNA vaccine. (B) Kaplan–Meier analysis of KPC/IL17A+/+ (black line) and KPC/IL17A−/− (blue line) mice vaccinated with an empty (dotted line) or ENO1‐expressing (continuous line) pVax vectors. Red dotted lines indicate the time points in which 50% and 31% of ENO1 vaccinated KPC/IL17A−/− mice were alive. (C) Splenocytes from pVax‐empty or pVax‐ENO1 vaccinated KPC/IL17A+/+ (black) and KPC/IL17A−/− (blue) mice (n = 6) were assessed for the specific secretion of IFN‐γ in response to syngeneic KPC cells or rENO1, both ex vivo (left graphs) and after 1 week of in vitro stimulation in the presence of rENO1 (right graphs) as indicated. rENO1 was used only for in vitro stimulation and not injected into mice. Columns represent the average ± SD of the number of specific spots from vaccinated splenocytes divided by those from non‐vaccinated ones. Each dot represents a pool of two mice. *p < .05, **p < .005 and ****p < .0001 (D) Specific anti‐ENO1 antibodies were evaluated by a direct ELISA with sera from KPC/IL17A+/+ (black) and KPC/IL17A−/− (blue) mice (n = 6‐8) vaccinated with pVax‐empty (empty pattern) or pVax‐ENO1 (filled pattern) vectors. Floating bars represent values from min to max ± SD; median is indicated. *p ≤ .0332, **p ≤ .002. (E) Anti‐ENO1 IgG1, IgG2b and IgG2c subclasses were evaluated by direct ELISA with sera from pVax‐empty (empty pattern) or pVax‐ENO1 vaccinated (filled pattern) KPC/IL17A+/+ (black) and KPC/IL17A−/− (blue) mice. Data are represented as fold change of each serum over the mean value of the relative untreated control for both genotypes. Floating bars indicate the range from the minimum to the maximum ± SD; median is shown. Each dot represents technical replicates of n = 3–6 sera. **p ≤ .0021, ***p ≤ .0002. (F) Anti‐ENO1 IgG1, IgG2b, and IgG2c subclasses in the sera from untreated mice, expressed as fold change of each serum over the mean value of sera from the untreated KPC/IL17A+/+ mice. Floating bars indicate the range from the minimum to the maximum ± SD; median is shown. Each dot represents technical replicates of n = 3–6 sera. *p ≤ .0332, ***p ≤ .0002 indicate significant differences between KPC/IL17A−/− (blue) and KPC/IL17A+/+ (black) sera. (G) Flow cytometry analysis of splenocytes from pVax‐empty (empty pattern) or pVax‐ENO1 vaccinated (filled pattern) KPC/IL17A+/+ (black) and KPC/IL17A−/− (blue) mice (n = 4‐5). Bars represent the average ± SD of the ratio or percentage of positive cells stained for markers indicated in the y‐axis. Each dot represents a pool of 2–3 biological replicates. Outliers are removed after running ROUT analysis. *p ≤ .0332, **p ≤ .0021.
FIGURE 3
FIGURE 3
The absence of IL17A strongly impacts the heterogeneous immune landscape induced by the ENO1‐DNA vaccine. (A–C) Percentage of PDA‐infiltrating myeloid cells (A), regulatory T cells (B) and effector/memory CD4+ and CD8+ T cells (C) in tumours from ENO1‐vaccinated (filled columns) or not (empty columns) KPC/IL17A+/+ (black columns) or KPC/IL17A−/− (blue columns) mice (n = 3–6) evaluated through flow cytometry. Markers on the y‐axis title define the different subpopulations. Columns represent the average number ± SEM. *p ≤ .0332, **p ≤ .0021, ***p ≤ .0002. (D) Spatial transcriptomic analysis of OCT‐embedded pancreatic tissues from ENO1‐vaccinated KPC/IL17A+/+ (left) and KPC/IL17A−/− (right) mice: cell clusters are depicted on the tissue samples; colors indicate different cell types as reported in the legend. (E) Pie charts showing percentages of cell subtypes in vaccinated KPC/IL17A+/+ (left) and KPC/IL17A−/− (right) tissues. (F) Differentially expressed genes are depicted in the volcano plot. Blue dots represent transcripts increased and white dots those decreased in IL17A−/− tumours. (G) Quantification of B cells (left), CD8+ T cells (middle), and NK cells (right) that are either co‐localised (black) or not co‐localised (white) with the x‐axis–indicated cell type, based on cell counts per spot (as shown in panel D), in tumours from ENO1‐vaccinated KPC mice that are IL17A‐proficient (+) or ‐deficient (–). *p < .05 and ***p < .0001.
FIGURE 4
FIGURE 4
IL17A absence allows the activation of CD8+ T cells by an anti‐cancer vaccine. (A) Splenocytes from pVax‐ENO1 vaccinated or not KPC/IL17A+/+ (white) or KPC/IL17A−/− (blue) mice (n = 3) were co‐cultured with spheroids generated with syngeneic KPC cells for 48 h. Truncated violin plots represent measurement of spheroid invasion of the surrounding matrix at Day2 vs. Day0. The right part of the graph reports data obtained with splenocytes from mice depleted of CD8+ T cells. *p ≤ .0332, **p ≤ .0021, ***p ≤ .0002, ****p < .0001. Not‐significant differences (ns) are reported. (B) Truncated violin plots show the percentage of tumour in KPC/IL17A+/+ (white) or KPC/IL17A−/− (blue) mice (n = 6–8) treated or not with an anti‐NK1.1 antibody. *p ≤ .0332, **p ≤ .0021. Not‐significant differences (ns) are reported. (C) Truncated violin plots show the tumour weight of C57BL/6 IL17A+/+ (white) and IL17A−/− (blue) mice (n = 7–9) vaccinated or not with pVax‐ENO1 and depleted of CD8+ T cells. *p ≤ .0332, **p ≤ .0021, ***p ≤ .0002, ****p < .0001. Not‐significant differences (ns) are reported. (D) Truncated violin plots show the tumour weight of C57BL/6 IL17A+/+ (white) and KPC/IL17A−/− (blue) mice (n = 5–9) vaccinated or not with pVax‐ENO1 and depleted or not of CD4+ T cells. *p ≤ .0332, **p ≤ .0021, ***p ≤ .0002, ****p < .0001. Not‐significant differences (ns) are reported. (E) Truncated violin plots show the percentage of tumour in KPC/IL17A+/+ (white) or KPC/IL17A−/− (blue) mice (n = 8–10) depleted of CD8+ T cells (dashed pattern) and vaccinated or not with pVax‐ENO1. *p ≤ .0332 (f) Kaplan–Meier analysis of KPC/IL17A+/+ (black lines) and KPC/IL17A−/− (blue lines) mice depleted of CD8+ T cells and vaccinated with pVax‐ENO1 (dotted lines) or not (continuous lines). Representative H&E‐stained pancreatic sections are shown with tumour (T) and healthy (H) areas indicated. Scale bar is 100 µm.
FIGURE 5
FIGURE 5
Orthotopic model confirms the effects of the IL17A pharmacological depletion. (A) Scheme of combined therapy in mice injected orthotopically with syngeneic KPC cells. (B) Pancreas weight was evaluated from mice receiving the different treatments (= 8–12). Truncated violins represent min to max values ± SD. *p ≤ .0332, **p ≤ .0021. (C) Stromal‐ (left graph) and T‐cell activation‐ (right graph) related transcripts were evaluated by Quantitative real‐time polymerase chain reaction (qRT‐PCR) from formalin‐fixed and paraffin‐embedded tissues (n = 4–6). Columns represent mean ± SD. *p ≤ .0332, **p ≤ .0021, ***p ≤ .0002, ****p < .0001. (D) Representative immunofluorescence pictures of CD4+ and CD8+ T cells infiltrating tumours from mice receiving the indicated treatments (n = 4–5). Truncated violin plots represent quantification of CD4+ (left) and CD8+ (right) T cells in five representative fields for each mouse. *p ≤ .0332, **p ≤ .0021, ***p ≤ .0002, ****p < .0001. Scale bar is 50 µm. (E) Percentage of PDA CFSEdim cells (left graph) 4 h after their co‐culture with splenocytes (25:1 and 12,5:1 E:T ratios) from mice receiving the indicated treatments (n = 3–4). The overlaid histograms (right graphs) represent the PDA CFSEhi (right of the line) and CSFEdim (left of the line) in the positive (pink peak) and negative (green peak) controls and in cells co‐cultured with splenocytes from individual mice receiving the different treatments. Data from the two different E:T ratios are represented, with a geometric mean of fluorescence indicated in the histograms. *p ≤ .0332, **p ≤ .0021. One representative of two independent experiments is shown. (F) IFN‐γ‐secreting splenocytes isolated from mice of each treatment group (n = 5) were stimulated in the presence or absence of rENO1 in Enzyme‐Linked ImmunoSPOT (ELISpot) plates. Columns represent the average number ± SD of specific spots evaluated in the presence of rENO1 and subtracted of those evaluated when splenocytes were cultured in medium only. **p ≤ .0021, ***p ≤ .0002. (G) Anti‐ENO1 total IgG, IgG1, IgG2b and IgG2c subclasses were measured through a direct ELISA with sera from mice receiving the different treatments. For IgG1, IgG2b and IgG2c subclasses data are represented as fold change of each serum over the mean value of the untreated serum group. Floating bars represent min to max values ± SD; median is indicated. Each circle represents technical replicates of mouse sera (n = 5). Outliers are removed after running ROUT analysis. **p ≤ .0021.

References

    1. Siegel RL, Giaquinto AN, Jemal A. Cancer statistics, 2024. CA Cancer J Clin. 2024;74:12‐49. - PubMed
    1. Kamisawa T, Wood LD, Itoi T, et al. Pancreatic cancer. Lancet. 2016;388:73‐85. - PubMed
    1. Zeng S, Pöttler M, Lan B, et al. Chemoresistance in pancreatic cancer. Int J Mol Sci. 2019;20:4504. - PMC - PubMed
    1. Mucciolo G, Roux C, Scagliotti A, et al. The dark side of immunotherapy: pancreatic cancer. CDR. 2020;3(3):491‐520. - PMC - PubMed
    1. Marin‐Acevedo JA, Soyano AE, Dholaria B, et al. Cancer immunotherapy beyond immune checkpoint inhibitors. J Hematol Oncol. 2018;11:8. - PMC - PubMed

LinkOut - more resources