[Preprint]. 2025 Aug 13:rs.3.rs-7166564.
doi: 10.21203/rs.3.rs-7166564/v1.

Novel Papain-Elastase Induced Murine Model for Infrarenal Abdominal Aortic Aneurysm Rupture

Affiliations

Novel Papain-Elastase Induced Murine Model for Infrarenal Abdominal Aortic Aneurysm Rupture

Mohamed Zayed et al. Res Sq. .

Abstract

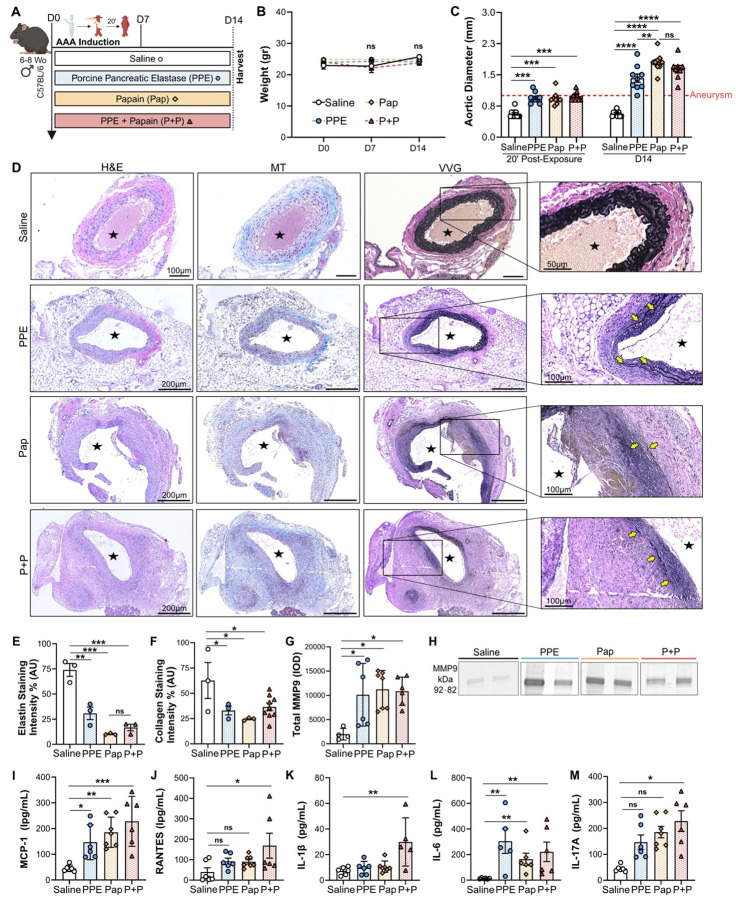
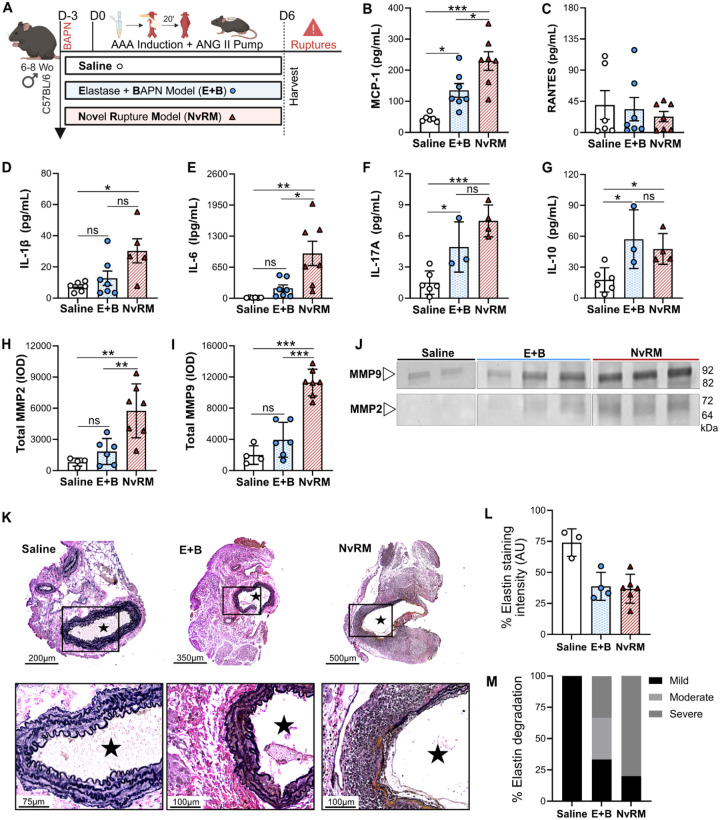
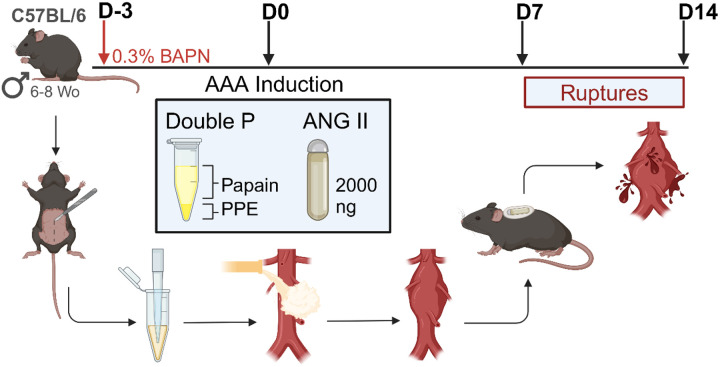
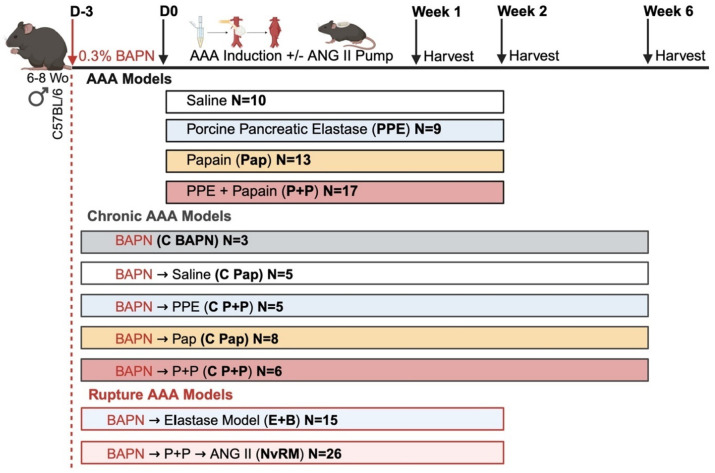
Abdominal aortic aneurysm (AAA) rupture leads to high morbidity and mortality. Current rodent models struggle to reliably mimic infrarenal AAA rupture. Chemical treatments using porcine pancreatic elastase (PPE), papain (Pap), β-aminopropionitrile (BAPN), and angiotensin II (ANG II) are known to induce AAA in rodents. We hypothesized that combining these agents could establish reliable chronic AAA and acute rupture models, resembling human pathology. Here AAAs were induced in male C57BL/6 mice using peri-adventitial exposure to PPE, Pap, or a combination (PPE + Pap), with or without 0.3% BAPN and ANG II. Two weeks post-induction, Pap and PPE + Pap showed increased aortic diameters, higher inflammation, elastase degradation, and matrix metallopeptidase (MMP) activity. Addition of BAPN resulted in large chronic AAAs (500% growth) and intraluminal thrombus (ILT) formation. ANG II-treated mice exhibited a 93% rupture rate, increased inflammation, MMP activation, and ILT formation. These novel murine models are ideal for investigating AAA pathophysiology and therapeutic discovery.


Conflict of interest statement

Conflict of Interest: The authors declare no relevant conflicts of interest.

Figures

Figure 1
Figure 1. Day 14 AAA formation following peri-adventitial aortic exposure to papain-elastase.
(A) Mice underwent exposure to either saline (N=10), PPE (N=9), Pap (N=13) or PPE+Pap (N=17) to assess AAA formation. (B) Body weight assessment in grams at days 0, 7 and 14 post-AAA development. (C) Aortic diameter evaluation in mm, at day 0 (20 minutes post-exposure) and at day 14 (post-AAA development). Aneurysms were defined by a size greater than 1 mm (50% increase from baseline measurements). (D) H&E, MT and VVG staining of abdominal aortas (cross-section of tissue slides) with 5x and 10x magnification. (E) Quantification of AAA elastin and (F) collagen fibers via staining intensity (arbitrary units, AU). (G) Quantification of total MMP-9 levels via integrated density (IOD). (H) Zymogram demonstrating total MMP-9 activity band. Chemokines (I) MCP-1 and (J) RANTES and pro-inflammatory markers (K) IL-1β, (L) IL-6 and (M) IL-17A content within the AAA tissue measured by ELISA. Star indicates the aortic lumen. Yellow arrows indicate the elastin fibers. Data are presented as mean ± standard deviation (SD). Ns>0.005, *p<0.05, **p<0.01, ***p<0.001 using either one-way ANOVA, two-way ANOVA with multiple comparison, or student’s t-test when applicable.
Figure 2
Figure 2. Chronic model of AAA progression using daily BAPN administration over 6 weeks.
(A) Mice received BAPN through drinking water starting 3 days prior to AAA induction and continuing until week 6. Mice were also exposed to either saline (N=5), PPE (N=5), papain (N=8) or PPE+Pap (N=6) to promote AAA development. (B) Aortic diameter evaluation in millimeters at day 0 (20 minutes post-exposure) and at day 42 (post-AAA development). Aneurysms were defined by a size greater than 1 mm (50% increase from baseline measurements). (C) Kaplan-Meier curve demonstrating rate of survival following AAA induction. (D) Variable impact of chemically induced AAA development on aortic diameter 6 weeks post-AAA development (E) H&E, Masson trichrome (MT) and VVG staining of abdominal aortas (cross-section of tissue slides) with 5x and 10x magnification. The star represents the lumen of the artery. ILT = Intraluminal thrombus. IHC categorical analysis (F) Degree of inflammation, (G) VSMC loss in percent and (H) elastin degradation. (I) Quantification of AAA elastin and (J) collagen fibers via staining intensity (arbitrary units, AU). Data are presented as mean ± standard deviation (SD). Ns>0.005, *p<0.05, **p<0.01, ***p<0.001 using either one-way ANOVA, two-way ANOVA with multiple comparison, or student’s t-test when applicable.
Figure 3
Figure 3. Novel Rupture Model (NvRM) in C57BL Mice.
(A) Mice underwent exposure to a new combination of papain-elastase (PPE+Pap), BAPN and ANG II subcutaneous pump to assess AAA development and rupture. (B) Kaplan-Meier curve demonstrating rate of survival following AAA induction. 93% (13/14) of the NvRM group of mice developed AAA rupture. (C) Representative AAA rupture into the left retroperitoneum, associated organs and retroperitoneal hematoma identified with the arrows. (D) H&E and VVG staining of the thoracic and abdominal aortas (cross-section of tissue slides) with 5x and 20x magnification. Star = lumen, yellow arrows = cell infiltration and elastin fibers, Big yellow arrow = intraluminal thrombus formation.
Figure 4
Figure 4. Impact of inflammation and matrix metalloproteinases at day 6 in NvRM.
(A) Mice underwent exposure to either saline, elastase and BAPN (E+B) or papain-elastase (PPE+Pap), BAPN and ANG II subcutaneous pump (NvRM), to assess AAA inflammation and matrix metalloproteinases at day 6, prior to AAA rupture events. Chemokines (B) MCP-1 and (C) RANTES and pro-inflammatory markers (D) IL-1β, (E) IL-6, (F) IL-17A and (G) IL-10 content within the AAA tissue measured by ELISA. (H) Quantification of total MMP-2 and (I) total MMP-9 levels via integrated density (IOD). (J) Zymogram demonstrating total MMP-9 and MMP-2 activity bands. (K) VVG staining, (L) quantification and (M) qualitative analysis of the abdominal aortas (cross-section of tissue slides) with 5x and 20x magnification. Star = lumen. Data are presented as mean ± standard deviation (SD). Ns>0.005, *p<0.05, **p<0.01, ***p<0.001 using either one-way ANOVA or student’s t-test when applicable.
Figure 5
Figure 5. Novel Rupture Model (NvRM) of AAA development and rupture in mice.
Synergistic combination of porcine pancreatic elastase (PPE), papain (Pap) β-aminopropionitrile (BAPN) and angiotensin II (ANG II) in C57BL/6 mice. Figure was made using BioRender.com.
Figure 6
Figure 6
Summary of the methodology to model development to study AAA creation and rupture.

Similar articles

References

    1. Carino D., Sarac T. P., Ziganshin B. A. & Elefteriades J. A. Abdominal Aortic Aneurysm: Evolving Controversies and Uncertainties. International Journal of Angiology vol. 27 58–80 Preprint at 10.1055/s-0038-1657771 (2018). - DOI - PMC - PubMed
    1. Sakalihasan N., Limet R. & Defawe O. D. Abdominal aortic aneurysm. Lancet vol. 365 1577–1589 Preprint at 10.1016/S0140-6736(05)66459-8 (2005). - DOI - PubMed
    1. Nordon I. M., Hinchliffe R. J., Loftus I. M. & Thompson M. M. Pathophysiology and epidemiology of abdominal aortic aneurysms. Nature Reviews Cardiology vol. 8 92–102 Preprint at 10.1038/nrcardio.2010.180 (2011). - DOI - PubMed
    1. Kent K. C. et al. Analysis of risk factors for abdominal aortic aneurysm in a cohort of more than 3 million individuals. J Vasc Surg 52, 539–548 (2010). - PubMed
    1. Moll F. L. et al. Management of abdominal aortic aneurysms clinical practice guidelines of the European society for vascular surgery. European Journal of Vascular and Endovascular Surgery 41, (2011). - PubMed

Publication types

LinkOut - more resources