. 2025 Aug 4:16:1601847.
doi: 10.3389/fimmu.2025.1601847. eCollection 2025.

The age of obesity onset affects changes in subcutaneous adipose tissue macrophages and T cells after weight loss

Affiliations

The age of obesity onset affects changes in subcutaneous adipose tissue macrophages and T cells after weight loss

Jessica Murphy et al. Front Immunol. .

Abstract

Introduction: Adipose tissue inflammation, driven in part by immune cells, may contribute to the elevated type 2 diabetes risk in adults with childhood-onset obesity (CO) compared to those with adult-onset obesity (AO). Weight loss can modify adipose tissue immune cell composition, but whether these changes differ by obesity onset remains unknown.

Methods: We compared abdominal and femoral subcutaneous adipose tissue (SAT) immune cell percentages between people with CO and AO before and after moderate (~10%) weight loss. We collected abdominal and femoral SAT from females with CO or AO before (CO: n=14; AO: n=13) and after (CO: n=8; AO: n=6) diet- and exercise-induced weight loss. We used flow cytometry to quantify the percentages of macrophages and T cells in the stromovascular fraction of both SAT regions.

Results: Abdominal CD68+CD206- 'pro-inflammatory' macrophages were slightly higher in AO than CO at baseline but declined in AO only, equalizing between groups after weight loss. Femoral CD68+CD206- macrophages, as well as abdominal and femoral CD68+CD206+ 'anti-inflammatory' macrophages and CD3+CD8+ T cells, did not differ between groups at baseline or change after weight loss. Abdominal and femoral CD3+CD4+ T cells-potentially pro- or anti-inflammatory-increased after weight loss in AO but remained unchanged in CO.

Discussion: Our findings, though preliminary, do not support the hypothesis that SAT immune cell profiles account for the elevated type 2 diabetes risk in CO. Weight loss appears to alter some immune cell populations in AO but not in CO. The long-term metabolic consequences of these changes-or lack thereof-remain to be determined.

Keywords: T cells; adipokines; age of onset; inflammation; macrophages; obesity; subcutaneous adipose tissue; weight loss.


Conflict of interest statement

MT has received speaker honoraria from Boehringer-Ingelheim, AstraZeneca, Janssen, Novo Nordisk, and Eli Lilly. The remaining authors declare that the research was conducted in the absence of any commercial or financial relationships that could be construed as a potential conflict of interest.

Figures

Figure 1
Figure 1
Subclinical cardiometabolic risk factors in females with childhood-onset and adult-onset obesity before and after moderate weight loss. (A, B) Subclinical cardiometabolic risk factors by group over time. The outcome was natural log-transformed in (A) prior to analysis but is displayed as back-transformed values. Results are presented as least-squares means (95% CI). In (A), time, p = 0.016: baseline > final. In (B), time, p = 0.001: baseline > final. cfPWV, carotid-femoral pulse wave velocity (arterial stiffness); AO, group with adult-onset obesity; CO, group with childhood-onset obesity.
Figure 2
Figure 2
Plasma proinflammatory adipokine concentrations in females with childhood-onset and adult-onset obesity before and after moderate weight loss. (A–F) Plasma proinflammatory adipokine concentrations by group over time. The outcomes were natural log-transformed in (A–D) prior to analysis but are displayed as back-transformed values. Results are presented as least-squares means (95% CI). In (A), time, p < 0.001: baseline > final. In (D), time, p = 0.016: baseline > final. AO, group with adult-onset obesity; CO, group with childhood-onset obesity; IL, interleukin; MCP-1, monocyte chemoattractant protein-1; PAI-1, plasminogen activator inhibitor-1.
Figure 3
Figure 3
Adiponectin concentrations in plasma and regional subcutaneous adipose tissue-conditioned media from females with childhood-onset and adult-onset obesity before and after moderate weight loss. Adiponectin concentration in plasma (A) and subcutaneous adipose tissue-conditioned media (B) by group over time. The outcome was natural log-transformed in (B) prior to analysis but is displayed as back-transformed values. Results are presented as least-squares means (95% CI). In (B), time, p = 0.032: baseline < final. AO, group with adult-onset obesity; CO, group with childhood-onset obesity.
Figure 4
Figure 4
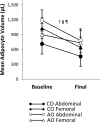
Regional subcutaneous adipocyte size in females with childhood-onset and adult-onset obesity before and after moderate weight loss. Adipocyte size by group and subcutaneous adipose tissue region over time. Results are presented as least-squares means (95% CI). time, p = 0.005; §region-by-onset, p < 0.001; group-by-region-by-time, p = 0.004: group-by-time in Abdominal region, p = 0.454 (across time: CO < AO, p = 0.001; across groups: baseline > final, p = 0.004); group-by-time in Femoral region, p = 0.331 (across time: CO = AO, p = 0.867; across groups: baseline > final, p = 0.021); group-by-region at baseline, p < 0.001 (CO: Abdominal < Femoral, p = 0.002; AO: Abdominal > Femoral, p = 0.005); group-by-region at final, p = 0.049 (CO: Abdominal < Femoral, p = 0.021; AO: Abdominal = Femoral, p = 0.547). AO, group with adult-onset obesity; CO, group with childhood-onset obesity.
Figure 5
Figure 5
Regional subcutaneous adipose tissue macrophage populations in females with childhood-onset and adult-onset obesity before and after moderate weight loss. (A) Representative flow cytometry plots of macrophage populations. In each plot, the top left quadrant shows CD68+CD206- macrophages, and the top right quadrant shows CD68+CD206+ macrophages. (B, C) Macrophage populations by group and subcutaneous adipose tissue region over time. Outcomes were natural log-transformed prior to analysis but are displayed as back-transformed values. Results are presented as least-squares means (95% CI). In (B), *region, p = 0.024; group-by-region-by-time, p = 0.076: group-by-time in Abdominal region, p = 0.402 (across time: CO = AO, p = 0.537; across groups: baseline > final, p = 0.045); group-by-time in Femoral region, p = 0.748 (across time: CO = AO, p = 0.428; across groups: baseline = final, p = 0.076); group-by-region at baseline, p = 0.166 (across groups: Abdominal > Femoral, p = 0.013); group-by-region at final, p = 0.215 (across groups: Abdominal = Femoral, p = 0.106). Although these two-way interactions cannot fully explain the three-way interaction, simple contrasts indicated that the regional difference (Abdominal > Femoral) at baseline and the change in the Abdominal region (baseline > final) occurred in AO and not in CO. These contrasts correspond with the graphical depiction showing that the change over time was less parallel for CO and AO in the Abdominal region compared to the Femoral region. AO, group with adult-onset obesity; CO, group with childhood-onset obesity; SVC = stromovascular cells.
Figure 6
Figure 6
Regional subcutaneous adipose tissue T-cell populations in females with childhood-onset and adult-onset obesity before and after moderate weight loss. (A) Representative flow cytometry plots of T-cell populations. In each plot, the top left gate shows CD3+CD8+ T cells, and the lower right gate shows CD3+CD4+ T cells. (B, C) T-cell populations by group and subcutaneous adipose tissue region over time. Results are presented as least-squares means (95% CI). In (B), *region, p = 0.001: Abdominal < Femoral. In (C), #group, p = 0.043; *region, p < 0.001: Abdominal < Femoral; group-by-time, p = 0.004 (across regions at baseline: CO = AO, p = 0.843; across regions in CO: baseline = final, p = 0.063; across regions in AO: baseline < final, p = 0.025; across regions at final: CO < AO, p = 0.004). AO, group with adult-onset obesity; CO, group with childhood-onset obesity; SVC, stromovascular cells.

Similar articles

References

    1. Singh AS, Mulder C, Twisk JWR, Van Mechelen W, Chinapaw MJM. Tracking of childhood overweight into adulthood: a systematic review of the literature: Tracking of childhood overweight into adulthood. Obes Rev. (2008) 9:474–88. doi: 10.1111/j.1467-789X.2008.00475.x, PMID: - DOI - PubMed
    1. Singer K, Lumeng CN. The initiation of metabolic inflammation in childhood obesity. J Clin Invest. (2017) 127:65–73. doi: 10.1172/JCI88882, PMID: - DOI - PMC - PubMed
    1. Luo J, Hodge A, Hendryx M, Byles JE. Age of obesity onset, cumulative obesity exposure over early adulthood and risk of type 2 diabetes. Diabetologia. (2020) 63:519–27. doi: 10.1007/s00125-019-05058-7, PMID: - DOI - PubMed
    1. Zheng Y, Song M, Manson JE, Giovannucci EL, Hu FB. Group-based trajectory of body shape from ages 5 to 55 years and cardiometabolic disease risk in 2 US cohorts. Am J Epidemiol. (2017) 186:1246–55. doi: 10.1093/aje/kwx188, PMID: - DOI - PMC - PubMed
    1. Yacamán-Méndez D, Trolle-Lagerros Y, Zhou M, Monteiro Ponce de Leon A, Gudjonsdottir H, Tynelius P, et al. Life-course trajectories of weight and their impact on the incidence of type 2 diabetes. Sci Rep. (2021) 11:12494. doi: 10.1038/s41598-021-91910-z, PMID: - DOI - PMC - PubMed