. 2025 Aug 4:16:1621513.
doi: 10.3389/fpls.2025.1621513. eCollection 2025.

Extended photoperiod improves growth and nutritional quality of pak choi under constant daily light integral

Affiliations

Extended photoperiod improves growth and nutritional quality of pak choi under constant daily light integral

Kartika R Susilo et al. Front Plant Sci. .

Abstract

Introduction and aim: The duration of light exposure each day, termed the photoperiod, is a crucial environmental cue that influence several aspects of plant physiology, including growth, development, and metabolic activity. Adjusting the photoperiod in controlled agriculture systems has the potential to improve crop yield and nutritional content. However, the benefits of longer photoperiods compared to higher light intensities under a fixed daily light integral (DLI) have not been thoroughly examined for many leafy vegetables. DLI is the total amount of light a plant receives per day and it is the product of photoperiod and light intensity. This study aimed to determine to what extent the effect of DLI on pak choi (Brassica rapa L. subsp. chinensis) growth, yield and quality depends on whether DLI is changed by light intensity (PPFD) or by photoperiod.

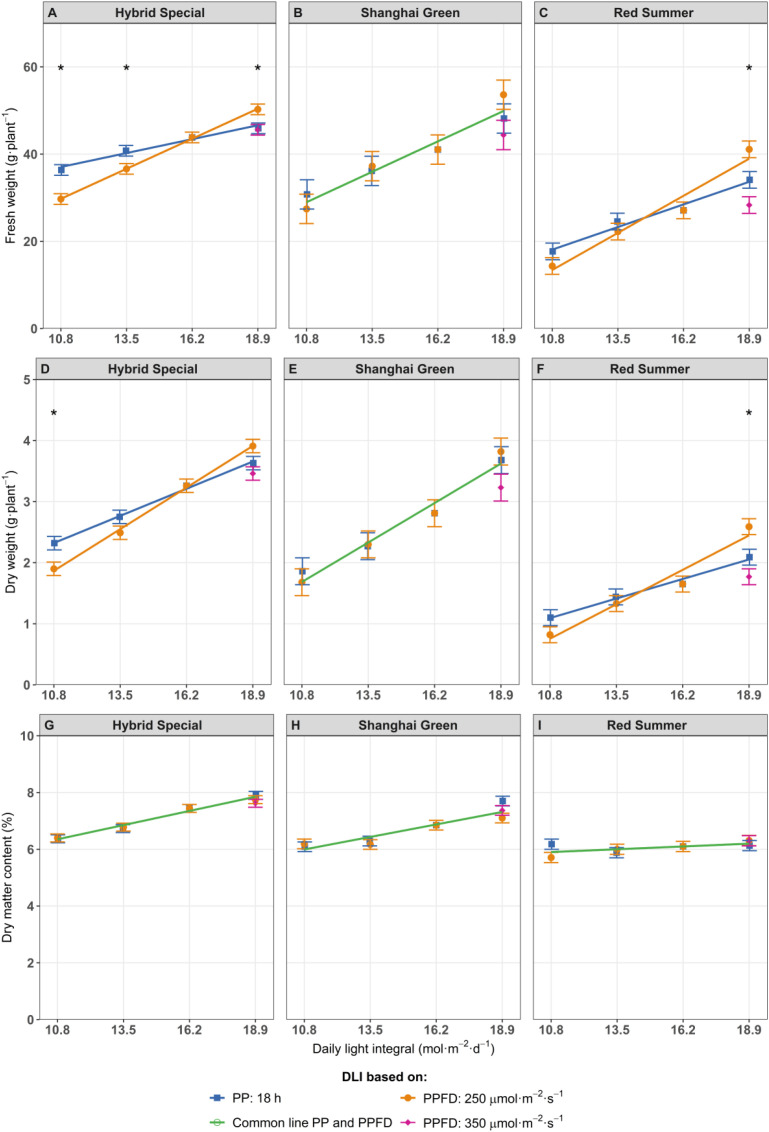
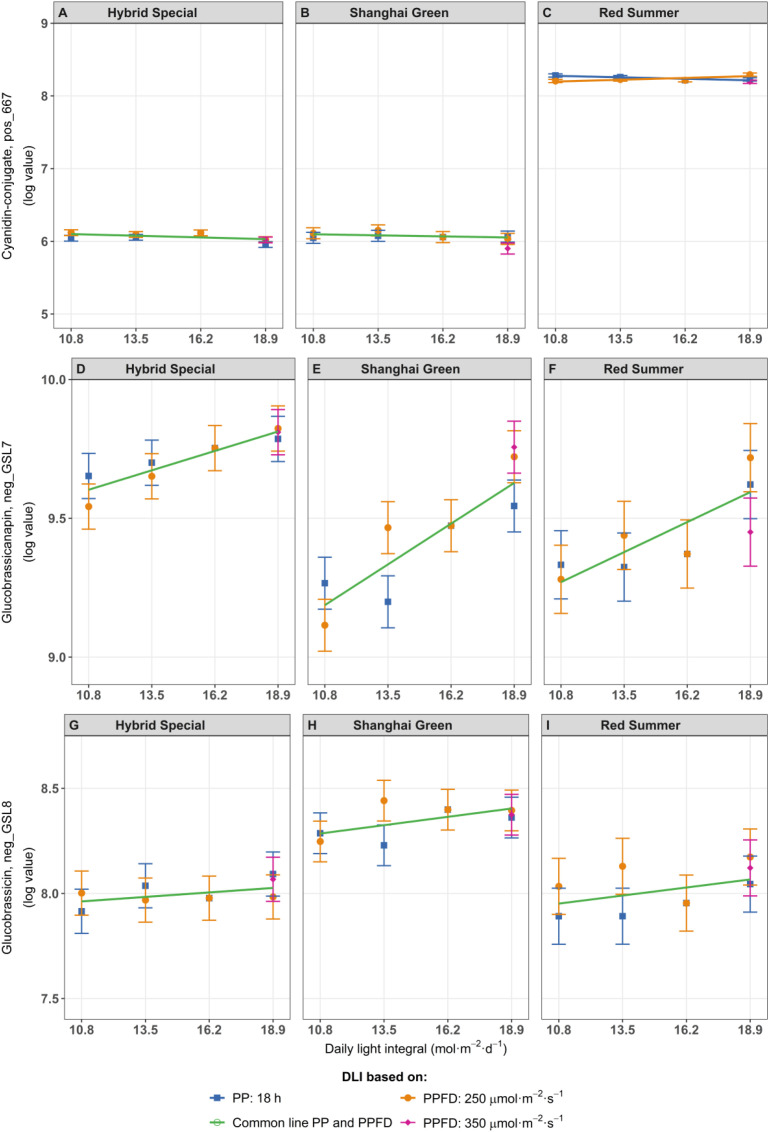
Methods: Three cultivars ('Hybrid Special', 'Red Summer', and 'Shanghai Green') were grown under four different DLIs (10.8, 13.5, 16.2, and 18.9 mol m-2 d-1). These DLIs were achieved either by varying the photoperiod (12, 15, 18 and 21 hours) at a constant PPFD 250 µmol m-2 s-1 or by varying the PPFD (167, 208, 250, and 292 µmol m-2 s-1) at a constant photoperiod (18 hours).

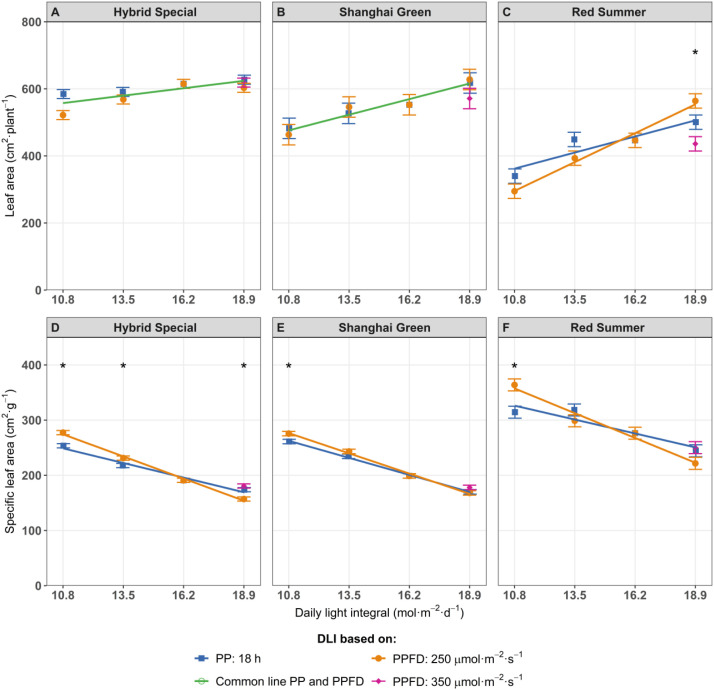
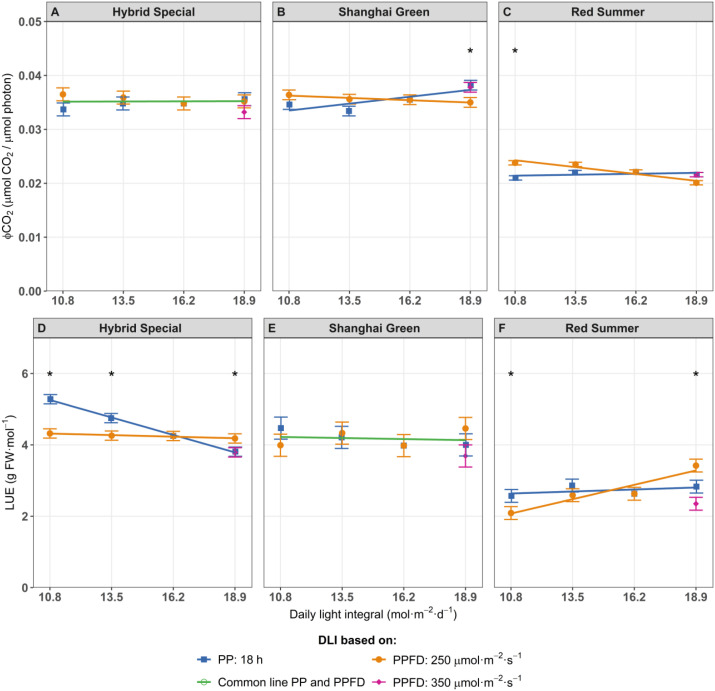
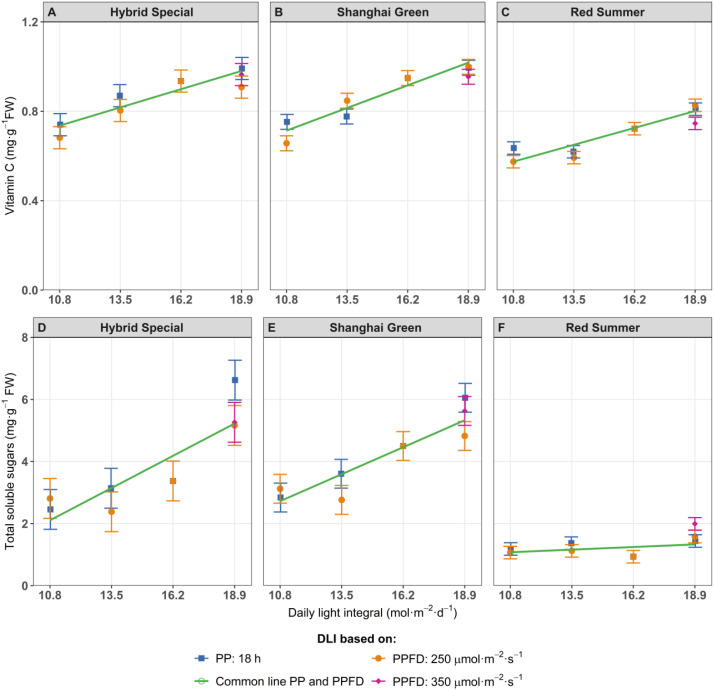
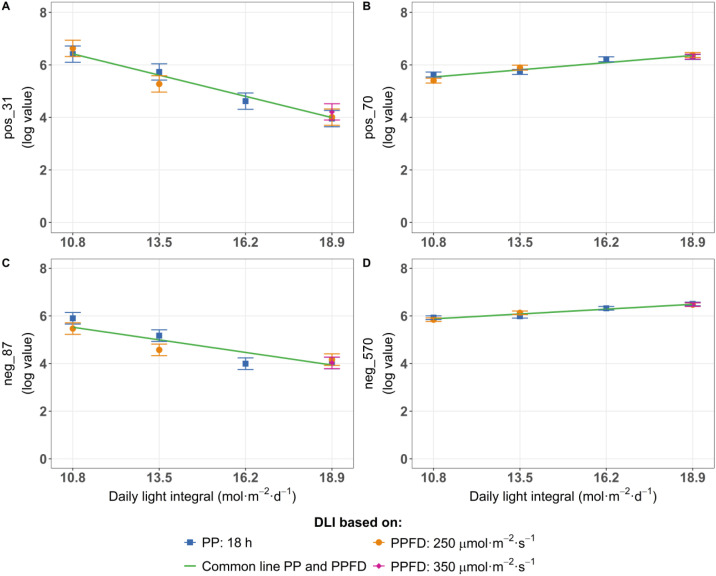
Results: Increasing DLI by extending the photoperiod resulted in more growth than increasing DLI by increasing PPFD. Photoperiod extension also generally resulted in higher light use efficiency and energy use efficiency than increasing DLI by increasing PPFD. The content of vitamin C, glucosinolates and many other metabolites increased significantly with higher DLI regardless whether DLI was increased through PPFD or photoperiod. However, DLI did not affect shelf life and overall visual quality.

Discussion: These results suggest that extending photoperiod is a more effective strategy than increasing light intensity for optimizing leafy vegetable production in controlled environments.

Keywords: LUE; PSM; light intensity; pak choi; photoperiod; sole LED lights; vitamin C.


Conflict of interest statement

The authors declare that the research was conducted in the absence of any commercial or financial relationships that could be construed as a potential conflict of interest. The author(s) declared that they were an editorial board member of Frontiers, at the time of submission. This had no impact on the peer review process and the final decision.

Figures

Figure 1
Figure 1
Fresh weight (A–C), dry weight (D–F), and dry matter content (G–I) of pak choi cultivars ‘Hybrid Special’ (A, D, G), ‘Shanghai Green’ (B, E, H), and ‘Red Summer’ (C, F, I) after four weeks of cultivation under red-blue-white LED light with eight different combinations of photoperiod and PPFD, resulting in four different daily light integrals (DLI). The DLI was increased by increasing PPFD (range 167–292 µmol m-2 s-1) at a constant photoperiod of 18 h (blue line) or by increasing photoperiod (range 12–21 hours) at a constant PPFD of 250 µmol m-2 s-1 (orange line). Purple diamond represents a third treatment at highest DLI, combining 350 µmol m-2 s-1 with 15 h photoperiod. Green line represents one common relationship with DLI, no difference between DLI increase obtained by increased PPFD or by increased photoperiod. Asterisks (*) indicate significant differences within the same DLI according to Fisher's protected LSD test at P = 0.05. Error bars represent the standard error of the mean.
Figure 2
Figure 2
Leaf area (A–C), and specific leaf area (D–F), of pak choi cultivars ‘Hybrid Special’ (A, D), ‘Shanghai Green’ (B, E), and ‘Red Summer’ (C, F) after four weeks of cultivation under red-blue-white LED light with eight different combinations of photoperiod and PPFD, resulting in four different daily light integrals (DLI). The DLI was increased by increasing PPFD (range 167–292 µmol m-2 s-1) at a constant photoperiod of 18 h (blue line) or by increasing photoperiod (range 12–21 hours) at a constant PPFD of 250 µmol m-2 s-1 (orange line). Purple diamond represents a third treatment at highest DLI, combining 350 µmol m-2 s-1 with 15 h photoperiod. Green line represents one common relationship with DLI, no difference between DLI increase obtained by increased PPFD or by increased photoperiod. Asterisks (*) indicate significant differences within the same DLI according to Fisher's protected LSD test at P = 0.05.. Error bars represent the standard error of the mean.
Figure 3
Figure 3
The quantum yield of CO2 assimilation (ΦCO2) (A–C), and Light Use Efficiency of fresh weight (D–F), of pak choi cultivars ‘Hybrid Special’ (A, D), ‘Shanghai Green’ (B, E), and ‘Red Summer’ (C, F) after four weeks of cultivation under red-blue-white LED light with eight different combinations of photoperiod and PPFD, resulting in four different daily light integrals (DLI). The DLI was increased by increasing PPFD (range 167–292 µmol m-2 s-1) at a constant photoperiod of 18 h (blue line) or by increasing photoperiod (range 12–21 hours) at a constant PPFD of 250 µmol m-2 s-1 (orange line). Purple diamond represents a third treatment at highest DLI, combining 350 µmol m-2 s-1 with 15 h photoperiod. Green line represents one common relationship with DLI, no difference between DLI increase obtained by increased PPFD or by increased photoperiod. Asterisks (*) indicate significant differences within the same DLI according to Fisher's protected LSD test at P = 0.05. Error bars represent the standard error of the mean.
Figure 4
Figure 4
Vitamin C (A–C) and total soluble sugar (D–F) of pak choi cultivars ‘Hybrid Special’ (A, D), ‘Shanghai Green’ (B, E), and ‘Red Summer’ (C, F) after four weeks of cultivation under red-blue-white LED light with eight different combinations of photoperiod and PPFD, resulting four different daily light integrals (DLI). The DLI was increased by increasing PPFD (range 167–292 µmol m-2 s-1) at a constant photoperiod of 18 h (blue line) or by increasing photoperiod (range 12–21 hours) at a constant PPFD of 250 µmol m-2 s-1 (orange line). Purple diamond represents a third treatment at highest DLI, combining 350 µmol m-2 s-1 with 15 h photoperiod. Green line represents one common relationship with DLI, no difference between DLI increase obtained by increased PPFD or by increased photoperiod. Asterisks indicate significant differences within the same DLI according to Fisher’s protected LSD test at P = 0.05. Error bars represent the standard error of the mean.
Figure 5
Figure 5
Log-transformed values of Cyanidin 3-(6-malonylglucoside)-feruloylglucoside-sinapoylglucoside (cyanidin-conjugate pos_667) (A–C), glucobrassicanapin (D–F) and glucobrassicin (G–I) as main glucosinolates in pak choi cultivars ‘Hybrid Special’ (A, D, G), ‘Shanghai Green’ (B, E, H), and ‘Red Summer’ (C, F, I) after four weeks of cultivation under red-blue-white LED light with eight different combinations of photoperiod and PPFD, resulting in four different daily light integrals (DLI). The DLI was increased by increasing PPFD (range 167–292 µmol m-2 s-1) at a constant photoperiod of 18 h (blue line) or by increasing photoperiod (range 12–21 hours) at a constant PPFD of 250 µmol m-2 s-1 (orange line). Purple diamond represents a third treatment at highest DLI, combining 350 µmol m-2 s-1 with 15 h photoperiod. Green line represents one common relationship with DLI, no difference between DLI increase obtained by increased PPFD or by increased photoperiod. Asterisks indicate significant differences within the same DLI according to Fisher’s protected LSD test at P = 0.05. Error bars represent the standard error of the mean.
Figure 6
Figure 6
Log-transformed values of untargeted metabolites showing a negative correlation (< -0.8) across all three replicates (A, C) or a positive correlation (> 0.8) across all three replicates (B, D) with daily light integral (DLI) in pak choi ‘Shanghai Green’ determined after four weeks of cultivation under red-blue-white LED light. DLI either increased by increasing PPFD (range 167–292 µmol m-2 s-1) at a constant photoperiod of 18 h (blue symbol) or by increasing photoperiod (range 12–21 hours) at a constant PPFD of 250 µmol m-2 s-1 (orange symbol). Purple diamond represents a third treatment at highest DLI, combining 350 µmol m-2 s-1 with 15 h photoperiod. Green line connects average values for each DLI. Error bars represent the standard error of the mean.
Figure 7
Figure 7
PCA of pak choi samples from three cultivars grown with increasing DLI intensity based on the variation in relative abundance of 1,591 compounds detected by the untargeted LCMS-based metabolomics approach. HS: ‘Hybrid Special’ (colored green). RS: ‘Red Summer’ (colored red) and ‘Shanghai Green’ (colored blue) after four weeks of cultivation under red-blue-white LED light with eight different combinations of photoperiod and PPFD, resulting four different daily light integrals (DLI; indicated in the sample codes).
Figure 8
Figure 8
PCA of pak choi cultivar ‘Shanghai Green’ (SG) samples based on the variation in relative abundance of 1,591 compounds detected by the untargeted LCMS-based metabolomics approach. Plants were grown for four weeks under red-blue-white LED light at eight different combinations of photoperiod and light intensity, resulting four different daily light integrals (DLI). The circles enclose the four groups of samples exposed to the same DLI: 10.8 mol m-2 d-1 (red), 13.5 mol m-2 d-1 (brown), 16.2 mol m-2 d-1 (green) and 18.9 mol m-2 d-1 (yellow).

Similar articles

References

    1. Ahamed M. S., Sultan M., Monfet D., Rahman M. S., Zhang Y., Zahid A., et al. (2023). A critical review on efficient thermal environment controls in indoor vertical farming. J. Cleaner Production 425, 138923. doi: 10.1016/j.jclepro.2023.138923 - DOI
    1. Avgoustaki D. D., Xydis G. (2020). Plant factories in the water-food-energy Nexus era: A systematic bibliographical review. Food Secur. 12, 253–268. doi: 10.1007/s12571-019-01003-z - DOI
    1. Bakir S., Hall R. D., De Vos R. C. H., Mumm R., Kadakal Ç., Capanoglu E. (2023). Effect of drying treatments on the global metabolome and health-related compounds in tomatoes. Food Chem. 403, 134123. doi: 10.1016/j.foodchem.2022.134123, PMID: - DOI - PubMed
    1. Barta D., Tibbitts T. (2000). Calcium localization and tipburn development in lettuce leaves during early enlargement. J. Am. Soc. Hortic. Science. Am. Soc. Hortic. Sci. 125, 294–298. doi: 10.21273/JASHS.125.3.294, PMID: - DOI - PubMed
    1. Birlanga V., Acosta-Motos J. R., Pérez-Pérez J. M. (2021). Genotype-dependent tipburn severity during lettuce hydroponic culture is associated with altered nutrient leaf content. Agronomy 11. doi: 10.3390/agronomy11040616 - DOI

LinkOut - more resources