[Preprint]. 2025 Sep 24:2025.08.13.665980.
doi: 10.1101/2025.08.13.665980.

Novel Predictive Spatial Biomarker in Non-Small Cell Lung Carcinoma: The Diversity of Niches Unlocking Treatment Sensitivity (DONUTS)

Affiliations

Novel Predictive Spatial Biomarker in Non-Small Cell Lung Carcinoma: The Diversity of Niches Unlocking Treatment Sensitivity (DONUTS)

Tricia R Cottrell et al. bioRxiv. .

Abstract

Probabilistic spatial modelling techniques developed on large-scale tumor-immune Atlases (~35M individually mapped cells; 50,000 high power fields) were used to characterize predictive features of treatment-responsive lung cancer. We identified CD8+FoxP3+ cell density as a robust pre-treatment biomarker for outcomes across disease stages and therapy types. In parallel, single-cell RNAseq studies of CD8+FoxP3+ T-cells revealed an activated, early effector phenotype, substantiating an anti-tumor role, and contrasting with CD4+FoxP3+ T-regulatory cells. A spatial biomarker was developed using an empirical probabilistic model to define the immediate cell neighbors or niche surrounding CD8+FoxP3+ cells and proximity to the tumor-stromal boundary. The resultant 'Diversity of Niches Unlocking Treatment Sensitivity (DONUTS)' are more prevalent than the CD8+FoxP3+ cells themselves, mitigating sampling error in small biopsies. Further, the DONUTS only require four markers, are additive to PD-L1, and associate with tertiary lymphoid structure counts. Taken together, the DONUTS represent a next-generation predictive biomarker poised for clinical implementation.

Keywords: AstroPath; CD8+FoxP3+; NSCLC; PD-1; biomarker; immunotherapy; lung cancer; neighborhood; pathology; spatial.


Conflict of interest statement

D.M.P. reports other support from Aduro Biotech, Amgen, Bayer, Camden Partners, DNAtrix, Dracen, Dynavax, FLX Bio, Immunomic, Janssen, Merck, Rock Springs Capital, Potenza, Tizona, Trieza, and WindMil during the conduct of the study; grants from Astra Zeneca, Medimmune/Amplimmune, and Compugen; grants and other support from Bristol-Myers Squibb, ERvaxx, and Potenza; personal fees from AbbVie, Avidity Nanomedicines, ImaginAb, Immunocore, and Merck; and personal fees and nonfinancial support from Five Prime Therapeutics and Dragonfly Therapeutics. J.S.D. reports consulting for NextPoint; J.M.T. reports grants and consulting from Bristol-Myers Squibb and consulting for Merck, Astra Zeneca, Moderna, Roche, NextPoint, Elephas, Regeneron, and Compugen outside the submitted work; J.M.T. and A.S.S. report equipment, reagents, and stock options from Akoya Biosciences and a patent pending related to image processing of mIF/IHC images. J.M.T., A.S.S., B.F.G., J.S.R., L.L.E. report a patent pending related to spatial predictors of response to therapy which has been licensed by Quanterix. J.M.T., A.S.S, and J.R. also report institutional grant funding from Quanterix. K.N.S. has received travel support/honoraria from Illumina, Inc., receives research funding from Bristol-Myers Squibb, Anara, and Astra Zeneca, and owns founder’s equity in Clasp Therapeutics, LLC. P.M.F. receives research support from AstraZeneca, Bristol-Myers Squibb, Novartis, and Kyowa, and has been a consultant for AstraZeneca, Amgen, Bristol-Myers Squibb, Daichii Sankyo, and Janssen and serves on a data safety and monitoring board for Polaris. J.E.C. reports trial funding provided to her institution by Astra Zeneca, Bristol Myers Squibb, Boehringer Ingelheim, Genentech, Lilly, Merck, BioNTech; and consulting fees from Astra Zeneca, Boehringer Ingelheim, Janssen, Genentech/Roche, Guardant Health, Lilly, Merck, Natera, Nuvation Bio.

Figures

Figure 1.
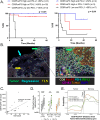
Figure 1.. CD8+FoxP3+ cell densities predict patient outcomes to therapy in both the neoadjuvant and advanced NSCLC treatment settings.
(A) Study schematic summarizing patient cohorts, tumor tissue specimens, high powered fields (HPFs), and single cells mapped using the AstroPath platform. (B) Heatmap of pre-treatment cell density AUC values for prediction of major pathologic response to neoadjuvant anti-PD-1-based therapy. (C) Boxplots showing the comparison of total pre-treatment CD8+FoxP3+ cell densities between MPR and non-MPR (regardless of PD-1 and PD-L1 status) as well as the select subsets by PD-(L)1 status with the highest AUCs. Boxplots of the other cell lineage densities (CD163+ macrophages, CD8+ T-cells, conventional T-regs, tumor) as they relate to MPR are shown in Figure S2B–E. (D) Pre-treatment CD8+FoxP3+ cell densities stratify (left) RFS in patients with early-stage NSCLC treated with neoadjuvant anti-PD-1-based therapy (Cohort 1) as well as (middle) OS in patients with advanced, pre-treated NSCLC receiving anti-PD-1 therapy (Cohort 2) and (right) chemotherapy (Cohort 4). Cohort 3 did not have survival data available. OS for Cohort 1 and PFS for Cohorts 2 and 4 are shown in Figure S2F–H. (* p < 0.05) MPR: Major pathologic response; RFS: recurrence free survival; OS: overall survival.
Figure 2.
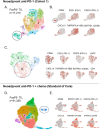
Figure 2.. CD8+FoxP3+ cell density is additive to PD-L1, indicative of TLS, and increases during anti-PD-1 treatment response.
(A) Kaplan-Meier plots of (left) OS in Cohort 1 and (right) OS in Cohort 2 demonstrate enhanced patient stratification by combined assessment of pre-treatment tumor PD-L1 expression and CD8+FoxP3+ T-cell densities. (B) (Left) An on-treatment mIF TME map with annotations outlining residual tumor (green), regression bed (i.e. where tumor used to be prior to treatment, blue) of a patient who experienced a major pathologic response (≤10% residual viable tumor). TLS (yellow) are readily identified in the TME, and many are remote from where the residual tumor is located. (Right) A high magnification image of the tumor-stromal boundary illustrates a dense immune cell population immediately adjacent and infiltrating the residual tumor cells (orange), including a mixture of CD8+ cytotoxic T cells (yellow), CD8+FoxP3+ cells (yellow and red, see inset), FoxP3+ regulatory T cells (red), and CD163+ macrophages (purple). (C) Correlation of CD8+FoxP3+ cell counts with TLS in on-treatment resection specimens from Cohort 1. (D) CD8+FoxP3+ cell densities are significantly increased following neoadjuvant therapy regardless of pathologic response status. Shown here are those with a partial pathologic response (≤50% RVT) vs. those >50% RVT, with a trend towards higher densities in patients with a deeper pathologic response (p=0.087). (E) Probability distribution of spatial localization of CD8+FoxP3+ cells relative to the tumor-stromal boundary. Relative to pre-treatment tumors (gray), CD8+FoxP3+ cells infiltrate the tumor epithelium in on-treatment specimens with at least partial pathologic response (≤50% RVT, green), while these cells are largely confined to the peritumoral stroma in on-treatment tumors with >50% RVT (orange). (** p < 0.005, *** p < 0.0005). TLS: tertiary lymphoid structures; RVT: residual viable tumor
Figure 3:
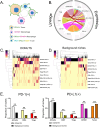
Figure 3:. Tumor infiltrating CD8+FoxP3+ T-cells have an activated, cytotoxic phenotype in patients treated with anti-PD-1+/−chemotherapy.
(A) Single-cell RNA sequencing-derived UMAP of the expression profiles of the FoxP3+ TIL, resulting in 11 unique immune cell subsets (Cohort 1, see also Figure S3). (B) UMAP overlay of expression of select genes indicates antigen-specific activation of the CD8+FoxP3+ subset (C) Subclustering of CD8+FoxP3+ cells in cluster 5 further highlights the CXCL13 expression in CD8+CD4-FoxP3+ T-cells. (D-E) UMAP clustering and expression overlays of scRNAseq data from FoxP3+ TIL from patients receiving neoadjuvant combination chemo-immunotherapy as standard of care. A similar transcriptional program consistent with antigen-specific activation is identified in the CD8+ cluster of FoxP3+ TIL (circled, see also Figure S4). TIL: tumor infiltrating lymphocytes.
Figure 4.
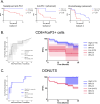
Figure 4.. CD8+FoxP3+ T-cells localize to a T-cell enriched immunoactive niche near the tumor-stromal boundary.
(A) Schematic and photomicrograph showing the ring or donut-like arrangement of immediate contact neighbors of CD8+FoxP3+ cells. (B) Probability distribution of spatial localization of each cell lineage relative to the tumor-stromal boundary in pre-treatment biopsies from Cohort 1 shows that CD8+FoxP3+ cells, like CD8+ cells and Tregs, are most concentrated in the stroma in close proximity to the tumor-stromal interface. (C) Schematic of an immunoactive niche derived from the CD8+FoxP3+ cell niche, but without the requirement of a central cell, resulting in a ring or a donut-shaped cellular arrangement. The probability model defined the subset of these niches predictive of treatment response, termed ‘DONUTS’ – the Diversity Of Niches Unlocking Treatment Sensitivity. (D) ROC curves for predicting MPR in Cohort 1 based on pre-treatment densities of (i) CD8+FoxP3+ cells, (ii) DONUTS centered on CD8+FoxP3+ cells, (iii) DONUTS centered on non-CD8+FoxP3+ cells, and (iv) all DONUTS. (E) Heat map showing the localization of DONUTS to the tumor-stromal boundary in a representative pre-treatment NSCLC biopsy. (F) Pie charts comparing the cellular composition of the DONUTS relative to non-predictive background niches. (G) Boxplots comparing the proportions of each cell lineage in the background TME vs. the DONUTS, which mirror the composition observed around actual CD8+FoxP3+ T-cells (Figure S5). (*** p < 0.0005; ns: not significant).
Figure 5.
Figure 5.. DONUTS are enriched in co-localized cells expressing PD-1 and PD-L1.
(A) Composite representation of the spatial model showing the cells present in at least 50% of the DONUTS. (B) Chord diagram showing the proportional expression of PD-1 and PD-L1 for each cell lineage within the DONUTS. (C-D) Heat maps depicting hierarchical clustering of niches by composition, including cellular subsets defined by lineage markers and PD-1 or PD-L1 expression. DONUTS are enriched in PD-L1+/− macrophages, PD-L1+tumor cells, and PD-1+CD8+ T cells. Non-predictive, background TME niches are dominated by tumor cells, including PD-L1+ and (−) subsets. (E) The proportion of PD-1+CD8+ T cells and T-regs, as well as PD-L1+CD8+ T cells, T-regs, and CD163+ macrophages are significantly enriched in the DONUTS relative to background TME niches. (**p<0.005)
Figure 6.
Figure 6.. The DONUTS model is a spatial, pre-treatment biomarker that predicts patient outcomes to therapy in both the neoadjuvant and advanced disease settings.
(A) Pre-treatment DONUTS densities stratify RFS in patients with early-stage NSCLC treated with neoadjuvant anti-PD-1-based therapy (Cohort 1) as well as OS in patients with advanced, pre-treated NSCLC receiving anti-PD-1 therapy (Cohort 2) and chemotherapy (Cohort 4). Also see Figure S6 for OS for Cohort 1 and PFS for Cohorts 2 and 4. Statistical errors on ROC and KM curves show the impact of analyte abundance biomarker performance of (B) CD8+FoxP3+ T-cells themselves vs. (C) DONUTS.

References

    1. Forde P.M., Spicer J., Lu S., Provencio M., Mitsudomi T., Awad M.M., Felip E., Broderick S.R., Brahmer J.R., Swanson S.J., et al. (2022). Neoadjuvant Nivolumab plus Chemotherapy in Resectable Lung Cancer. N Engl J Med 386, 1973–1985. 10.1056/NEJMoa2202170. - DOI - PMC - PubMed
    1. Cascone T., Awad M.M., Spicer J.D., He J., Lu S., Sepesi B., Tanaka F., Taube J.M., Cornelissen R., Havel L., et al. (2024). Perioperative Nivolumab in Resectable Lung Cancer. N Engl J Med 390, 1756–1769. 10.1056/NEJMoa2311926. - DOI - PubMed
    1. Wakelee H., Liberman M., Kato T., Tsuboi M., Lee S.H., Gao S., Chen K.N., Dooms C., Majem M., Eigendorff E., et al. (2023). Perioperative Pembrolizumab for Early-Stage Non-Small-Cell Lung Cancer. N Engl J Med 389, 491–503. 10.1056/NEJMoa2302983. - DOI - PMC - PubMed
    1. Heymach J.V., Harpole D., Mitsudomi T., Taube J.M., Galffy G., Hochmair M., Winder T., Zukov R., Garbaos G., Gao S., et al. (2023). Perioperative Durvalumab for Resectable Non-Small-Cell Lung Cancer. N Engl J Med 389, 1672–1684. 10.1056/NEJMoa2304875. - DOI - PubMed
    1. Pardoll D.M. (2012). The blockade of immune checkpoints in cancer immunotherapy. Nat Rev Cancer 12, 252–264. 10.1038/nrc3239. - DOI - PMC - PubMed

Publication types