[Preprint]. 2025 Oct 20:2025.08.13.669778.
doi: 10.1101/2025.08.13.669778.

Temporal Clonal Tracing Reveals Tumor-Intrinsic IFNγ-Dependencies Driving Niche Adaptation and Early Metastatic Colonization

Affiliations

Temporal Clonal Tracing Reveals Tumor-Intrinsic IFNγ-Dependencies Driving Niche Adaptation and Early Metastatic Colonization

Emilija Aleksandrovic et al. bioRxiv. .

Abstract

Metastasis is an emergent continuum, driven by evolving reciprocal adaptations between continuously disseminating tumor cells (DTCs) and the specialized metastatic niches of distant organs. The interplay between intrinsic and niche-driven mechanisms that enables DTCs to survive and home to distant organs remains incompletely understood. Here, using MetTag, a single-cell barcoding and transcriptome profiling approach with time-stamped batch identifiers (BC.IDs) and functional CRISPR screening, we resolved the clonality, temporal dynamics, and molecular determinates of DTC colonization success across evolving metastatic niches. Deep sequencing of barcodes revealed preferred enrichment of early-disseminated clones across metastatic niches. Single-cell RNA sequencing (scRNA-seq) coupled with RNA velocity analyses in ascites and metastasis-bearing omenta uncovered an emergent and distinct interferon-gamma (IFNγ) centric transcriptional trajectory, enriched among early seeding clones. In vivo CRISPR/Cas9 screening of metastatic niche-specific signatures demonstrated that genes belonging to the IFNγ response are functionally important for peritoneal metastasis. Knockout of IFNγ receptor 1 (Ifngr1) in the first batch of DTCs significantly reduced metastatic burden and extended survival, underscoring the importance of tumor cell intrinsic IFNγ signaling in shaping post-seeding metastatic niche (PSMN) and subsequent metastatic co-evolution. Mechanistically, tumor intrinsic IFNγ response and ascites-derived tumor-associated macrophages (TAMs) protect cancer cells from anoikis-mediated death by promoting pro-survival signaling. Our study defines temporal dynamics of disseminating tumor cells at metastatic niches and reveals a general "first come, first served" pro-metastatic adaptation principle of DTCs.

Keywords: Anoikis; Clonal dynamics; Disseminating Tumor Cells (DTCs); IFN-gamma (IFNγ); In vivo CRISPR Screen; Lineage tracing; MetTag barcoding; Metastasis; Metastatic niches; Single-cell RNA sequencing.


Conflict of interest statement

DECLARATION OF INTERESTS We do not have any competing interests to declare.

Figures

Figure 1:
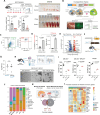
Figure 1:. Tracking Clonal Lineage in Ovarian Cancer Metastasis
(A) Schematic depicting main elements of the MetTag library barcoding construct. (B) Schematic of injection and tissue collection timeline for the staggered injection experimental model using MetTag-barcoded ID8 ovarian cell lines. Schematic was partially created with BioRender.com. (C) Genomic DNA (gDNA)-level barcode distributions in the omentum graphed as frequency under WT, NRG, and MAC depletion conditions. (D-E) gDNA-level barcode distributions in ascites and pelvic fat pads under WT and NRG conditions. In (C-E) panels, BC.ID1 = TP-1, BC.ID2 = TP-2, BC.ID3 = TP-3, BC.ID4 = TP-4, BC.ID5 = TP-5, BC.ID6 = TP-6 for clarity. (F) Injection schema for comparing one-time (400,000 total, n = 10) cell dose and fractionated (2,400,000 total, n = 10) cell injections (left) and representative BLI images at endpoint (right). (G) Bar graph depicting total flux emission in each group at experimental endpoint. (H) Schematic of scRNA-seq experiment conducted using a reversed BC.ID injection order. LARRY barcodes are readily captured by Chromium 10x Feature Barcoding. (I) Pie charts of RNA-level barcode frequencies in each location grouped as early (BC.ID5, BC.ID6), mid (BC.ID4, BC.ID3), and late (BC.ID2, BC.ID1). (J) Heatmap of sample level barcode frequencies, BC.ID6 = TP-1, BC.ID5 = TP-2, BC.ID4 = TP-3, BC.ID3 = TP-4, BC.ID2 = TP-5, BC.ID1 = TP-6. (K) Schematic (top) and MetTag BC.ID distribution (bottom) for independent TNBC lung metastasis model depicting enrichment of scRNA-seq derived early TP DTCs in the metastatic lung at endpoint. Data in Figure 1G was analyzed using a two-tailed Student’s t test and graphed as mean with standard deviation (SD).
Figure 2:
Figure 2:. Clonal Analysis Reveals Shared Evolutionary Path Towards Inflammatory Signature
(A) Split UMAP depicting cluster distributions across the four experimental conditions and identifying cancer cell-enriched clusters in ascites and omentum. (B) Reclustered cancer cell UMAP colored by the two metastasis-bearing anatomical locations. (C) Stacked bar chart depicting the frequency of Seurat subclusters within each metastatic location. (D) Seurat cluster UMAP of reclustered cancer cells with transcriptional program labels. (E) Dot plot depicting Hallmark pathways across all subclusters used to define each cluster subset gene program in (D). (F) Schematic representation of the possible outcomes of LARRY clonal analysis based on transcriptome patterns of enriched clones. (G) Heatmap of normalized clonal LARRY barcode counts across the two anatomical locations and individual mice (HTOs). (H) UMAP overlay of top 3 expanded clones in the omentum. (I) Bar chart depicting the relative subcluster proportions present in each of the top 3 barcode clones. (J) scVelo-generated PAGA velocity graph indicating trajectory arrows and inferred cluster lineage. (K) scVelo and CellRank-based simulated path from start to endpoint clusters. (L) Violin plot depicting RNA-level contribution of each timepoint to the IFNγ signature. Data in Figure 2L was analyzed by first defining the IFNγ signature using canonical mouse genes, followed by directly applying the wilcox.test() function in Seurat to compare TP-1 and TP-6 expression.
Figure 3:
Figure 3:. Activation of IFNγ Response in Ascites is Necessary for Successful Omental Colonization
(A) DEG-based volcano plot of gene expression differences between OmMet and AscMet, where threshold for significance was defined at p <0.05 and log2FC < −1.0 for downregulation or >1.0 for upregulation. (B) Boxplots comparing IFN signature modules between AscMet and OmMet. (C) Schematic describing in vivo ovarian metastatic niche signature screen. Partially created with BioRender.com. (D) In vivo CRISPR screen RankView plots for all 100 genes generated using MAGeCKFlute. OmMet (n=5) and AscMet (n=4) samples were compared to the original pool of ID8 cells. (E) Ranks of individual sgRNAs targeting positive control Pten and depleted genes. (F) Lollipop plot of depleted pathways associated with depleted genes in Fig. 3E. (G) IFNγ treatment time course qPCR plots of select CRISPR hits and positive controls. (H) IFNγ treatment time course western blot probing for Stat1/pStat1 and GBP1. (I) Schematic of in vivo experimental metastasis study comparing sgNTC and sgIFNGR1.g1 groups. (J) Time course log10-transformed total emission/flux values (left). Two independent groups pooled; cohort 1 NTC; n = 8, KO; n = 7; cohort 2 NTC; n = 5, KO; n = 5. log10-transformed flux plot for week six with p value (right). (K) Kaplan Meier survival curve generated for cohort 1. (L) Experimental schematic for staggered sgIfngr1 (n = 4) or sgNTC1 (n = 3) followed by sgNTC2-cell injection. (M) Representative endpoint BLI images of metastasis bearing mice in each group (left) and endpoint BLI quantification comparing tumor burden between sgIfngr1 and sgNTC first injection (right). (N) Heatmap showing enrichment of first DTC seed - either sgNTC1 or sgIfngr1 - and 2nd DTC seed, sgNTC2. DEG data in Figure 3A was analyzed using the FindMarkers() function. Data in Figure 3B was analyzed by first defining custom IFN signatures, followed by applying wilcox.test() in Seurat to compare module scores between AscMet and OmMet. CRISPR screen related data (3D-3F) was analyzed using MAGeCK and MAGeCKFlute. Data in 3G, 3J, 3K, and 3M was analyzed and graphed in Prism. 3G, SJ, and 3M were analyzed using a standard t test; 3G and 3M data was plotted as mean with SD, while 3J was plotted as median. Survival data in 3K was computed using a standard log-rank test.
Figure 4:
Figure 4:. IFNγ Pathway Mediates Resistance to Anoikis and Activates TNF Signaling and Dormancy Programs
(A) Cell-Titer Glo (CTG) assay luminescence values graphed as fold change for regular culture conditions (left) and ultra-low attachment (ULA) conditions (right), with and without IFNγ treatment. (B) Volcano plots generated from bulk RNA-seq depicting top DEGs between sgNTC (wild type) cells under regular culture conditions with or without IFNγ treatment (left) and under ULA conditions with and without IFNγ treatment (right). (C) Venn diagram showing 25 overlapping and 30 unique upregulated genes in sgNTC cells treated with IFNγ under ULA conditions. (D) Heatmap of vst-normalized gene counts for ULA-specific upregulated genes. (E) Bar plot depicting top 15 Reactome pathways upregulated under ULA conditions in cells treated with IFNγ. (F-G) CTG flux dot plots for Stat1-KO (F) and Irf1-KO (G) cells under ultra-low attachment, with or without IFNγ treatment. (H) Violin plots comparing expression level of immunoproteasome (Psmb10, Psmb9), DNA repair/apoptosis (Parp12, Parp14, Parp9), and immune checkpoint (Cd274) levels between OmMet and AscMet. (I) scRNA-seq based gating strategy used to identify Irf1high and Irf1low cells for module scoring. (J) Violin plots comparing expression level of Cd274 (left), Psmb10 (middle), and Parp14 (right) between Irf1high and Irf1low cells. Fold change in F4A was determined by normalizing each cell line’s CTG value to the regular attachment, without IFNγ treatment. CTG assay luminescence data (4A) was graphed as mean and SD, data in 4F and 4G was graphed as median values. scRNA-seq based transcript expression levels were compared between Irf1high and Irf1low cells and OmMet/AscMet cells by applying the wilcox.test() function in Seurat. RNA-seq data was analyzed using DESeq2 and visualized as variance-stabilized counts.
Figure 5:
Figure 5:. Niche-specific Transcriptional States of Omental and Ascites-Derived TAMs
(A) Violin plots depicting CRISPR screen hits expression level across Broad cell ID categories (cell types). (B) CellChat-generated circus plots of interaction strengths between Broad cell ID categories in metastatic omenta (left) and ascites (right). (C) Stacked bar chart of cell type proportions across the four experimental groups. (D) UMAPs of reclustered myeloid cells, split by experimental condition. (E) UMAP of subclustered myeloid cells overlayed with scVelo RNA velocity arrows. Arrows are pointing from ascites TAMs (clusters 1 and 5) to omentum TAMs (clusters 0 and 6). (F) DEG volcano plot comparing gene expression differences between ascites TAM cluster 1 and omentum TAM cluster 0. (G) Stacked bar chart of subsetted T/NK cells comparing cell proportions in ascites and omentum. (H-I) Dot plots depicting Reactome pathways enriched in ascites (H) and omentum-derived TAMs (I). Significance of DEGs in Figure 5F was evaluated by applying the FindMarkers() and Wilcoxon test in Seurat to compare ascites and omental Cd68high/Adgre1high macrophages.
Figure 6:
Figure 6:. Peritoneal Macrophages are Direct DTC Pro-Survival Interactors
(A) Liposomal chlodronate-based macrophage depletion strategy and timeline schematic with representative tissue images. Omental tumor burden quantification and flow-based ascites quantification (bottom). Control group; n= 7, and Chlodrosome; n = 7. (B) Schematic describing Cre-based NicheTracing labeling system where ID8 and E0771 cancer cells express Cre.ERT2. Upon nuclear entry of Cre.ERT2 into Ai6 reporter niche cells, labeled niche cells turn ZsGreen positive. (C) Representative gating strategy depicting the major cell population tagged with zsG. (D) Quantification of F4/80+ and TREM2 mean fluorescent intensity (MFI) of contacted, ZsGreen high cells. (E) Volcano plot comparing DEGs between metastasis-infiltrating Trem2-low and Trem2-high macrophages. (F) Schematic depicting mouse model for macrophage-specific Trem2 knockout. (G) Log transformed BLI-derived flux values in Trem2fl/fl (wild type; n = 5) and Lys2-Cre/Trem2fl/fl (knockout; n = 5) mice at metastasis endpoint. Mice were injected with ID8 p53−/− Luciferase cells. (H) Schematic of macrophage-cancer cell coculture layout (top) and representative coculture images for one cell line (bottom). (I) Plots of percent CD45 negative cancer cell viability (ZombieAqua negative) post coculture in three cell lines. (J) Stacked bar chart of main cell type proportions captured in human scRNA-seq dataset across five anatomical locations, using maintype-2 annotation provided by publisher. (K) Venn diagram of top NicheNet predicted ligands after filtering for robust expression and overlapping with top ligands in our murine dataset. (L) Heatmap comparing enrichment of a curated list of receptors in bulk RNA-seq comparing ULA-cultured cells treated with IFNγ and regular attachment conditions. Data in Figures 6D was plotted as mean with SD and differences between groups were compared via a two-tailed unpaired Student’s t test. Data in Figures 6I was similarly analyzed using a Student’s t test and plotted with median values. Data in Figure 6E was analyzed using the FindMarkers() function in Seurat and Wilcoxon test to compare gated Trem2-low and Trem2-high cells. RNA-seq heatmap data in 6L was analyzed using DESeq2 and visualized as variance-stabilized counts.

References

    1. Gerstberger S., Jiang Q., and Ganesh K. (2023). Metastasis. Cell 186, 1564–1579. 10.1016/j.cell.2023.03.003. - DOI - PMC - PubMed
    1. Ritch S.J., and Telleria C.M. (2022). The Transcoelomic Ecosystem and Epithelial Ovarian Cancer Dissemination. Front. Endocrinol. 13, 886533. 10.3389/fendo.2022.886533. - DOI
    1. Motohara T., Masuda K., Morotti M., Zheng Y., El-Sahhar S., Chong K.Y., Wietek N., Alsaadi A., Carrami E.M., Hu Z., et al. (2019). An evolving story of the metastatic voyage of ovarian cancer cells: cellular and molecular orchestration of the adipose-rich metastatic microenvironment. Oncogene 38, 2885–2898. 10.1038/s41388-018-0637-x. - DOI - PMC - PubMed
    1. Almeida-Nunes D.L., Mendes-Frias A., Silvestre R., Dinis-Oliveira R.J., and Ricardo S. (2022). Immune Tumor Microenvironment in Ovarian Cancer Ascites. Int. J. Mol. Sci. 23, 10692. 10.3390/ijms231810692. - DOI - PMC - PubMed
    1. Lane D., Matte I., Garde-Granger P., Bessette P., and Piché A. (2018). Ascites IL-10 Promotes Ovarian Cancer Cell Migration. Cancer Microenviron. 11, 115–124. 10.1007/s12307-018-0215-3. - DOI - PMC - PubMed

Publication types