[Preprint]. 2025 Aug 14:2025.08.14.669717.
doi: 10.1101/2025.08.14.669717.

Unmasking Pathogen Traits for Chronic Colonization in Neurogenic Bladder Patients

Affiliations

Unmasking Pathogen Traits for Chronic Colonization in Neurogenic Bladder Patients

Seth A Reasoner et al. bioRxiv. .

Abstract

Individuals with neurogenic bladder are particularly susceptible to both chronic bacterial colonization of the bladder and urinary tract infections (UTIs). Neurogenic bladder can arise from a variety of diseases such as diabetes, spinal cord injuries, and spina bifida. To study the ecological and evolutionary dynamics of the microbiome in neurogenic bladder, we developed a longitudinal cohort of 77 children and young adults with spina bifida from two medical centers. We used enhanced urine culture, 16S rRNA sequencing, and whole genome sequencing to characterize the microbial composition of urine and fecal samples. In addition to prospective sample collection, we retrieved prior bacterial isolates from enrolled patients from Vanderbilt's clinical microbial biobank, MicroVU. This allowed us to compare bacterial isolates from the same patients over a period of five years. Urine samples were characterized by high abundance of urinary pathogens, such as E. coli and Klebsiella. From longitudinal isolates from individual patients, we identified two common patterns of urinary tract colonization. We observed either the rapid cycling of strains and/or species, often following antibiotic treatment, or we observed the persistence of a single strain across timepoints. Neither persistence of a strain nor colonization with a new strain or species was associated with increased antibiotic resistance. Rather, in paired longitudinally collected strains from the same patients, mutations were identified in genes that code for cell envelope components associated with immune or phage evasion. Experimental testing revealed that O-antigen/LPS biosynthesis mutations confer protection from the immune system while altering susceptibility to phage predation, reflecting a fitness trade-off. We argue that this unparalleled cohort offers the opportunity to identify mechanisms of bacterial adaptation to the urinary tract that can be exploited in future therapeutic approaches.

Keywords: Urobiome; bacterial evolution; spina bifida; urinary microbiome; urinary tract infection.


Figures

Extended Data Figure 1.
Extended Data Figure 1.. Benchmarking strain thresholds with average nucleotide identity (ANI) and core genome single nucleotide variants (SNVs).
a, ANI of 48 E. coli genome assemblies from this study. ANI was calculated with fastANI. b, Core genome constructed with panaroo using previously published E. coli genomes from our laboratory (NCBI BioProject PRJNA819016). SNVs were extracted from the core genome alignment with snp-dists.
Extended Data Figure 2.
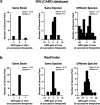
Extended Data Figure 2.. Frequency of antimicrobial resistance genes in bacterial genome assemblies by taxa.
a, Distribution of antimicrobial resistance genes (ARGs) and stress response genes detected across bacterial taxa using the Resistance Gene Identifier (RGI) tool based on the Comprehensive Antibiotic Resistance Database (CARD) database (version 4.0.0). b, Distribution of ARGs detected by ResFinder (version 4.6.0). For both panels, the horizontal line depicts the median. Per genome results are detailed in Supplementary Table 5.
Extended Data Figure 3.
Extended Data Figure 3.. Comparison of antimicrobial resistance genes between successive samples from the same patients.
Change in antimicrobial resistance gene (ARG) and stress response gene content between successive bacterial genomes from the same patients. ARGs and stress response genes identified by the Resistance Gene Identifier (RGI) tool based on the Comprehensive Antibiotic Resistance Database (CARD) database (version 4.0.0). b, Change in ARGs identified by ResFinder between successive bacterial genomes from the same patients. For both panels a and b, the horizontal axis depicts the differential in gene content between successive samples, and the vertical axis represents the number of genome pairs within the frequency bin.
Extended Data Figure 4.
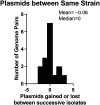
Extended Data Figure 4.. Plasmid content between successive samples of the same strain.
Change in plasmid content between successive bacterial genomes from the same strain within individual patients. Plasmids were predicted from draft genome assemblies with MOB-suite.
Extended Data Figure 5.
Extended Data Figure 5.. Gene ontology clustering from mutations.
Cellular component (a) and molecular function (b) GO terms were clustered by semantic similarity with GO-Figure!. The size of the bubble is proportional to the number of genes associated with the particular semantic cluster. The color represents the Fisher exact test P-value from GO overrepresentation analysis (Supplementary Table 9).
Extended Data Figure 6.
Operon organization of waa (formerly, rfa) locus in UTI89 and BTF6T1.
Extended Data Figure 7.
Extended Data Figure 7.. Soft agar swimming motility of clinical isolates BTF6T1, BTF6T2, UTI89, and its isogenic mutants fhlDC, waaW, and waaL.
Complementation of the waaW deletion was conducted with the plasmid pTRC99a to produce pWaaW. UTI89ΔfhlDC is a negative transcriptional regulator of flagella and serves as a negative control. The bar height is the geometric mean, and the error bars depict the 95% CI. P values were calculated with non-parametric Kruskal–Wallis test with two-sided Dunn’s post hoc test for multiple comparisons.
Extended Data Figure 8.
Extended Data Figure 8.. Loss of O-antigen does not impair bacterial fitness during an acute murine model of UTI.
a, Bacterial burden in organs harvested 24-hours after transurethral inoculation with UTI89, UTI89ΔwaaW, or UTI89ΔwaaL. b, Bacterial burden in organs harvested 72-hours after transurethral inoculation with UTI89, UTI89ΔwaaW, or UTI89ΔwaaL. For panels a and b, the horizontal dashed line represents the limit of detection (20 CFUs per organ). c, Fecal bacterial counts of UTI89, UTI89ΔwaaW, or UTI89ΔwaaL 72-hours after transurethral inoculation. For all panels, the horizontal line depicts the geometric mean, and the error bars depict the 95% confidence interval. Statistical analysis was conducted with non-parametric Kruskal–Wallis test with two-sided Dunn’s post hoc test for multiple comparisons. No significant statistical differences were detected.
Extended Data Figure 9.
Extended Data Figure 9.. Phage susceptibility of UTI89 and its O-antigen biosynthesis mutants and select longitudinal E. coli isolates.
Efficiency of plaquing (EOP) data against a panel of phages for the indicated bacterial strains compared to the corresponding strain BTF1T1 (a), BTF6T1 (b), and UTI89 (c). EOP values are displayed according to the legend on the right.
Figure 1.
Figure 1.. Study schematic.
a, Schematic representation of spina bifida, a congenital malformation of the spina cord. Spina bifida leads to neurogenic bladder and frequent urinary tract infections (UTIs). b, Study protocol overview. Prospective sample collection of urine and fecal samples, and hand swabs began in the year 2023 at two medical centers. Bacterial isolates from historical urine samples from enrolled patients were accessed in the microbial biorepository MicroVU at Vanderbilt University Medical Center. c, Age distribution in 1 year bins and key cohort metrics. Each dot represents an individual patient. Additional cohort metrics are detailed in Supplementary Table 1. Figure created with BioRender under an institutional license.
Figure 2.
Figure 2.. Microbiome characteristics of urine, fecal, and hand swab samples from children with spina bifida.
a, Stacked bar plots of bacterial taxonomic family relative abundance for urine, fecal, and hand swab samples. b, Microbiome similarity between urine and fecal samples from the same or different patients. Microbiome similarity was calculated as 1-Bray-Curtis dissimilarity distance. P value calculated with Wilcoxon rank sum test. c, Shannon diversity of urine samples stratified by catheterization status. P value calculated with Wilcoxon rank sum test. d-e, Relative abundance of taxonomic families Enterobacteriaceae and Prevotellaceae stratified by catheterization status. Differential abundance testing was conducted with MaAsLin2, correcting for age, sex, sequencing batch as fixed effects in the linear model, and accounting for repeated measures by including subject ID as a random effect. Benjamini–Hochberg corrected P values are reported as false discovery rates (FDR).
Figure 3.
Figure 3.. Longitudinal urinary isolates reveal patterns of ecological succession.
Whole genome sequencing of bacterial isolates. Patients with multiple cultured isolates were included. Individual patients are represented on the left vertical axis. The vertical dashed line depicts when prospective sample collection began. The asterisks denote strains that were present within the same patient at multiple timepoints (Supplementary Table 7). No strains were shared between patients. Retrospective samples were accessed from the MicroVU microbial biorepository at Vanderbilt University Medical Center. Only bacterial isolates available for sequencing are depicted. Antibiotic usage and symptomatology were extracted from medical record chart review. The location of symbols on the schematic is approximate.
Figure 4.
Figure 4.. Bacterial whole genome sequencing reveals mutational patterns in longitudinal isolates.
a, Phylogeny of E. coli isolates from shared strains within individual patients (Supplementary Table 7). Node colors represent unique patients. The phylogenetic tree was generated with FastTree and plotted with ggtree. b, Core genome SNVs vs. time (days). Core genome SNVs were extracted from a panaroo core genome alignment with snp-dists and plotted in R. c, Biological process GO terms were clustered by semantic similarity with GO-Figure!. The size of the bubble is proportional to the number of genes associated with the particular semantic cluster. The color represents the Fisher exact test P-value from GO overrepresentation analysis (Supplementary Table 9).
Figure 5.
Figure 5.. LPS/O-antigen biosynthesis mutations alter interactions with bladder epithelial cells and macrophages.
a, Schematic of LPS with the R1-type core oligosaccharide. Geometric symbols represent sugar subunits of the oligosaccharide portions of LPS. Abbreviations: Kdo—3-deoxy-d-manno-oct-2-ulosonic acid; Hep—glycero-d-manno-heptose; Glc—glucose; Gal—galactose. b, Premature stop codon in waaW from E. coli isolate BTF6T2 relative to isolate BTF6T1 from the same patient. Mutation visualized with Snipit. c, Silver stained LPS extracts. The LPS standard-- is a commercially available product from E. coli serotype O55:B5 (1.25 μg of LPS standard was added). d, Adherence to and invasion of bladder epithelial cells (ATCC HBT9). UTI89 and its isogenic mutants waaW and waaL were tested. e, Macrophage internalization and survival of UTI89 and its isogenic waaW mutant. Internalized CFUs were counted 30 minutes after inoculation, and surviving CFUs were counted from within the macrophages 90 minutes after inoculation. For panels d and e, the horizontal line is the geometric mean, and the error bars depict the 95% CI. P values were calculated with non-parametric Kruskal–Wallis test with two-sided Dunn’s post hoc test for multiple comparisons.

Similar articles

References

    1. Manack A. et al. Epidemiology and healthcare utilization of neurogenic bladder patients in a US claims database. Neurourol Urodyn 30, (2011). - PubMed
    1. Kotkin L. & Milam D. F. Evaluation and management of the urologic consequences of neurologic disease. Tech Urol 2, (1996). - PubMed
    1. Ginsberg D. The epidemiology and pathophysiology of neurogenic bladder. American Journal of Managed Care 19, (2013). - PubMed
    1. Mitchell L. E. et al. Spina bifida. Lancet 364, (2004). - PubMed
    1. Copp A. J. et al. Spina bifida. Nat Rev Dis Primers 1, (2015). - PMC - PubMed

Publication types

LinkOut - more resources