[Preprint]. 2025 Aug 11:2025.08.08.669213.
doi: 10.1101/2025.08.08.669213.

Divergent ontogeny of Tissue Resident Memory and Tissue Resident Exhausted CD8+ T cells underlies distinct functional potential

Affiliations

Divergent ontogeny of Tissue Resident Memory and Tissue Resident Exhausted CD8+ T cells underlies distinct functional potential

Simone L Park et al. bioRxiv. .

Abstract

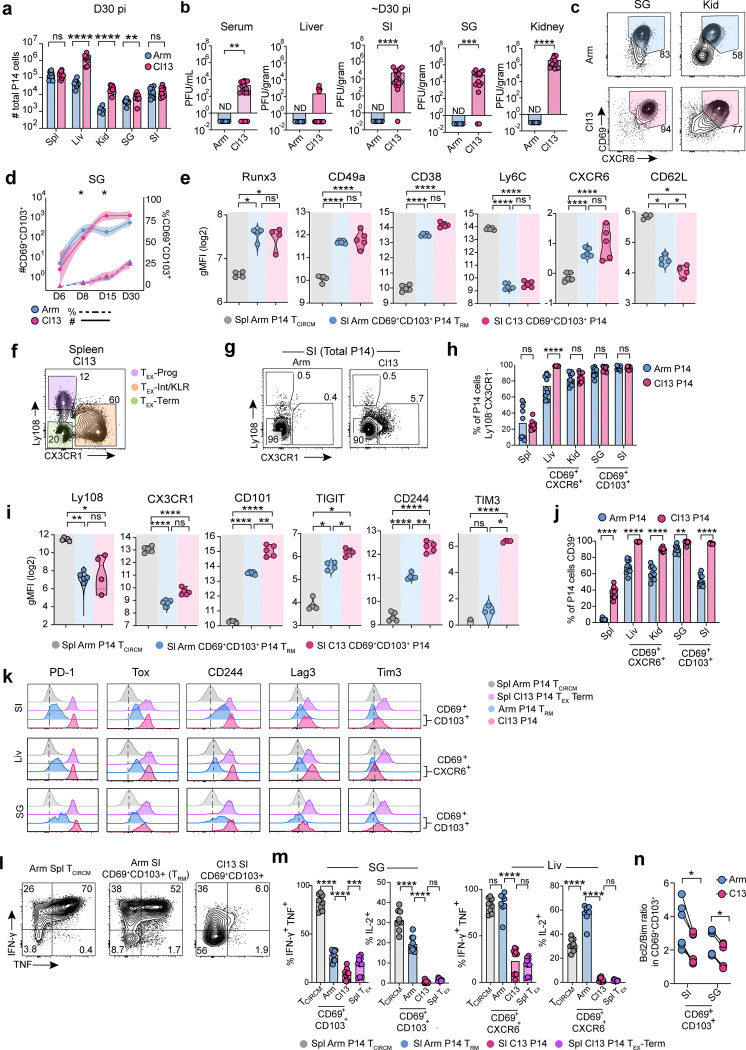
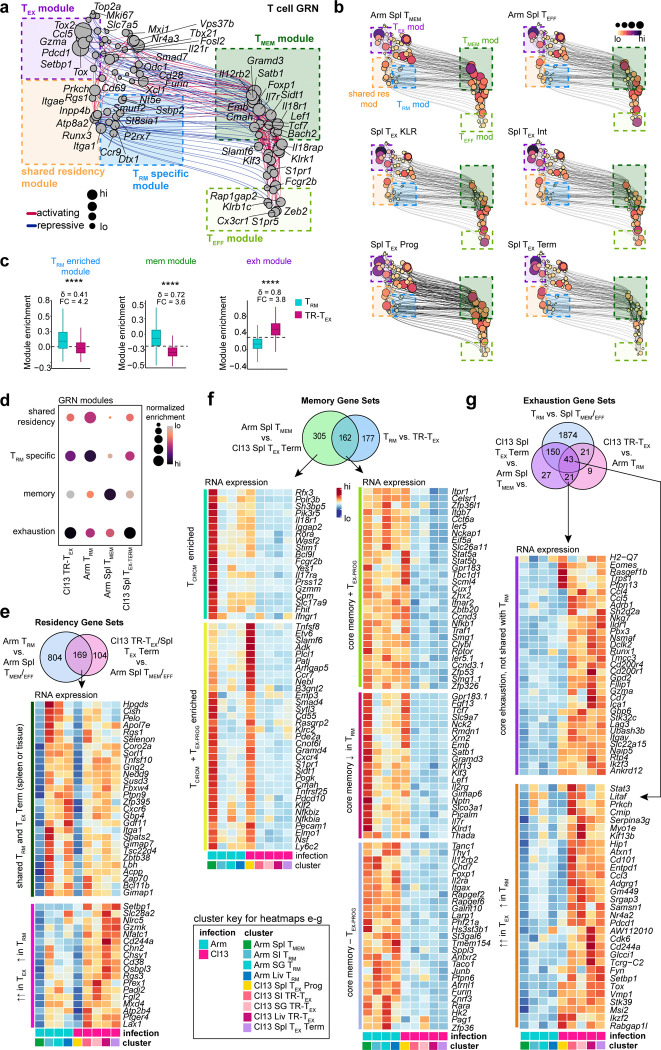
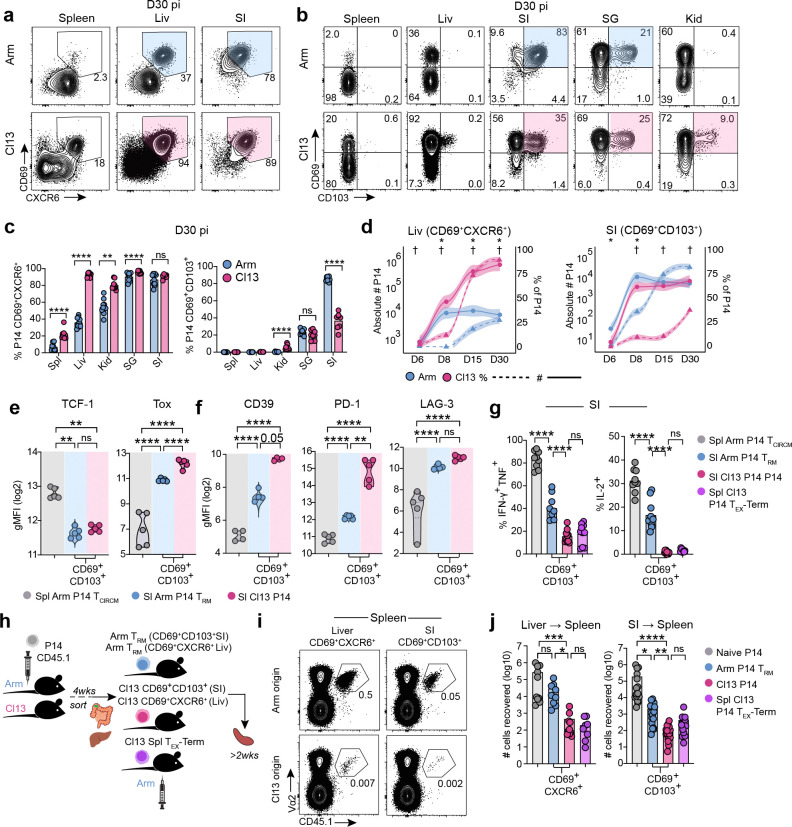
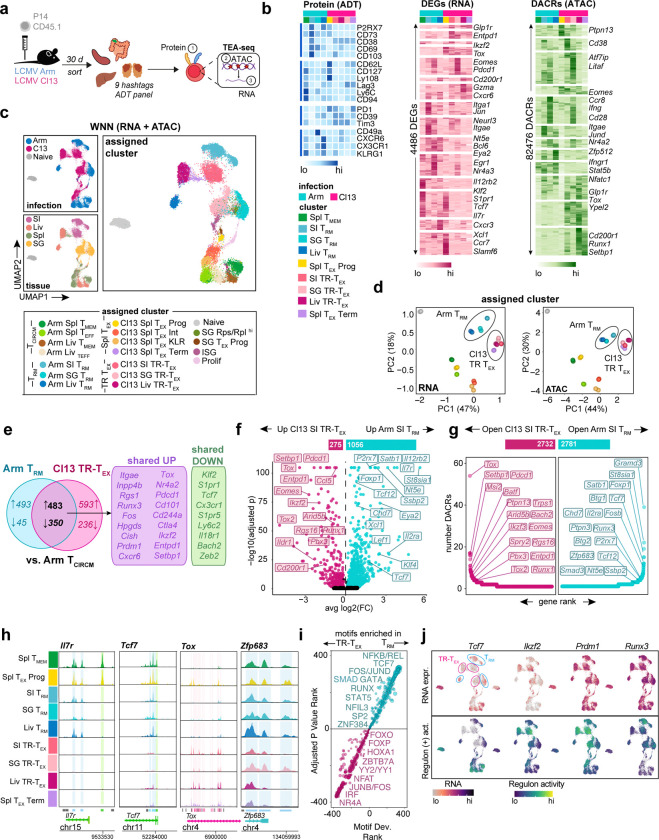
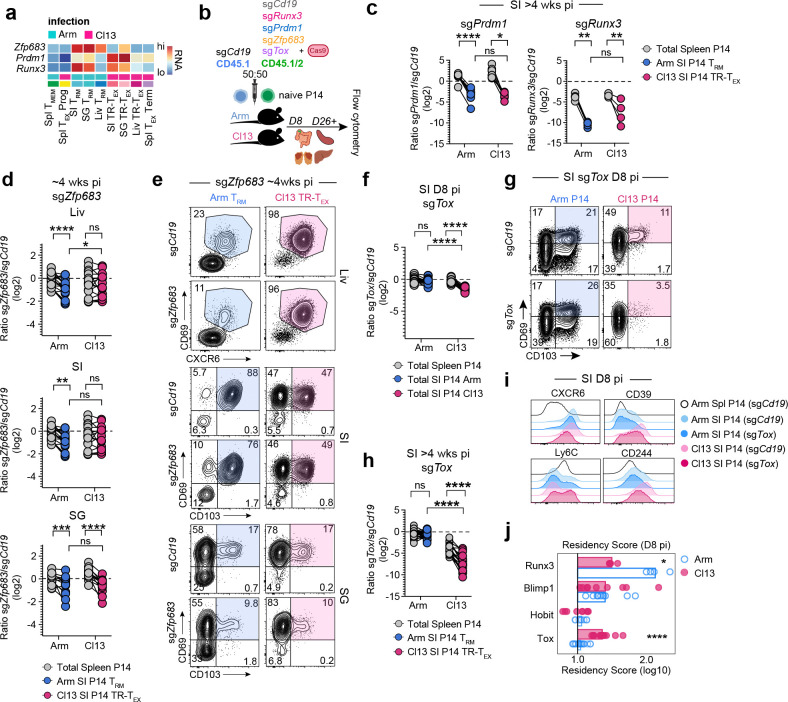
Persistent antigen stimulation promotes differentiation of exhausted CD8+ T (TEX) cells. TEX cells are distinct from circulating memory T (TCIRCM) cells but share many features with tissue-resident memory (TRM) cells established following infection resolution. CD8+ T cells co-expressing residency- and exhaustion-associated molecules in chronic diseases often correlate with clinical outcomes. However, the relationship between these cells and conventional TRM or TEX cells remains unclear. Here, we show that chronic antigen stimulation drives development of tissue-resident TEX (TR-TEX) cells that are ontologically and functionally distinct from TRM cells generated after antigen clearance. TR-TEX phenotypically resembled TRM cells but were regulated by distinct transcriptional networks and were uniquely dependent on Tox for residency programming. Although TEX progenitor cells acquired residency features upon entering chronically infected tissues, they failed to generate conventional TRM cells after antigen withdrawal. Conversely, TRM cells were able to differentiate into TEX cells during chronic antigen stimulation. Deriving cell-state specific transcriptional signatures revealed a selective association of TR-TEX cells with patient responses to immune checkpoint blockade, and only TR-TEX but not TRM cells responded to PD-1 pathway inhibition in vivo. These data suggest that TR-TEX and TRM cells are developmentally distinct cell types that share a tissue-residency program but have distinct roles in disease control.


Conflict of interest statement

Competing Interests. A.C.H received research funding from Bristol Myers Squibb and Merck. C.T.E. holds equity in Cabaletta Bio and has licensed patents with Cabaletta Bio and Novartis. J.R.G. is a consultant for Arsenal Biosciences, Cellanome, Seismic Therapeutics, and GVM1. E.J.W. is a member of the Parker Institute for Cancer Immunotherapy which supported this study. E.J.W. is an advisor for Arsenal Biosciences, Coherus, Danger Bio, IpiNovyx, New Limit, Marengo, Pluto Immunotherapeutics, Prox Biosciences, Related Sciences, Santa Ana Bio, and Synthekine. E.J.W. is a founder of Prox Biosciences, Danger Bio, and Arsenal Biosciences. E.J.W. holds stock in Coherus.

Figures

Extended Data Figure 1.
Extended Data Figure 1.. Phenotype and function of tissue-infiltrating CD8+ T cells during acute and chronic infection.
a, Absolute number of Vα2+CD45.1+ P14 T cells isolated from spleen (Spl), liver (Liv), kidney (Kid), salivary gland (SG) or small intestine epithelium (SI) 30 dpi with acute LCMV Arm or chronic LCMV Cl13 infection. b, Viral titers detected by plaque assay in serum or indicated tissues 28–32 dpi. c, Expression of CD69 and CXCR6 by P14 cells in indicated tissues 30 dpi with Arm or Cl13. d, Frequency (dashed lines, ) or absolute number (solid lines, *) of CD69+CD103+ cells in SG at indicated dpi with Arm (blue) or Cl13 (pink). Individual data points represent mean; shading represents 95% confidence interval. e, Geometric mean-fluorescence intensity (gMFI) of residency-associated molecules by CD69+CD103+ P14 cells isolated 30 dpi from the SI of Arm (TRM) or Cl13 infected mice or TCIRCM cells from Arm Spl. f,g, Expression of Ly108 and CX3CR1 by P14 T cells isolated from Spl (f) or SI (g) 30 dpi. TEX-Prog; TEX Progenitor, TEX-Int; TEX-Intermediate, TEX-KLR; TEX-Killer cell lectin-like receptor, TEX-Term; TEX Terminal. h, Frequency of Ly108CX3CR1 cells within total P14 cells (Spl), CD69+CXCR6+ P14 cells (Liv or Kid) or CD69+CD103+ P14 cells (SG, SI) 30d post-infection with Arm or Cl13. i, Geometric mean-fluorescence intensity (gMFI) of exhaustion-associated molecules by CD69+CD103+ P14 cells isolated 30 dpi from the SI of Arm (TRM) or Cl13 infected mice or TCIRCM cells from Arm Spl. j, Expression of CD39 by P14 cells with indicated surface phenotype 30 dpi with Arm or Cl13 across tissues. k, Expression of indicated surface markers by CD69+CD103+ (SI, SG) or CD69+CXCR6+ (Liv) P14 TRM cells (Arm, blue) or P14 T cells (Cl13, pink) compared to Arm Spl TCIRCM cells (grey) and Cl13 Spl TEX-Term cells (purple) 30–40 dpi. Dashed line indicates average expression in Arm TCIRCM P14 cells. l, Cytokine production by TCIRCM P14 cells from Arm Spl or by CD69+CD103+ TRM cells from Arm SI or CD69+CD103+ P14 cells from Cl13 SI 30–40 dpi following in vitro gp33–44 peptide stimulation. m, Cytokine production by P14 TCIRCM cells isolated from the Spl of Arm infected mice (grey), CD69+CXCR6+ terminally exhausted P14 cells from the Spl of Cl13 infected mice (TEX-TERM), or by CD69+CD103+ (SG) or CD69+CXCR6+ (Liv) P14 cells from Arm (TRM, blue) or Cl13 (pink) infected mice 30–40 dpi following in vitro gp33–44 peptide stimulation. n, Ratio of Bim and Bcl2 gMFI in CD69+CD103+ P14 T cells isolated from the SI or SG of Arm (TRM, blue) or Cl13 (pink) infected mice 15–25 dpi. Data are pooled from 2–3 independent experiments (a, b, d, h, j, m, n), or representative of 2–3 independent experiments (c, e, f, g, i, k, l) with n = 4–5 mice (a-m) or n = 3 mice per group per experiment (n). * or p < 0.05, ** p < 0.01, *** p < 0.001, **** p < 0.0001 Mann-Whitney test (a, c, d, e, h, i, j, m) or Wilcoxon signed-rank test (n).
Extended Data Figure 2.
Extended Data Figure 2.. Resolution of T cell states across tissues in acute and chronic infection.
a, Projection of all P14 cells analyzed by TEA-seq in UMAP space based on RNA expression only (upper panel) or chromatin only (lower panel) colored by sample (Hashtag; HT). b, Distribution of P14 cells assigned to each annotated cluster derived from each infection (upper panel), tissue (middle panel) or sorted sample (lower panel). c, Weighted-nearest neighbor (WNN) UMAP based on combined RNA and ATAC expression in P14 cells colored by ADT (protein, top row), RNA expression (middle row) or by gene activity (bottom row, chromatin accessibility) for indicated markers. d, Re-clustered WNN UMAP based on combined gene expression and chromatin in P14 cells from SI and Spl samples only, colored by annotated Seurat subcluster (cluster key d-h). e RNA expression of top 10 marker genes and selected key genes by each indicated SI-derived subcluster and Spl-derived cluster. f,g Expression of CD103 protein (ADT) and RNA (Itgae), joint RNA expression of Klf2 and S1pr1 or joint CD69 and CXCR6 protein (ADT) expression in SI and Spl derived P14 cells. Purple shaded area in g indicates cells annotated as CD103-ADT+. h, Distribution of cells from SI and Spl assigned to each subcluster. i, Re-clustered WNN UMAP based on combined gene expression and chromatin in P14 cells from SG and Spl samples only, colored by annotated Seurat subcluster (cluster key i-m). j, RNA expression of top 10 marker genes and selected key genes by each indicated SG-derived subcluster and Spl-derived cluster. k, l, Expression of CD103 protein (ADT) and RNA (Itgae), joint RNA expression of Klf2 and S1pr1 or joint CD69 and CXCR6 protein (ADT) expression in SI and Spl derived P14 cells. Purple shaded area in l indicates cells annotated as CD103-ADT+. m, Distribution of cells from SG and Spl assigned to each subcluster. n, Re-clustered WNN UMAP based on combined gene expression and chromatin in P14 cells from Liv and Spl samples only, colored by annotated Seurat subcluster (cluster key n-q). o, RNA expression of top 10 marker genes and selected key genes by each indicated Liv subcluster and Spl-derived cluster. p, Expression of Gzma RNA or joint RNA expression of Klf2 and S1pr1 in Liv and Spl derived P14 cells. q, Distribution of cells from Liv and Spl assigned to subcluster. Data are pooled from 20–25 mice per infection per tissue.
Extended Data Figure 3.
Extended Data Figure 3.. Transcriptional and epigenetic differences between TRM and TR-TEX cells.
a, Heatmap of RNA expression of genes that are upregulated in Arm TRM cells versus Arm Spl TCIRCM cells and are also upregulated in Cl13 TR-TEX cells versus Cl13 Spl TEX-TERM cells. b, Violin plots displaying gene expression in indicated Seurat clusters. c, Volcano plot of differentially expressed genes (DEGs) between Arm SI TR-TEX and Cl13 Spl TEX-TERM cells. d, Volcano plots displaying pairwise DEGs (left column) and rank-ordered plots displaying pairwise differentially accessible chromatin regions (DACRs) (right column) between Arm TRM cells (blue) and Cl13 TR-TEX cells (pink) from SG (top panel) or Liv (bottom panel). e, Number of DEGs (left panel) and DACRs (right panel) between Arm Spl TMEM and Cl13 Spl TEX-Term or tissue-matched Arm TRM (blue) and Cl13 TR-TEX (pink) P14 cells. e, Proportion of genes upregulated or downregulated in CD103-ADT+ Arm TRM or CD103-ADT+ Cl13 TR-TEX cells from the SI or SG that are also up- or down-regulated by total Arm TRM or Cl13 TR-TEX cells from the same tissue. Data are pooled from 20–25 mice per infection per tissue.
Extended Data Figure 4.
Extended Data Figure 4.. Differential regulation of exhaustion, memory and tissue-residency associated factors in TRM and TR-TEX cells.
a, ATAC coverage plots of DACRs in indicated gene loci for each cluster. SI and SG Arm TRM and Cl13 TR-TEX are subsetted to CD103-ADT+ cells. Green bars indicate DACRs enriched in Arm Spl TMEM compared to Arm TRM cells, blue bars indicate DACRs enriched in Arm TRM cells compared to location-matched Cl13 TR-TEX cells from at least one tissue, pink bars indicate DACRs enriched in Cl13 TR-TEX compared to location-matched Arm TRM cells from at least one tissue. b, Pairwise transcription factor (TF) motif enrichment in SI (left panel), SG (middle panel) or Liv (right panel) Arm TRM cells compared to tissue-matched Cl13 TR-TEX cells (x axis) plotted against pairwise TF motif enrichment in Arm Spl TMEM cells compared to Cl13 Spl TEX-TERM cells (y axis). MeanDiff = mean difference determined by chromvar motif deviation analysis. c, RNA expression of indicated TFs (upper panel) and of genes in Pando-defined regulons predicted to be controlled by each TF (positive regulon activity). Data are pooled from 20–25 mice per infection per tissue.
Extended Data Figure 5.
Extended Data Figure 5.. Requirements for Runx3, Blimp1 and Hobit for residency programming across tissues.
a, Ratio of total P14 cells electroporated with indicated sgRNAs versus control Cd19 sgRNAs from Arm (blue) or Cl13 (pink) infected SI (colored) or spleen (grey) at 8–9 dpi..b, Co-expression of CD69 and CD103 by SI P14 T cells electroporated with control sgCd19 or indicated TF-targeting sgRNAs at 8–9 dpi with Arm (blue) or Cl13 (pink). c, Ratio of congenically distinct and co-transferred P14 Arm TRM (blue), TR-TEX (pink) cells electroporated with identical control Cd19 sgRNAs (same guide in each congenic population) in indicated tissues (SI, SG P14 gated on CD69+CD103+, Liv P14 gated on CD69+CXCR6+) compared to co-transferred total Spl-derived P14 cells (grey) at 26–37 dpi. d, Ratio of co-transferred Arm TRM (blue), Cl13 TR-TEX (pink) or total Spl-derived (grey) P14 cells electroporated with Prdm1 or Runx3 sgRNAs versus control Cd19 sgRNAs at 30–37 dpi. Arm TRM and Cl13 TR-TEX were gated as CD69+CD103+ in the SG and as CD69+CXCR6+ in the Liv. e, Ratio of total CD69+ P14 cells electroporated with indicated sgRNAs versus control Cd19 sgRNAs from Arm (blue) or Cl13 (pink) infected tissues (SI, Liv, SG; colored) compared to ratio of total Spl-derived P14 cells (grey) at 26–37 dpi. Data are pooled from 2 independent experiments with 4–8 mice per group per experiment. * p < 0.05, ** p < 0.01, *** p < 0.001, **** p < 0.0001 paired T test (spleen versus tissue P14s) or two-tailed T test (Arm versus Cl13 tissue P14s) (a, c-e).
Extended Data Figure 6.
Extended Data Figure 6.. Tox coordinates TR-TEX cell residency programming but is not required for TRM cell development.
a, Expression of Tox in total sgCd19 and sgTox electroporated P14 cells isolated from the SI at 8–9 dpi with Arm or Cl13. b, Ratio of total P14 cells electroporated with Cd19 control or Tox targeting sgRNAs isolated from the Spl or SI at 8d (left panel) or >4wks (right panel) pi with Arm or Cl13. c, Frequency of CD69+CD103+ sgCd19 (grey) or sgTox (purple) electroporated P14 cells isolated from the SI at 8 dpi. d, Ratio of co-transferred Arm TRM (blue), Cl13 TR-TEX (pink) or total Spl-derived (grey) P14 cells electroporated with Tox sgRNAs versus control Cd19 sgRNAs >4wks pi. Arm TRM and Cl13 TR-TEX were both gated as CD69+CD103+ in the SG or as CD69+CXCR6+ in the Liv. e, Frequency of P14 cells that were CD69+CD103+ (SI, SG) or CD69+CXCR6+ (Liv) following electroporation with Tox (purple) or Cd19 (grey) targeting sgRNAs isolated from indicated tissues >4wks pi. f, Ratio of total CD69+ P14 cells electroporated with Tox sgRNAs versus control Cd19 sgRNAs from Arm (blue) or Cl13 (pink) infected tissues (SI, Liv, SG; colored) compared to ratio of total P14 cells in the spleen (grey) >4wks pi. g, Expression of indicated surface molecules by total P14 cells electroporated with indicated sgRNAs and isolated from the SI 8–9 dpi with Arm or Cl13. h, Fold change (FC) in expression of indicated surface molecules in total P14 cells electroporated with sgRNAs directed towards genes encoding indicated TFs compared to control cells electroporated with sgRNAs directed towards Cd19 at 8–9 dpi with Arm or Cl13. Data are pooled from 2–3 experiments with 4–8 mice per group per experiment. * p < 0.05, ** p < 0.01, *** p < 0.001, **** p < 0.0001 paired T test (spleen versus tissue P14s) or two-tailed T test (Arm versus Cl13 tissue P14s) (b-f) or Mann Whitney test (h).
Extended Data Figure 7.
Extended Data Figure 7.. Developmental plasticity and lineage relationships between TRM and TEX cells.
a, Expression of CD107a by sort-transferred donor P14 cells rechallenged with Arm or Cl13 and re-isolated from the Spl 21–28 dpi following ex vivo gp33–44 stimulation, compared to TRM cells that were not transferred or rechallenged (no rch). Statistics indicate comparison between Arm and Cl13 rechallenged cells of same origin. b, Absolute number of total P14 cells recovered from the Spl of mice receiving donor cells from indicated origin following Cl13 rechallenge. c, UMAP of unsupervised phenograph (pg) clustering of donor P14 cells from Arm or Cl13 rechallenged mice; numbers in key indicate pg cluster determined by kmeans clustering. d, Heatmap of marker expression in pg clusters. Rechallenge infection giving rise to each cluster is indicated by pink (Cl13) or blue (Arm). TEX-TERM clusters are highlighted in purple (pg 8 and pg 4). e, Proportion of Spl TEX-TERM cells derived from donor P14 cells of indicated origin in pg clusters after Cl13 rechallenge. f, g, Expression of markers by Spl TEX-TERM cells from indicated donor origin after Cl13 rechallenge compared to Arm rechallenge. h, Absolute number of total P14 cells (Spl) or CD69+CD103+ P14 cells (SG) derived from donor P14 cells following Arm rechallenge. i, Proportion of Arm-rechallenged P14 cells co-expressing CD69 and CD103 in SG. j, Expression of indicated surface molecules by Arm-rechallenged donor P14 cells of indicated origin isolated from the Spl or SI. k, Proportion of Arm-rechallenged P14 cells in the Spl or SI expressing CX3CR1 and Ly6C. l, m, Proportion of Arm-rechallenged donor P14 cells staining positive for CD8a-BV650 during intravascular labelling. Bl; blood. n, Absolute number of total P14 cells (Spl) or CD69+CD103+ P14 cells (SG) derived from donor P14 cells following Cl13 rechallenge. o, Proportion of Cl13-rechallenged donor P14 cells co-expressing CD69 and CD103 in SG. p, Expression of Ly6C and CX3CR1 by Cl13-rechallenged donor P14 cells recovered from the SI. q, Expression of indicated surface molecules by Cl13 rechallenged donor P14 cells isolated from the Spl or SI. r, Proportion of donor P14 cells expressing CD69 and CD103 in the SI after Arm or Cl13 rechallenge. s, Absolute number of total P14 cells isolated from the Spl of Arm or Cl13 infected mice following 1wk dasatinib treatment. t, Frequency of P14 cells co-expressing CD69 and CD103 in SI and SG of Arm or Cl13 infected mice following 1wk dasatinib treatment. Dashed lines on absolute number plots (h, n) indicate threshold limit of detection for plotting in frequency plots. Dashed lines in histograms (l, q) indicate average expression in total naïve P14-derived cells in Spl. Data are pooled from or representative of 2 independent experiments (a, h-r) or 3 independent experiments (b-g, s-t), with n = 3–5 mice per group per experiment. TN; naïve P14 cells. * p < 0.05, ** p < 0.01, *** p < 0.001, **** p < 0.0001 Mann Whitney Test.
Extended Data Figure 8.
Extended Data Figure 8.. Cell-state specification of TRM and TR-TEX cells.
a, Detailed UMAP embedding of inferred single-cell Gene Regulatory Network (GRN) based on combined transcription factor (TF) expression and motif accessibility in all non-naïve P14 cells analyzed by TEA-sequencing. Size of nodes (genes) represents the number of connections in network. b, Individual UMAP embeddings of genes and gene modules from inferred single-cell Gene Regulatory Networks (GRNs) engaged in each T cell subset. Node size and color scale represent degree of RNA expression for each gene in network. c, d Enrichment for GRN modules in merged TRM and TR-TEX cell Seurat clusters from all tissues, or in Arm Spl TMEM and Cl13 Spl TEX-TERM clusters. FC = fold change, δ = Cliff’s delta effect size. Circle size and heat scale indicate relative enrichment per cluster. e, Heatmap of RNA expression of genes commonly upregulated in Arm TRM and Cl13 TR-TEX cells versus Arm Spl TCIRCM cells (pooled Arm Spl TMEM and Arm Spl TEFF clusters). f, Heatmap of RNA expression of genes uniquely upregulated in Arm Spl TCIRCM cells versus Cl13 Spl TEX-TERM cells but not in Arm TRM cells versus Cl13 TR-TEX cells (left panel), or commonly upregulated in Arm Spl TCIRCM cells versus Cl13 Spl TEX-TERM cells and Arm TRM cells versus Cl13 TR-TEX cells (right panel). g, Comparative analysis of RNA expression of genes upregulated in 1) Cl13 Spl TEX-TERM cells versus Arm Spl TCIRCM cells, 2) Cl13 Spl TR-TEX cells versus Arm TRM cells from each tissue and 3) TRM from each tissue versus Arm Spl TCIRCM cells. Heatmaps display genes that are uniquely enriched in TEX (top panel) or are shared with Arm TRM cells (bottom heatmap) compared to Spl TCIRCM cells. Data are pooled from 20–25 mice per infection per tissue.
Extended Data Figure 9.
Extended Data Figure 9.. Defining cell-state specific gene and surface protein signatures of TRM and TR-TEX cells.
a, Heatmaps displaying relative RNA expression of indicated genes comprising TRM cell-specific (upper panel) or TR-TEX cell-specific (lower panel) signatures identified through TEA-seq. b, UMAP projections showing Seurat enrichment for published Mackay 2016 TRM core and Giles 2022 TEX-TERM signatures in TRM (blue circled clusters) and TR-TEX (pink circled clusters) compared to newly derived TRM and TR-TEX cell-state specific signatures in TEA-seq dataset. c, Cliff’s delta effect size and fold-change of Seurat enrichment for published Mackay 2016 TRM core and Giles 2022 TEX-TERM signatures and newly derived TRM and TR-TEX cell-state specific signatures in indicated P14 cell populations from TEA-seq dataset. d, Seurat enrichment for cell-state specific TRM or TR-TEX signature scores within CD8+ T cells isolated from human SI epithelium or non-naïve CD8+ T cells from healthy donor peripheral blood or GSEA enrichment for cell-state specific signatures within CD39+PD-1+ TEX cells compared to all non-naïve CD8+ T cells isolated from healthy donor peripheral blood. δ = Cliff’s delta, FC = fold-change. e, RNA expression of genes encoding indicated surface proteins in LCMV-generated P14 cell clusters identified via TEA-seq. Circle size indicates proportion of cells expressing each gene; scale bar indicates relative expression. f, Expression of indicated molecules in Arm Spl TCIRCM, Cl13 Spl TEX-PROG or Cl13 Spl TEX-TERM cells and in TRM or TR-TEX cells isolated from SI (CD69+CD103+) or Liv (CD69+CXCR6+) 30–40 dpi with Arm or Cl13, respectively. g, Proportion of TRM (blue) or TR-TEX cells (pink) expressing CD73 and CD200R in Liv (CD69+CXCR6+) or SG (CD69+CD103+) after Arm or Cl13 infection, respectively (left and middle panel) or proportion of TRM-like cells in human epidermal or melanoma samples (KLRG1CD69+CD103+) expressing CD73 and CD200R (right panel). h, IR expression by total P14 TCIRCM from the Spl of Arm-infected mice or by CD69+CD103+CD73+ TRM cells (blue) or CD69+CD103+CD73CD200R+ TR-TEX cells (pink) 30–40 dpi with Arm or Cl13, respectively. i, IR expression by KLRG1CD69+CD103+CD73+ TRM-like cells from human tonsil or epidermal skin or KLRG1CD69+CD103+CD73CD200R+ TRM-like TIL from HNSCC or melanoma. Data are pooled from 3–6 human donors (g, i) or representative of at least 2 experiments with 4–5 mice per group per experiment (e, f, g). TEA-seq data are pooled from 20–25 mice per infection per tissue. * p < 0.05, Mann Whitney test.
Extended Data Figure 10.
Extended Data Figure 10.. TRM and TR-TEX cells differentially contribute to immune responses.
a, Frequency of LM-OVA generated OT-I cells in the SI co-expressing CD69 and CD103 following LCMV Arm or Cl13 reinfection, or with no LCMV infection (no inf). b, Viral titers in the serum of LM-OVA immune mice 30d after infection with Arm or Cl13. LOD = limit of detection. c, Proportion of CD69+CD103+ OT-I TRM (LM-derived), P14 TRM (Arm-derived) or P14 TR-TEX (Cl13-derived) cells expressing CD73 or CD200R following LCMV infection or without LCMV infection (LM only). d, e Kaplan-Meier survival curves for overall survival of metastatic melanoma patients from the TCGA database (d) or TNBC patients from the METABRIC database (e) displaying stratification by TRM and TR-TEX specific signatures (hi = top 25%, lo = bottom 25%) within all patients (upper panel) or within the top 50% of CD8hi patients compared to CD8lo patients (lower panel). f, Correlation analysis comparing TRM (blue) and TR-TEX (pink) signature scores and CD8A expression in TCGA melanoma patients. g, Geometric mean fluorescence intensity (gMFI) of PD-1 in CD69+CD103+ Arm SI P14 TRM or Cl13 TR-TEX cells (left panel) and of PD-L1 in MHCII+CD11c+ SI-derived dendritic cells (DCs) at baseline (no peptide treatment) and 48h after treatment with gp33–44 peptide i.v.. h, Number of total P14 cells isolated from the SI (right panel) of Arm or Cl13 infected mice treated with FTY720 and α-PD-L1 with or without i.v. gp3333–41 peptide administration 48h earlier. i, j, Cytokine production by total Spl P14 cells (i) or by CD69+CXCR6+ Cl13 Spl TEX-TERM cells (j) treated with α-PD-L1 with or without i.v. gp3333–41 peptide treatment. k, Frequency of CD69+CD103+ SI P14 TRM (Arm) or TR-TEX (Cl13) cells producing IFN-γ and TNF following α-PD-L1 treatment with gp33–44 peptide i.v. co-infusion in all mice. l-n, Degranulation (CD107a expression, l) or cytokine production by SI CD69+CD103+ P14 Arm TRM cells or Cl13 TR-TEX cells from mice treated with α-PD-L1 with or without gp3333–41 peptide i.v.. Data are pooled from and representative of 3 independent experiments with n = 4–7 mice per group per experiment (a-c) and 2–3 independent experiments with 3–8 mice per group per experiment (g-n). * p < 0.05, ** p < 0.01, Kruskal Wallist Test (a-c, g), Mann Whitney test (h-n), Kaplan-Meier estimate (d, e) or Pearson correlation test (f).
Figure 1.
Figure 1.. Functionally distinct CD8+ T cells expressing residency and exhaustion molecules populate peripheral tissues in acute and chronic infection.
a, b Expression of CD69 and CXCR6 (a) or CD69 and CD103 (b) by P14 cells from the indicated tissues 30 days post-infection (dpi) with LCMV Arm or Cl13. Spl; spleen, Liv; liver, SG; salivary gland, SI; small intestine epithelium, Kid; kidney. Shading highlights tissue-localizing cells co-expressing both markers. c, Frequency of P14 cells expressing indicated molecules isolated from the indicated tissues 30 dpi with Arm or Cl13. d, Frequency (dashed lines, ) or absolute number (solid lines, *) of CD69+CXCR6+ (Liv) or CD69+CD103+ (SI) cells at indicated dpi with Arm (blue) or Cl13 (pink). Individual points represent mean; shading represents 95% confidence interval. e, f, Geometric Mean Fluorescence Intensity (gMFI) of indicated molecules in TCIRCM P14 cells isolated from the Spl of Arm mice (grey) or in CD69+CD103+ P14 cells isolated from the SI of Arm (TRM, blue) or Cl13 (pink) mice 30–40 dpi. g, Cytokine production by P14 TCIRCM cells from the Spl of Arm mice (grey), terminally exhausted P14 cells from the Spl of Cl13 mice (TEX-TERM), CD69+CD103+ P14 TRM cells from the SI of Arm infected mice (blue) or CD69+CD103+ P14 T cells from the SI of Cl13 infected mice (pink) 30–40 dpi following ex vivo gp33–44 peptide stimulation. h, Experimental schematic. CD45.2+ mice received naïve CD45.1+ P14 cells and were then infected with Arm or Cl13. The following populations were sort-purified 4–5 wks pi: CD69+CXCR6+ (Liv) or CD69+CD103+ (SI) P14 cells from Arm (TRM) or Cl13 infected mice, CD69+Ly108TEX-TERM cells from the Spl of Cl13 mice, and CD44lo P14 naïve P14 cells from blood. Matched numbers of sorted cells (10–15,000) were adoptively transferred to separate naïve CD45.2+ recipients that were then rechallenged with Arm. P14 cells were re-isolated from the Spl of rechallenged mice >2 wks pi. i, j, Frequency (i) and absolute number (j) of total P14 cells from recovered from the Spl of Arm rechallenged recipients. Data are pooled from 2–3 independent experiments (c, d, g, j), or representative of 2–3 independent experiments (a, b, e, f, i) with n = 4–5 mice (a-g) or n = 5–7 (j-k) mice per group per experiment. * or p < 0.05, ** p < 0.01, *** p < 0.001, **** p < 0.0001 Mann-Whitney test (c, d), Two-Way ANOVA (j) or Kruskal Wallis Test (e, f, g).
Figure 2.
Figure 2.. Discrete transcriptional and epigenetic regulation of TRM and TEX cells across tissues.
a, Experimental schematic for single-cell TEA-seq of tissue P14 T cells. Naïve CD45.1+ P14 T cells were adoptively transferred to CD45.2+ mice that were then infected with Arm or Cl13. Total P14 cells were sort-purified from Spl, Liv, SI and SG 30 dpi or from naïve P14 blood, stained with Hashtag and Antibody-Derived-Tag (ADT) oligos then pooled and sequenced. b, Relative ADT intensity (blue) for all ADTs, RNA expression (pink) for the top 50 unique DEGs, or ATAC accessibility (green) for the top 5000 unique DACRs between indicated clusters. c, UMAP of Weighted Nearest Neighbor (WNN) analysis of RNA and ATAC modalities colored by infection (top left panel), tissue origin (bottom left panel) or assigned cluster (right panel, bottom key) based on gene expression and chromatin accessibility directed annotation of unsupervised clusters (see Supplementary Figure 2). d, Principal Component Analysis (PCA) of RNA and ATAC diversity between pseudobulk assigned clusters. e, Proportion of genes commonly up- or down-regulated by SI Arm TRM (blue) or SI Cl13 TR-TEX (pink) clusters compared to Arm Spl TCIRCM (Arm Spl TMEM and Arm Spl TEFF clusters). f, DEGs between SI Arm TRM (blue) and SI Cl13 TR-TEX (pink) clusters. Bar above shows the number of DEGs in pairwise comparison. g, Number of DACRs per gene loci between SI Arm TRM (blue) and SI Cl13 TR-TEX (pink) clusters. Bar above shows the number of DACRs in pairwise comparison. h, ATAC coverage plots of DACRs in indicated loci for assigned clusters. Peaks called are represented by bars below. Shading on plots or coloring of individual peaks indicates DACRs enriched in Arm Spl TMEM versus Arm TRM (green), Arm TRM versus Cl13 TR-TEX (blue) or Cl13 TR-TEX versus Arm TRM (pink) in at least one tissue. i, Motifs enriched in pairwise comparisons of tissue-matched TRM or TR-TEX clusters from each tissue (SI, Liv, SG) rank ordered by adjusted P value and motif deviation (Motif Dev.). k. RNA expression of indicated TFs (upper panel) and of genes in regulons predicted to be controlled by that TF via network analysis (positive regulon activity). Data are pooled from n = 20–25 mice per group, with significance in pairwise comparisons determined using a Wilcox Rank Sum Test (DEGs) or Logistic Regression Framework Test (DACRs, motifs). **** p < 0.01, two-sided Wilcox test.
Figure 3.
Figure 3.. Divergent developmental requirements of TRM and TR-TEX cells during residency programming.
a, RNA expression of TFs in TEA-seq clusters at 30 dpi. b, Experimental schematic for CRISPR-Cas9 TF editing in naïve P14 cells. Naïve CD45.1+CD45.1+ or CD45.1+CD45.2+ P14 cells were electroporated with single-guide (sg) RNAs directed towards control (Cd19) or target genes with Cas9 protein and adoptively co-transferred at a 50:50 ratio to CD45.2+ recipient mice that were then infected with Arm or Cl13. c, Ratio of co-transferred SI-derived CD69+CD103+ Arm TRM (blue), SI-derived CD69+CD103+ Cl13 TR-TEX (pink) or total Spl-derived (grey) P14 cells edited with Prdm1 or Runx3 sgRNAs versus control Cd19 sgRNAs at 30–37 dpi. d, Ratio of co-transferred Arm TRM (blue) or TR-TEX (pink) P14 cells edited with Zfp683 sgRNAs or control Cd19 sgRNAs in indicated tissues (SI, SG P14 gated on CD69+CD103+, Liv P14 gated on CD69+CXCR6+) compared to total Spl P14 cells (grey) >26dpi. e, Co-expression of tissue-residency markers CD69 and CD103 (SI, SG) or CD69 and CXCR6 (Liv) by P14 T cells edited with sgCd19 or sgZfp683 >26 dpi with Arm (blue) or Cl13 (pink). f, Ratio of total co-transferred P14 cells edited with Tox sgRNAs or control Cd19 sgRNAs from the Arm (blue) or Cl13 (pink) infected SI (colored) or spleen (grey) at 8 dpi. g, Co-expression of CD69 and CD103 by sgTox or sgCd19 edited SI P14 T cells at 8 dpi. h, Ratio of co-transferred SI-derived CD69+CD103+ Arm TRM (blue), SI-derived CD69+CD103+ Cl13 TR-TEX (pink) or total Spl-derived (grey) P14 cells edited with Tox sgRNAs or control Cd19 sgRNAs >30 dpi. i, Expression of indicated molecules in total P14 cells edited with Tox or control Cd19 targeted sgRNAs in SI or Spl at 8–9 dpi. h, Normalized fold-change (FC) in residency score (directionally weighted normalized mean expression of CD103, CD69, CD39, CD38, CXCR6, CD49a and Ly6C compared to sgCd19 control) in total P14 cells edited with TF-targeting sgRNAs at 8–9 dpi with Arm (blue) or Cl13 (pink). Values indicate extent to which combined expression of markers is regulated by indicated TF. Data are pooled from or representative of 2–3 independent experiments with n = 4–5 (c) or n = 4–8 mice (d-j) per group per timepoint. * p < 0.05, ** p < 0.01, *** p < 0.001, **** p < 0.0001 paired T test (spleen versus tissue P14s) or two-tailed T test (Arm versus Cl13 tissue P14s) (c, d, f, h) or Mann-Whitney Test (i, j).
Figure 4.
Figure 4.. TRM cells differentiate into heterogenous TEX cell subsets during chronic antigen exposure.
a, Experimental Schematic. Naïve CD45.1+ P14 cells were adoptively transferred to naïve CD45.2+ mice followed by Arm infection. Four to 6 wks pi, SI or Liv P14 TRM cells (CD69+CD103+ SI P14 cells or CD69+CXCR6+CD62L Liv P14 cells), Spl TCM cells (CD127+CD62L+ Spl P14 cells) or CD44lo naïve P14 cells were sort-purified and 5000–9000 cells from each population were adoptively transferred to separate naïve recipient mice that were then rechallenged with Arm or Cl13. P14 cells were re-isolated from the spleen 21–28 dpi for flow cytometric analysis. Donor infection-matched SI and Liv TRM cells that were not transferred to new recipients were also isolated for comparison (no rechallenge, no rch). b, Relative gMFI of indicated molecules expressed by rechallenged P14 T cells originating from indicated donor origin populations (input cell) following rechallenge (stimulation). c, Cytokine production by rechallenged P14 cells originating from indicated donor populations following stimulation with gp33–41 peptide in vitro. Statistics indicate pairwise comparisons between Arm and Cl13 rechallenged cells from same input population. d-e, UMAPs of rechallenged P14 cells colored by rechallenge virus (infection, d upper panel), by phenograph clusters annotated based on surface marker expression (annotated clusters, d lower panel) or colored by degree of surface molecule expression (e). f, UMAPs highlighting cells derived from indicated input origin populations (colored) following rechallenge with Arm (upper panel) or Cl13 (lower panel). g-i, Frequency of cells derived from indicated input origin populations (x axis) giving rise to TEX subsets after Cl13 rechallenge, identified by phenograph cluster (g, with same legend key as in d lower panel) or by conventional flow cytometry gating (h, i). Data are representative of 3 independent experiments (b, d-f, h), 2 independent experiments (c) or pooled from 2–3 independent experiments (g) with n = 3–5 (b, d-f), n = 4–5 (c), n = 4–5 (g-h). * p < 0.05, ** p < 0.01, *** p < 0.001, **** p < 0.0001 Mann Whitney Test (c), unpaired parametric T test or Kruskal Wallis Test (g).
Figure 5.
Figure 5.. TEX progenitors are unable to generate TRM cells but can give rise to TR-TEX cells.
a, Experimental Schematic. Naïve CD45.1+ P14 cells were adoptively transferred to naïve CD45.2+ recipient mice followed by infection with Cl13. Ly108+ TEX-PROG (split into CD69+ TEX-Progenitor 1 [TEX-Pr1] or CD69 TEX-Progenitor 2 [TEX-Pr2] populations), CD69Ly108 TEX-INT, CD69+Ly108 TEX-TERM from Spl and CD44lo naïve P14 cells were sort-purified 21–23 dpi and 10,000–15,000 cells from each population were adoptively transferred to separate congenic naïve mice that were then rechallenged with Arm. Sorted donor naïve or TEX P14 cells were re-isolated from the Spl and tissues 25–30 days post rechallenge. b, Absolute number of total P14 cells (left panel) or CD69+CD103+ P14 cells (right panel) derived from sorted naïve or TEX cell populations recovered from the SI of Arm rechallenged mice. c-e, Expression of indicated surface molecules by sorted naïve or TEX P14 cells rechallenged with Arm and recovered from the SI. f, Experimental Schematic. Naïve CD45.1+ P14 cells were adoptive transferred to CD45.2+ naïve recipient mice followed by infection with Cl13. TEX-PROG, TEX-INT, TEX-TERM from Spl and CD44lo naïve P14 cells gated as in a were sort-purified 21–23 dpi and 5000–10,000 cells from each population were adoptively transferred to separate congenic naïve recipient mice that were then rechallenged with Cl13. g, Absolute number of total P14 cells (left panel) or CD69+CD103+ P14 cells (right panel) recovered from the SI of Cl13 rechallenged mice. h-j, Expression of indicated surface molecules by sorted naïve or TEX cell populations rechallenged with Cl13 and recovered from the SI. k, Fold change in co-expression of CD69 and CD103 by TEX-derived SI P14 cells compared to naïve-derived SI P14 cells after Arm or Cl13 rechallenge. l, Naïve CD45.1+ P14 T cells were adoptively transferred to CD45.2+ recipient mice prior to infection with Arm or Cl13. Beginning 28–30 dpi, mice were treated with dasatinib or vehicle daily for 7d by oral gavage. Shown is the absolute number of CD69+CD103+ P14 T cells isolated from the SI or SG after treatment. Data are pooled from 2–3 independent experiments with n = 4–5 (b-e), n = 2–6 (g-k) or n = 5–8 (l) mice per group per experiment. * p < 0.05, ** p < 0.01, *** p < 0.001, **** p < 0.0001 unpaired parametric T test (l) or Kruskal Wallis Test (b, g, k).
Figure 6.
Figure 6.. Identification of core transcriptional programs that distinguish TRM from TR-TEX in inflamed tissues.
a, UMAP of inferred single-cell Gene Regulatory Network (GRN) based on combined TF expression and motif accessibility in all non-naïve P14 cells. Size of nodes (genes) represents number of connections. b, Individual UMAP embeddings of genes in GRN in b that are actively engaged in either SI TRM (left panel) or SI TR-TEX (right panel) cells. Node size and color scale represent RNA expression. c, Relative enrichment for GRN-derived modules highlighted in a (highly connected gene clusters) in TRM or TR-TEX across tissues. d, Enrichment score for published core TRM and TEX-TERM signatures compared to TRM-specific or TR-TEX-specific signatures in TEA-seq clusters. Dashed line indicates the median score in all plotted cells. e, RNA expression of genes selectively upregulated in TRM compared to TCIRCM and TR-TEX cells from matched tissues (TRM-specific signature) or selectively upregulated in TR-TEX compared to TCIRCM and TRM from matched tissues (TR-TEX-specific signature). Venn diagrams indicate genes shared between TRM or TR-TEX cells across tissues with genes included in each signature colored. Blue text labels: TFs; red text labels: surface proteins. f, Expression of CD73 and CD200R by CD69+CD103+ SI Arm TRM or SI Cl13 TR-TEX cells or by non-naïve CD8+CD69+CD103+KLRG1 T cells from human tonsil or skin, or in head and neck cancer (HNSCC) or melanoma tumors. g, Frequency of CD69+CD103+ P14 T cells (LCMV) or non-naïve CD8+CD69+CD103+KLRG1 T cells (human samples) expressing CD73 and CD200R. h, Experimental schematic. Naïve CD45.1+CD45.2+ OT-I T cells were adoptively transferred to naïve CD45.2+ recipient mice that were then infected with the LM-OVA InlAm by oral feeding. Thirty days after LM infection, congenically distinct CD45.1+CD45.1+ naïve P14 cells were adoptively transferred to the same mice that were then infected with Arm or Cl13 or left uninfected (no inf). Tissues were analyzed 30d after LCMV infection. i, j Expression of molecules in SI CD69+CD103+ OT-I TRM cells without LCMV infection (grey, LM only), after Arm infection (blue) or after Cl13 infection (pink) compared to SI CD69+CD103+ Arm P14 TRM cells from Arm infected mice (green) or SI CD69+CD103+ Cl13 P14 TR-TEX cells from LCMV Cl13 infected mice (purple). k, Co-expression of CD69 and CD103 by total OT-I T cells or P14 T cells isolated from LM and LCMV infected mice (top panel) and expression of CD73 and CD200R by each indicated CD69+CD103+ transgenic T cell population. Data are pooled from n = 20–25 mice per group (a-e), representative of at least 2 independent experiments with n = 4–5 mice per group or n = 5–7 patient samples per tissue (f, g) or representative of 2 independent experiments with n = 4–7 mice per group (i-k). * p < 0.05, ** p < 0.01, **** p < 0.001 Kruskal Wallis Test.
Figure 7.
Figure 7.. Differential contribution of TRM and TR-TEX cells to disease control.
a, Kaplan-Meier survival curves for overall survival of metastatic melanoma patients from the TCGA database stratifying by TRM and TR-TEX signatures (hi = top 25%, lo = bottom 25%) within CD8hi patients compared to CD8lo patients (hi = top 50%, lo = bottom 50% for CD8A expression). b, Kaplan-Meier survival curves for overall survival of triple-negative breast cancer (TNBC) patients from METABRIC database stratifying by TRM and TR-TEX signatures (hi = top 25%, lo = bottom 25%) within CD8hi patients compared to CD8lo patients (hi = top 50%, lo = bottom 50% for CD8A expression). c, Kaplan-Meier survival curves for overall survival of urothelial carcinoma patients treated with α-PDL1 from IMvigor210 database stratifying by ITGAE expression (left panel; hi = top 25%, lo = bottom 25%) or TRM and TR-TEX signatures (hi = top 10%, lo = bottom 10%). d, Kaplan-Meier survival curves for overall survival of melanoma patients treated with α-PD1 and/or α-CTLA479 stratifying by TRM and TR-TEX signatures (hi = top 25%, lo = bottom 25%). e, Experimental Schematic. Naïve CD45.1+ P14 cells were adoptively transferred to naïve CD45.2+ recipient mice prior to Arm or Cl13 infection. Daily i.p. treatments with FTY720 commenced 4 weeks p.i.. Three days after the first FTY720 treatment mice received one dose of α-PD-L1 or vehicle (PBS) i.p. with or without co-injection of 25μg gp33–44 peptide i.v. Tissues were collected 48h later and stimulated ex vivo with gp33–41 peptide. f, Frequency of CD69+CD103+ SI P14 TRM (Arm) or TR-TEX (Cl13) cells producing IFN-γ and TNF after α-PD-L1 treatment. g, h, Frequency of Arm TRM or Cl13 TR-TEX cells (CD69+CD103+ in SI or CD69+CXCR6+ in Kid) producing IFN-γ after α-PD-L1 treatment without (g) or with (h) i.v. gp33–41 peptide treatment. i, Viral titers in Cl13 infected FTY720-treated mouse tissues 48h after one dose of α-PD-L1. j, Model schematic. TRM and TR-TEX cells derive from divergent differentiation trajectories but acquire a common residency program. TRM cells maintain heightened plasticity potential whereas TR-TEX cells are responsive to PD-1 pathway blockade. Data are pooled from 2–3 independent experiments (f-i) with n = 4–8 (f-h) or n = 9–10 (i) mice per group. Shading on survival curves represents 50% confidence interval. * p < 0.05, ** p < 0.01, *** p < 0.001, **** p < 0.0001 Mann Whitney Test (g-i) or Kaplan-Meier estimate (a-d).

References

    1. Christo SN, Park SL, Mueller SN, Mackay LK. The Multifaceted Role of Tissue-Resident Memory T Cells. Annual Review of Immunology. 2024;42(1):317–345. - PubMed
    1. Szabo PA, Miron M, Farber DL. Location, location, location: Tissue resident memory T cells in mice and humans. Sci Immunol. Apr 5 2019;4(34)doi: 10.1126/sciimmunol.aas9673 - DOI - PMC - PubMed
    1. Milner JJ, Toma C, Yu B, et al. Runx3 programs CD8+ T cell residency in non-lymphoid tissues and tumours. Nature. 2017;552(7684):253–257. - PMC - PubMed
    1. Mackay LK, Minnich M, Kragten NAM, et al. Hobit and Blimp1 instruct a universal transcriptional program of tissue residency in lymphocytes. Science. 2016;352(6284):459–463. doi: 10.1126/science.aad2035 - DOI - PubMed
    1. Crowl JT, Heeg M, Ferry A, et al. Tissue-resident memory CD8(+) T cells possess unique transcriptional, epigenetic and functional adaptations to different tissue environments. Nat Immunol. Jul 2022;23(7):1121–1131. doi: 10.1038/s41590-022-01229-8 - DOI - PMC - PubMed

Publication types