[Preprint]. 2025 Oct 8:2025.08.07.669006.
doi: 10.1101/2025.08.07.669006.

Profibrotic monocyte-derived alveolar macrophages as a biomarker and therapeutic target in systemic sclerosis-associated interstitial lung disease

Nikolay S Markov  1 Anthony J Esposito  1   2 Karolina J Senkow  1 Maxwell Schleck  1 Luisa Cusick  1 Zhan Yu  1 Yuliana V Sokolenko  1 Estefani Diaz  1   3 Emmy Jonasson  3 Suchitra Swaminathan  1   3 Ziyan Lu  1 Radmila Nafikova  1 Samuel Fenske  1 Elsie G Bunyan  1 Xóchitl G Pérez-Leonor  1 Hiam Abdala-Valencia  1   2 Annette S Flozak  1 Nikita Joshi  1 A Christine Argento  1 Elizabeth S Malsin  1 Paul A Reyfman  1 Jonathan Puchalski  4 Mridu Gulati  4 Mary Carns  1   5 Kathleen Aren  5 Phillip Cooper  1   5 Natania S Field  5 Suror Mohsin  1 Malek Shawabkeh  1 Alexandra Soriano  5 Aaron N Gundersheimer  1 Isaac A Goldberg  5 Bailey Damore  5 Alec Peltekian  1   6 Ankit Agrawal  1   6 Crystal Cheung  7 Stephanie Perez  7 Shannon Teaw  7 Alyssa Williams  7 Nicolas Page  7 Sophia E Kujawski  7 William Odell  7 Baran Ilayda Gunes  7 Michelle Cheng  7 Morgan Emokpae  7 R Ian Cumming  8 Robert M Tighe  8 Kevin Grudzinski  1   9 Hatice Savas  10 Ami N Rubinowitz  11 Bashar A Kadhim  12 Chitaru Kurihara  2   13 Ankit Bharat  2   13 Vikas Mehta  14 Jane E Dematte  1   2 Bradford C Bemiss  1   2 Hadijat M Makinde  5 Carla M Cuda  5 Matthew Dapas  5 Carrie Richardson  5 Harris Perlman  5 Anna P Lam  1 Cara J Gottardi  1   2 G R Scott Budinger  1   2 Alexander V Misharin  1 Monique E Hinchcliff  7
Affiliations

Profibrotic monocyte-derived alveolar macrophages as a biomarker and therapeutic target in systemic sclerosis-associated interstitial lung disease

Nikolay S Markov et al. bioRxiv. .

Abstract

Interstitial lung disease (ILD) is present in over 60% of patients with systemic sclerosis (SSc) and is the leading cause of SSc-related deaths. Profibrotic monocyte-derived alveolar macrophages (MoAM) play a causal role in the pathogenesis of pulmonary fibrosis in animal models where their persistence in the niche requires signaling through Colony Stimulating Factor 1 Receptor (CSF1R). We hypothesized that the presence and proportion of MoAM in bronchoalveolar lavage (BAL) fluid from patients with SSc-ILD may be a biomarker of ILD severity. To test this hypothesis, we analyzed BAL fluid from 9 prospectively enrolled patients with SSc-ILD and 13 healthy controls using flow cytometry and single-cell RNA sequencing. Patients with SSc-ILD had more MoAM and interstitial macrophages in BAL fluid than healthy controls, and their abundance was associated with lung fibrosis severity. We identified changes in the MoAM transcriptome as a function of treatment with mycophenolate, an effective therapy for SSc-ILD. In SSc-ILD lung explants, spatial transcriptomics identified an expanded population of interstitial macrophages spilling into the alveolar space. Our findings suggest that the proportion of profibrotic MoAM and interstitial macrophages in BAL fluid may serve as a biomarker of SSc-ILD and credential them as possible targets for therapy.


Figures

Figure 1:
Figure 1:. The abundance of profibrotic monocyte-derived alveolar macrophages in BALF is associated with worse lung function in patients with SSc-ILD.
a. Uniform manifold approximation and projection (UMAP) plot showing integrated analysis of BAL immune cells from patients with SSc-ILD (n = 9) and healthy volunteers (n = 13). Tissue-resident alveolar macrophages (TRAM), monocyte-derived alveolar macrophages (MoAM), type I conventional DCs (DC1), type II conventional DCs (DC2), migratory dendritic cells (CCR7+ DC) and plasmacytoid dendritic cells (pDC). b. Heatmap of expression of macrophage subset-specific genes. c. Proportions of cell clusters represented in the UMAP in a, Mann-Whitney U tests with FDR correction. q-values < 0.05 are shown above each pair of boxplots. d. Hierarchical clustering on relative abundance of immune cell populations shows heterogeneity in sample composition within patients and controls. e. Scatter plot of proportion of monocyte and macrophage subsets and % of predicted forced vital capacity (FVC), Pearson correlation. Shaded area corresponds to the 95% confidence interval. f. Scatter plot of proportion of monocyte and macrophage subsets and the average fibrotic score on chest high-resolution computed tomography (HRCT), Pearson correlation. Shaded area corresponds to the 95% confidence interval.
Figure 2:
Figure 2:. Macrophage and T cell gene programs associate with SSc-ILD.
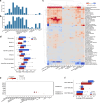
a. Number of differentially expressed genes (DEGs, q-value < 0.05) in different cell types between controls and patients. b. Percent of transcriptome within different cell types represented by DEGs. c. Heatmap illustrating enrichment for 50 hallmark gene sets from MSigDB in gene lists between controls and patients. Significant enrichments (q-value < 0.05) are indicated by asterisks. d. Average gene set score for genes from “interferon-gamma response” gene set in monocytes, macrophages, and DC2. q-value < 0.05 are shown next to pairs of boxplots (Mann-Whitney U tests with FDR correction). e. Dot plot illustrating expression of genes encoding type I, II, and III interferons in immune cells isolated from BALF. f. Expression of IFNG in T cell subsets isolated from BALF from controls and patients. q-value < 0.05 are shown next to pairs of boxplots (Mann-Whitney U tests with FDR correction).
Figure 3:
Figure 3:. Mycophenolate therapy is associated with transcriptomic changes in immune cells.
a. Heatmap illustrating enrichment for 50 hallmark gene sets from MSigDB in gene lists between patients on active therapy with mycophenolate and not. Significant enrichments (q-value < 0.05) are indicated by asterisks. b. Barplot of GO enrichment for “purine metabolism” gene set from KEGG database in DEGs upregulated with active mycophenolate therapy in macrophage subsets. c. MA plot of differential expression analysis between patients on active therapy with mycophenolate and not in CD4 TEM cells. Significant genes (q-value < 0.05) are highlighted in color. Selected genes of interest are labeled. Triangles indicate points that fall outside of the plotting window. d. MA plot of differential expression analysis between patients on active therapy with mycophenolate and not in profibrotic MoAM-3 cells. Significant genes (q-value < 0.05) are highlighted in color. Selected genes of interest are labeled. Triangles indicate points that fall outside of the plotting window.
Figure 4:
Figure 4:. Profibrotic SPP1+ MoAM represent a pathologic monocyte-to-macrophage differentiation trajectory in SSc-ILD.
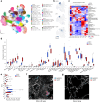
a. UMAP of macrophages and monocytes from Figure 1a with projected terminal states identified by CellRank 2. b. Average differentiation probability of monocytes, MoAM-1, and MoAM-2 subsets towards the combined TRAM terminal state. q-value < 0.05 are shown next to pairs of boxplots (Mann-Whitney U tests with FDR correction). c. Average differentiation probability of monocytes, MoAM-1, and MoAM-2 subsets towards the MoAM-3 profibrotic terminal state. q-value < 0.05 are shown next to pairs of boxplots (Mann-Whitney U tests with FDR correction). d. Heatmap of normalized expression of transcription factors in monocytes, MoAM subsets, and 50% of TRAM-1 selected randomly. Cells are ordered by pseudotime within each cluster, and expression is averaged over a window of 10 cells. e. Normalized average expression of transcription factor clusters for the cells in panel d. Shaded area represents 95% confidence interval.
Figure 5:
Figure 5:. Single-cell spatial profiling identifies niche for profibrotic SPP1+ MoAM.
a. UMAP plot showing integrated analysis of single-cell spatial data from patients with SSc-ILD (n = 4) and donors (n = 3). b. Expression plot for markers of TRAM (MARCO+SPP1–FOLR2–), MoAM (MARCO+SPP1+FOLR2–), and interstitial macrophages (MARCO–SPP1–FOLR2+) on the UMAP from panel a. c. Hierarchical clustering of cell type proportions for 5 lung slides from patients with SSc-ILD and 6 donor lung slides. Each row is normalized. Ward linkage over Euclidean distances. d. Comparison of proportions of cell clusters shown in panel a between lungs from donors and patients with SSc-ILD. q-value < 0.05 are shown above each pair of boxplots, Mann-Whitney U tests with FDR correction. e. Comparison of proportions of spatial niches between lungs from donors and patients with SSc-ILD. q-value < 0.05 are shown above each pair of boxplots, Mann-Whitney U tests with FDR correction. f. Representative Xenium image showing localization of MoAM in both alveolar and interstitial compartments in the lung from patient with SSc-ILD. Xenium probes for marker genes shown as colored dots. g. Representative Xenium image showing localization of MoAM in alveolar epithelial niche in the donor lung. Xenium probes for marker genes shown as colored dots. Cell outlines are shown using boundary stain from Xenium cell segmentation kit.
Figure 6:
Figure 6:. Transcriptionally distinct alveolar macrophage subsets are co-localized within the same alveoli.
a. Hierarchical clustering on abundance of immune cell composition in the alveolar spaces in the donor lungs shows that CCL3/4+ TRAM coexist together with CCL3/4− TRAM. Ward linkage over Euclidean distances. b. Violin plot of fractions of CCL3/4+ TRAM out of all TRAM per alveolus across donor samples. White dot indicated median value, black bar corresponds to first to third quartile range. c. Comparison of the number of monocytes, T cells, and neutrophils in alveoli with and without CCL3/4+ TRAM in the donor lungs. Pairwise Wilcoxon signed-rank tests with FDR correction. d. Comparison of the number of monocytes, T cells, and neutrophils in alveoli with and without MoAM in the donor lungs. Pairwise Wilcoxon signed-rank tests with FDR correction. e. Comparison of the number of monocytes and MoAM in alveoli with and without CCL2 expression in AT1 or AT2 cells. Pairwise Wilcoxon signed-rank tests with FDR correction.
Figure 7:
Figure 7:. Interstitial macrophages “spill” into alveolar space.
a. UMAP illustrating subsets of interstitial macrophages, reclustering of interstitial macrophage clusters from Figure 5a. b. Heatmap of expression of shared and unique genes among interstitial macrophage subsets and resident or monocyte-derived alveolar macrophages, each column represents a single donor or patient. c. Comparison of proportions of interstitial macrophage subsets between lungs from donors and patients with SSc-ILD. q-value < 0.05 are shown above each pair of boxplots, Mann-Whitney U tests with FDR correction. d. Representative Xenium image showing interstitial macrophages associated with blood vessel (arrow), alveolar parenchyma (double arrow), and alveolar space (arrowhead) of the donor lungs. Cell boundary stain from Xenium cell segmentation kit is shown. Each dot represents corresponding transcripts (see legend). Orange polygons represent interstitial macrophages as segmented by Xenium Ranger. e. Comparison of the number of monocytes, T cells, and neutrophils between alveoli with and without interstitial macrophages in the donor lungs. Pairwise Wilcoxon signed-rank tests with FDR correction.
Figure 8:
Figure 8:. Pharmacological targets in patients with SSc-ILD.
a. Dot plots illustrating expression of genes encoding ligands, receptors, or enzymes that are currently in clinical trials for patients with SSc-ILD. Reanalysis of publicly available data from patients with end-stage SSc-ILD. Significant differentially-expressed genes are outlined (see Figure S8c,d). b. Correlation between average expression of TNFSF15 in BALF and % of predicted forced vital capacity (FVC). Pearson correlation. Shaded area corresponds to the 95% confidence interval. c. Expression of CSF1R in subsets of alveolar and interstitial macrophages from BALF. Mann-Whitney U tests with FDR correction, ns: not significant, * q-value < 0.05, ** q-value < 0.01, *** q-value < 0.001.

References

    1. Denton CP, Wells AU, Coghlan JG. Major lung complications of systemic sclerosis. Nat Rev Rheumatol. 2018. Sep; 14(9):511–527. - PubMed
    1. Khanna D, Tashkin DP, Denton CP, Renzoni EA, Desai SR, Varga J. Etiology, Risk Factors, and Biomarkers in Systemic Sclerosis with Interstitial Lung Disease. Am J Respir Crit Care Med. 2020. Mar; 201(6):650–660. - PMC - PubMed
    1. George PM, Spagnolo P, Kreuter M, Altinisik G, Bonifazi M, Martinez FJ, Molyneaux PL, Renzoni EA, Richeldi L, Tomassetti S, Valenzuela C, Vancheri C, Varone F, Cottin V, Costabel U. Progressive fibrosing interstitial lung disease: clinical uncertainties, consensus recommendations, and research priorities. Lancet Respir Med. 2020. Sep; 8(9):925–934. - PubMed
    1. Pope JE, Denton CP, Johnson SR, Fernandez-Codina A, Hudson M, Nevskaya T. State-of-the-art evidence in the treatment of systemic sclerosis. Nat Rev Rheumatol. 2023. Apr; 19(4):212–226. - PMC - PubMed
    1. Misharin AV, Morales-Nebreda L, Reyfman PA, Cuda CM, Walter JM, McQuattie-Pimentel AC, Chen CI, Anekalla KR, Joshi N, Williams KJN, Abdala-Valencia H, Yacoub TJ, Chi M, Chiu S, Gonzalez-Gonzalez FJ, Gates K, Lam AP, Nicholson TT, Homan PJ, Soberanes S, Dominguez S, Morgan VK, Saber R, Shaffer A, Hinchcliff M, Marshall SA, Bharat A, Berdnikovs S, Bhorade SM, Bartom ET, Morimoto RI, Balch WE, Sznajder JI, Chandel NS, Mutlu GM, Jain M, Gottardi CJ, Singer BD, Ridge KM, Bagheri N, Shilatifard A, Budinger GRS, Perlman H. Monocyte-derived alveolar macrophages drive lung fibrosis and persist in the lung over the life span. J Exp Med. 2017. Aug; 214(8):2387–2404. - PMC - PubMed

Publication types