. 2025 Aug 26;122(34):e2514151122.
doi: 10.1073/pnas.2514151122. Epub 2025 Aug 20.

Monoamine-induced diacylglycerol signaling rapidly accumulates Unc13 in nanoclusters for fast presynaptic potentiation

Affiliations

Monoamine-induced diacylglycerol signaling rapidly accumulates Unc13 in nanoclusters for fast presynaptic potentiation

Natalie Blaum et al. Proc Natl Acad Sci U S A. .

Abstract

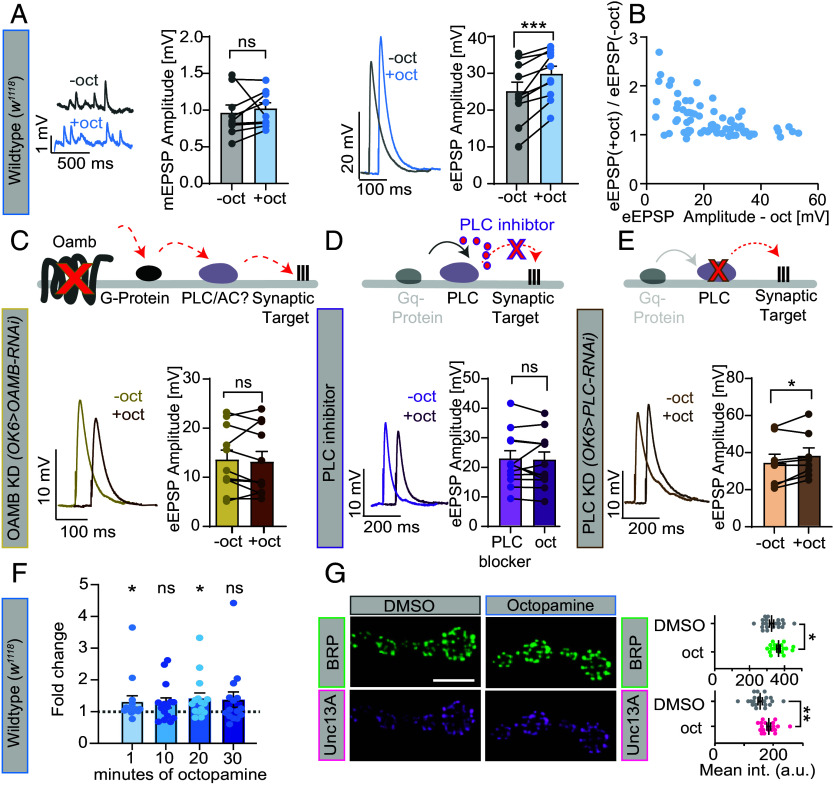
Neuromodulators control mood, arousal, and behavior by inducing synaptic plasticity via G-protein-coupled receptors. While long-term presynaptic potentiation requires structural changes, mechanisms enabling potentiation within minutes remain unclear. Using the Drosophila neuromuscular junction, we show that octopamine, the invertebrate analog of norepinephrine, potentiates evoked neurotransmitter release on the timescale of one minute via a G-protein-coupled pathway involving presynaptic OAMB receptors and phospholipase C. This fast potentiation correlates with elevated signals of the release factor Unc13A and the scaffolding protein Bruchpilot. Live, single-molecule imaging of endogenously tagged Unc13 revealed its instantly reduced motility and increased concentration in synaptic nanoclusters with potentiation. Presynaptic knockdown of Unc13A fully blocked fast potentiation. Moreover, deleting its N-terminal localization sequence mislocalized the protein fragment to the cytosol, but still allowed for rapid plasma membrane recruitment by diacylglycerol (DAG) analog phorbol esters and octopamine, implicating a role of more C-terminal domains. A point mutation of endogenous Unc13 in its DAG-binding C1 domain blocked plasticity-induced nanoscopic enrichment and synaptic potentiation. The mutation increased basal neurotransmission but reduced Unc13 levels, revealing a gain of function and potential homeostatic compensation. The mutation also blocked phorbol ester-induced potentiation, decreased the calcium sensitivity of neurotransmission, and caused short-term synaptic depression. Homeostatic potentiation induced by postsynaptic receptor block mirrored octopamine-induced Unc13 recruitment and required presynaptic OAMB receptors, indicating overlapping machinery. Thus, rapid Unc13 immobilization and nanoscale compaction are salient features of fast presynaptic potentiation.

Keywords: G-protein- coupled receptors; Munc13; Neuromodulation; neurotransmitter release; synaptic plasticity.


Conflict of interest statement

Competing interests statement:The authors declare no competing interest.

Figures

Fig. 1.
Fig. 1.
1-min octopamine treatment potentiates neurotransmitter release dependent on OAMB receptors and phospholipase C and rapidly enhances BRP and Unc13A AZ signals. (A, Left) Representative example traces of spontaneous mEPSPs from wildtype larvae (Ctrl, w1118) before (gray, Top) and 1-min after 20 µM octopamine incubation (blue, Bottom) together with a cell-wise quantification of mEPSP amplitudes before (−oct, gray) and 1 min after incubation with 20 µM octopamine (+oct, blue). (Right) Representative eEPSP responses from control synapses before (gray) and after octopamine incubation (blue) and quantification of eEPSP amplitudes (−oct, gray; +oct, blue). (B) Fold-change of eEPSP amplitudes after/before octopamine in control animals as a function of the eEPSP amplitude before treatment (data pooled from experiments with 0.4 mM and 0.2 mM external Ca2+). (C, Top) Illustration OAMB knockdown approach. Below: Representative eEPSP responses following OAMB receptor knockdown (KD) in type I motoneurons (OK6-Gal4>UAS-OAMB-RNAi) before (yellow) and 1-min after incubation with 20 µM octopamine (+oct, brown) (for genetic control experiments, please see SI Appendix, Fig. S1G). (D, Top) Illustration of PLC inhibition. Below: Representative eEPSP responses from wildtype (w1118) larvae with 1-min PLC inhibitor incubation (U73122, 1 µM; light purple) and followed by 1-min incubation with 20 µM octopamine (dark purple) with quantification of eEPSP amplitudes. For control experiments using a control drug, see SI Appendix, Fig. S2B. (E) Same as (C) for PLC knockdown (KD, OK6-Gal4>UAS-PLC-RNAi). (F) Fold-change of eEPSP amplitudes from wildtype larvae after/before octopamine treatment for 1, 10, 20, and 30 min of octopamine incubation. (G, Left) Representative confocal images of muscle 4 NMJs from wildtype Drosophila larvae (w1118) labeled with antibodies against BRP (green, Top) and Unc13A (pink, Bottom) either treated for 1 min with Dimethyl Sulfoxide (DMSO) or octopamine in DMSO (20 µM). (Right) Quantification of BRP and Unc13A AZ intensities. Current clamp recordings (A, C, D, and E) were performed on muscle 6 NMJs in the presence of 0.4 mM extracellular Ca2+. Number of cells (n) and animals (N) investigated: n/N(Wildtype, A) = 12/12; n/N(Wildtype, B) = 70/70; n/N(OAMB KD, C) = 11/11; n/N(PLC inhibitor, D) = 12/12; n/N(PLC KD, E) = 8/8; n/N(Wildtype, F) = 15/15 n/N(DMSO, G) = 21/7, n/N(octopamine, G) = 19/7. For exact genotypes, see Material and Methods. Data depict mean values ± SEM. Statistical analysis with paired parametric t tests (A, C, D, and E), Friedman test (F), or unpaired t test (G). For details, see SI Appendix, Table S2. n.s., P > 0.05; *P 0.05; **P 0.01; ***P 0.001. [Scale bars: 5 µm (G).]
Fig. 2.
Fig. 2.
Live in vivo imaging of endogenously tagged Unc13 molecules reveals their immobilization and compaction upon acute octopamine treatment. (A) Scheme of Unc13A and Unc13B protein illustrating the mEOS3.2 tagging. (B and C) Cumulative intensity Images from live sptPALM recordings of Unc13mEOS3.2 show boutons before (B, −Oct) and after (C, +Oct) 1-min octopamine (20 μM) incubation. (D and E) PALM localization maps of the same boutons before (D, -Oct) and after (E, +Oct) octopamine treatment. (F and G) trajectory maps before (F, -Oct) and after (G, +Oct) treatment. (HK) Tessellation analysis representation of a bouton (H and I) and individual AZs depicting AZ cluster (black) and nanocluster (NC, red) boundaries. (L and M) Quantification of diffusion coefficients (L) and radii of confinement (M) before (−Oct, gray) and after (+Oct, blue) treatment. (N and O) Quantification of Unc13mEOS3.2 localizations within AZ cluster boundaries (black border in J and K) for diameter (N) and localization density (O) before (−Oct, gray) and after (+Oct, blue) treatment. (P and Q) same as (N and O) for nanocluster boundaries (red border in J and K). Number of NMJs (n), animals (N), AZs (X), and individual trajectories (Y) investigated: n/N/X/Y(−Oct) = 7/7/106/2051; n/N X/Y (+Oct) = 7/7/86/2505; Data depict mean values ± SEM. Statistical significance is denoted as asterisks: **P < 0.01, ***P < 0.001, and ****P < 0.0001. Data distribution was statistically tested with a Kolmogorov–Smirnov test. For details, see SI Appendix, Table S6. AU, arbitrary units. [Scale bars, 1 μm (BG) and 50 nm (H and I).]
Fig. 3.
Fig. 3.
Octopamine-induced synaptic potentiation requires Unc13A, and a C-terminal Unc13 fragment is recruited to the plasma membrane by octopamine dependent on the OAMB receptor. (A) Scheme of Unc13A and -B isoforms and the RNAi approach for Unc13A knockdown. (B) Representative eEPSP responses and cell-wise comparison of eEPSP amplitudes in control (Ctrl) synapses before (−oct, gray) and after octopamine incubation (+oct, blue). (C) same as (B) following Unc13A knockdown (Unc13A KD, −oct, light pink; +oct, pink). (D) Scheme of truncated Unc13 fragment with C-terminally fused GFP. (E, Left) Representative confocal NMJ images of GFP signal at muscle 4 NMJs (segment A3–5) presynaptically expressing the labeled Unc13 fragment. Larvae were either incubated with DMSO alone (DMSO, 1 min, gray), with PMA (2 µM, 10 min, black), or octopamine (+oct, 20 µM, 1 min, blue). GFP intensity profiles were collected at dashed lines. (Middle) Line profiles from respective images representing Unc13-GFP fluorescent intensities. The ratio between highest and lowest intensities (filled/open arrows) was quantified (Material and Methods). (Right) Quantification of intensity ratios across NMJs. (F) Same as E, but following motoneuron OAMB knockdown treated either with DMSO alone (DMSO, 1 min, yellow) or octopamine (20 µM, 1 min, brown). Number of cells (n) and animals (N) investigated: n/N[Ctrl (UAS-Unc13A-RNAi), B] = 9/9; n/N(Unc13A KD, C) = 8/8; n/N(DMSO, E) = 9/3; n/N(PMA, E) = 8/3; n/N(oct, E) = 9/3; n/N(DMSO OAMB KD, F) = 23/8; n/N(oct OAMB KD, F) = 22/8. For exact genotypes, see Material and Methods. Data depict mean values ± SEM. Statistical analysis with unpaired, Mann–Whitney U test (E and F) or with paired parametric t tests (B and C). For details, see SI Appendix, Table S11. n.s., P > 0.05; *P 0.05; ***P 0.001. [Scale bar in (F and G): 5 µm.]
Fig. 4.
Fig. 4.
Enhanced neurotransmitter release, reduced Unc13A signals, and diminished octopamine-induced potentiation in Unc13-C1HK and Unc13-C2BKW mutants. (A) Schematic representation of Unc13-C2BKW (K1862W in Unc13A) mutant. (B, Left) representative traces of spontaneous mEPSPs from wildtype (Ctrl, w1118, gray) and Unc13-C2BKW (light green) mutant synapses with cell-wise quantification of mEPSP amplitudes. (Right) Representative AP-evoked eEPSP responses from wildtype (Ctrl, w1118, gray) and Unc13-C2BKW (light green)mutant synapses with cell-wise quantification of eEPSP amplitudes. (C) Representative confocal images (Left) of muscle 4 NMJs from wildtype (Ctrl, w1118, gray) and Unc13-C2BKW (light green label) stained with antibodies against BRP (green, Top) and the N-terminal region of Unc13A (magenta, Bottom, see Material and Methods). (Right) Quantification of mean BRP (Top) and Unc13A (Bottom) intensities. (DF) same as (AC) for the Unc13-C1HK (H1723K in Unc13A) mutant (traces and labels in light red). (G and H, Left) Representative traces of spontaneous mEPSPs and cell-wise quantification of mEPSP amplitudes before (−oct, light green/red) and 1-min after 20 µM octopamine (+oct, dark green/red) at Unc13-C2BKW (G, green) or Unc13-C1HK (H, red) mutant synapses. (Right) Representative AP-evoked eEPSP responses before octopamine (−oct, light green/light red) and after 1-min incubation with 20 µM octopamine (+oct, dark green/dark red) and quantification of eEPSP amplitudes at Unc13-C2BKW (G, green) or Unc13-C1HK (H, red) mutant synapses. (B, E, G, and H) Current clamp analysis (muscle 6 NMJs, 0.4 mM extracellular Ca2+). Number of cells (n) and animals (N) investigated: n/N: n/N(Ctrl for Unc13-C2BKW, B) = 10/10 (eEPSP) and 9/9 (mEPSP), n/N(Unc13-C2BKW, B and G) = 8/8(eEPSP) and 8/8 (mEPSP), n/N(Ctrl for Unc13-C HK, E) = 12/12 (eEPSP) and 12/12 (mEPSP), n/N(Unc13-C1HK, E and H) = 11/11, n/N(Ctrl, C) = 15/5; n/N(Unc13-C2BKW, C) = 15/5, n/N(Ctrl, F) = 24/8, n/N(Unc13-C1HK, F) = 23/8. For exact genotypes, see Material and Methods. Data depict mean values ± SEM. Statistical analysis with unpaired, Mann–Whitney U test (B, C, E, and F) or with paired parametric t tests (G and H). For details, see SI Appendix, Table S13. n.s., P > 0.05; *P 0.05; **P 0.01. [Scale bar in (C and F): 5 µm.]
Fig. 5.
Fig. 5.
The Unc13-C1HK mutation enhances immediate neurotransmitter release at physiological Ca2+ concentrations and below, abolishes short-term facilitation, and blocks phorbol ester–induced potentiation (A) Representative example TEVC traces displaying AP-evoked responses to paired AP stimulation (10 ms interstimulus interval) from a single wildtype (Ctrl, w1118, gray) and Unc13-C1HK (red) NMJs, acquired at progressively increasing extracellular Ca2+ concentrations ([Ca2+]E). Quantification of first (B) eEPSC1 amplitudes and (C) PPRs in Ctrl (gray) and Unc13-C1HK (red) conditions. (D and E) Analysis of PMA-potentiation in Ctrl (D, w1118) and Unc13-C1HK (E) animals at 0.4 mM extracellular Ca2+ concentration. (Left) Representative traces of AP-evoked paired-pulse responses recorded after a 10-min preincubation with either DMSO (−PMA) or 2 μM PMA in DMSO (+PMA). Middle: quantification of eEPSC1 amplitudes. (Right) quantification of PPR (PPR = eEPSC2/eEPSC1) (10 ms interstimulus interval [ISI]). Number of cells (n) and animals (N) investigated: n/N: n/N(Ctrl, B and C) = 12/12, n/N(Unc13-C1HK, E) = 12/12, n/N(Ctrl -PMA, D) = 19/9, n/N(Ctrl +PMA, D) = 26/11, n/N(Unc13-C1HK −PMA, E) = 17/7, n/N(Unc13-C1HK +PMA, E) = 21/7. For exact genotypes, see Material and Methods. Data depict mean values ± SEM. Statistical analysis with Mann–Whitney U test (en rule) (BE). For details, see SI Appendix, Table S17. n.s., P > 0.05; *P 0.05; **P 0.01; ***P 0.001.
Fig. 6.
Fig. 6.
Live in vivo imaging of Unc13-C1HKmEOS reveals loss of octopamine-induced Unc13 compaction at AZs. (A) Scheme of Unc13A protein showing its regulatory domains and the C-terminal mOES3.2 tag of endogenous Unc13. The arrow indicates the amino acid change in the C1 domain in the Unc13-C1HK mutant protein. (BK) Genotype comparison between Unc13mEOS3.2 and Unc13-C1HKmEOS3.2. (LU) Comparison of Unc13-C1HKmEOS3.2 before (−oct) and after (+oct) a 1-min octopamine. (B, C, L, and M) trajectory maps. (D, E, N, and O) Tessellation representation of AZ cluster (black) and nanocluster (NC, red). (F, G, P, and Q) Quantification of diffusion coefficients and radii of confinement. Tessellation analysis for diameters and localization densities within AZ (H, I, R, and S) and NC cluster (J, K, T, and U) boundaries. Number of NMJs (n), animals (N), number of AZs (X), and the number of individual trajectories (Y) investigated: experiment 1: n/N/X/Y (Unc13-C1 HKmutant-Oct) = 10/6/108/5832; n/N/X/Y (Unc13-C1 HK mutant +Oct) = 10/6/111/2306 and experiment 2: n/N/X/Y (Unc13-C1 HKmutant-Oct) = 6/6/45/264; n/N/X/Y (Unc13-C1HKmutant +Oct) = 7/7/52/183. Statistical significance is denoted as asterisks: **P < 0.01, ***P < 0.001, and ****P < 0.0001. Data distribution was statistically tested with a Kolmogorov–Smirnov test. For details, see SI Appendix, Table S19. AU, arbitrary units. [Scale bars, 1 μm (B and C) and 50 nm (D and E).]
Fig. 7.
Fig. 7.
PHP depends on the expression of the OAMB receptor in motoneurons. (A and B) Analysis of PhTx effects in current clamp recordings (muscle 6 NMJs, 0.2 mM extracellular Ca2+) of spontaneous and AP-evoked synaptic activity in control animals (UAS-OAMB-RNAi, A) and OAMB KD animals (OK6-GAL4>UAS-OAMB-RNAi, B). (Left) Representative example traces of mEPSPs and cellwise quantification of mEPSP amplitudes from control (UAS-OAMB-RNAi, A) or Oamb KD animals (OK6-GAL4>UAS-OAMB-RNAi, B) after 10 min incubation either with 20 μM PhTx (+PhTx) or without (−PhTx). Middle: Representative eEPSP responses (average of five repetitions in one cell) from control synapses −PhTx (gray/yellow) or +PhTx (orange, red) and quantification of eEPSP amplitudes (−PhTx, gray/yellow; +PhTx, orange/red), and the quantal content (eEPSP/mEPSP) with and without 10-min 20 µM PhTx treatment. Number of cells (n) and animals (N) investigated: n/N(UAS-OAMB-RNAi −PhTX) = 25/9, n/N(UAS-OAMB-RNAi +PhTX) = 24/8, n/N(OK6-GAL4>UAS-OAMB-RNAi −PhTx) = 24/8; n/N(OK6-GAL4>UAS-OAMB-RNAi −PhTx) = 19/7 For exact genotypes, see Material and Methods. Data depict mean values ± SEM. Statistical analysis with unpaired, t test. For details, see SI Appendix, Table S22. n.s., P > 0.05; *P 0.05; **P 0.01.

Similar articles

References

    1. Rizo J., Molecular mechanisms underlying neurotransmitter release. Annu. Rev. Biophys. 51, 377–408 (2022). - PMC - PubMed
    1. Sudhof T. C., Neurotransmitter release: The last millisecond in the life of a synaptic vesicle. Neuron 80, 675–690 (2013). - PMC - PubMed
    1. Walter A. M., Bohme M. A., Sigrist S. J., Vesicle release site organization at synaptic active zones. Neurosci. Res. 127, 3–13 (2018). - PubMed
    1. Südhof T. C., The presynaptic active zone. Neuron 75, 11–25 (2012). - PMC - PubMed
    1. Böhme M. A., et al. , Rapid active zone remodeling consolidates presynaptic potentiation. Nat. Commun. 10, 1085 (2019). - PMC - PubMed

MeSH terms

LinkOut - more resources