. 2025 Aug 26;122(34):e2420793122.
doi: 10.1073/pnas.2420793122. Epub 2025 Aug 20.

Macrophage TBK1 signaling drives the development and outgrowth of breast cancer brain metastasis

Affiliations

Macrophage TBK1 signaling drives the development and outgrowth of breast cancer brain metastasis

Fatima Khan et al. Proc Natl Acad Sci U S A. .

Abstract

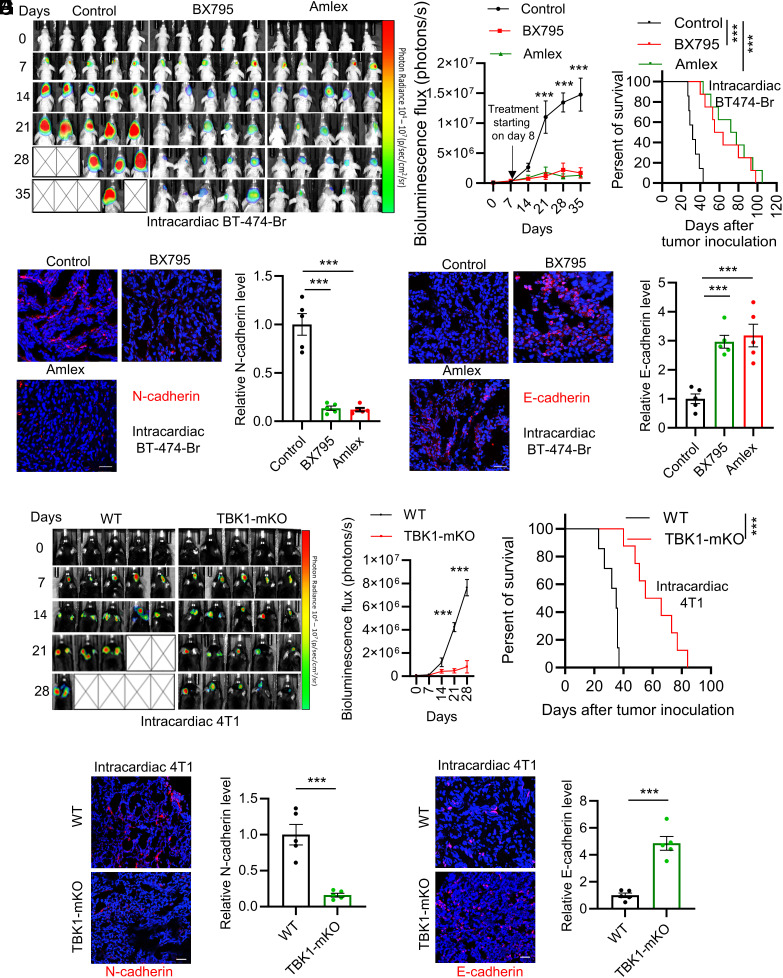
Tumor-associated macrophages (TAMs) are the predominant immune cells in the tumor microenvironment that promote breast cancer brain metastasis (BCBM). Here, we identify TANK-binding kinase (TBK1) as a critical signaling molecule enriched and activated in TAMs of BCBM tumors, playing an indispensable role in BCBM development and metastatic outgrowth in the brain. Mechanistically, BCBM cell-secreted matrix metalloproteinase 1 binds to protease-activated receptor 1 and integrin αVβ5 on macrophages, leading to TBK1 activation mediated by the nuclear factor-kappa B pathway. Reciprocally, TBK1-regulated TAMs produce granulocyte-macrophage colony-stimulating factor (GM-CSF) to drive breast cancer cell epithelial-mesenchymal transition, migration, and invasion, ultimately contributing to BCBM development and brain metastatic outgrowth. Inhibition of TBK1 signaling in TAMs or GM-CSF receptor in cancer cells impedes BCBM development and brain metastatic outgrowth. Correspondingly, the TBK1-GM-CSF signaling axis correlates with lower overall survival in patients with BCBM. Thus, TBK1-mediated tumor-TAM symbiotic interaction provides a promising therapeutic target for patients with BCBM.

Keywords: GM-CSF; TBK1; brain metastasis; breast cancer; macrophages.


Conflict of interest statement

Competing interests statement:The authors declare no competing interest.

Figures

Fig. 1.
Fig. 1.
TBK1 signaling is enriched and activated in TAMs of BCBM tumors. (A) GSEA for TBK1 signature in 19 HER2+ human BCBM tumors versus 19 HER2+ primary breast patient tumors (GSE43837). Normalized enrichment score (NES) and false discovery rate (FDR) values are shown. (B and C) Overall survival (B) and brain metastasis-free survival (C) of patients with BCBM expressing high (n = 5) and low (n = 16) TBK1 signature. (D) T-distributed stochastic neighbor embedding (t-SNE) map of the location-averaged transcriptome for BCBM tumors (GSE234832) colored by indicated major cell populations. (E) Heat map showing the expression of TBK1 signature in different cell populations of BCBM tumors (GSE234832). Yellow indicates high expression, black indicates low expression. (F) Representative immunofluorescence for Mac-2 and P-TBK1 in human BCBM tumors. (Scale bar, 50 µm.) (G) Correlation between Mac-2 and P-TBK1 in human BCBM tumors (n = 24). R and P values are shown. (H) Immunoblots of P-TBK1, TBK1, and Actin in THP1 macrophages treated with or without conditioned media (CM) from MDA-MB-231 and MDA-MB-231-Br cells. (I) Immunoblots of P-TBK1, TBK1, and Actin in THP1 macrophages treated with or without CM from BT-474 and BT-474-Br cells. (J) Immunoblots of P-TBK1, TBK1, and Actin in Raw264.7 macrophages treated with or without CM from 4T1 cells. (K) Representative and quantification of flow cytometry analysis for the percentage of CD45+CD11b+CD68+, CD45+CD11b+CD68+CD206+, and CD45+CD11b+CD68+CD206 macrophages in intracranial 4T1 tumors (n = 3).
Fig. 2.
Fig. 2.
TBK1 signaling in TAMs promotes breast cancer cell EMT, migration, and invasion. (A) Schematic illustration of investigating the effects of TBK1-regulated TAMs on breast cancer cell EMT, migration, and invasion. Macrophages are treated with the CM from cancer cells, and then the CM from these tumor cell-educated macrophages (T-CM) treated with or without TBK1 inhibitor (TBK1i) are used to incubate breast cancer cells for investigating the role of TAMs in breast cancer cell EMT, migration, and invasion. (B and C) RT-qPCR for VIM in MDA-MB-231-Br cells (B) and 4T1 cells (C) treated with the T-CM of THP1 and Raw264.7 macrophages, respectively, in the presence or absence of TBK1 inhibitor BX795 (1 µM) or Amlex (25 µM). n = 6. (D and E) RT-qPCR for CDH1 in MDA-MB-231-Br cells (D) and 4T1 cells (E) treated with the T-CM of THP1 and Raw264.7 macrophages, respectively, in the presence or absence of BX795 (1 µM) or Amlex (25 µM). n = 6. (F and G) Immunoblots of Vimentin, N-cadherin, E-cadherin, and Actin in MDA-MB-231-Br (F) and 4T1 (G) cells treated with the T-CM of THP1 and Raw264.7 macrophages, respectively, in the presence or absence of BX795 (1 µM) or CMPD-1 (0.5 µM). (H) Immunoblots of TBK1 and Actin in TPH1 macrophages expressing shRNA control (shC) or TBK1 shRNAs (shTBK1), and Vimentin, N-cadherin, E-cadherin, and Actin in MDA-MB-231-Br cells treated with the T-CM from shC and shTBK1 THP1 macrophages. (I) Immunoblots of TBK1 and Actin in shC and shTbk1 Raw264.7 macrophages, and of vimentin, N-cadherin, E-cadherin, and Actin in 4T1 cells treated with the T-CM from shC and shTbk1 Raw264.7 macrophages. (JM) Representative images and quantification of relative migration (J and K) or invasion (L and M) of MDA-MB-231-Br cells (J and L) or 4T1 cells (K and M) following stimulation with T-CM of primary human BMDMs (J and L) treated with or without TBK1 inhibitor BX795 (1 µM) or CMPD-1 (0.5 µM) or mouse BMDMs (K and M) isolated from WT and TBK1-mKO mice. (Scale bar, 400 µm.) n = 5 (J and L) or 3 (K and M).
Fig. 3.
Fig. 3.
BCBM-derived MMP1 activates TBK1 in TAMs to promote tumor cell EMT, migration, and invasion. (A) Schematic illustration of identifying the secreted protein that is highly expressed in MDA-MB-231-Br cells compared to MDA-MB-231 cells. (B) Immunoblots of MMP1 and Actin in MDA-MB-231-Br, MDA-MB-231, BT-474-Br, and BT-474 cells. (C and D) Immunoblots of P-TBK1, TBK1, and Actin in THP1 (C) and Raw264.7 (D) macrophages treated with or without MMP1 proteins (10 µg/ml). (E and F) Immunoblots of P-TBK1, TBK1, and Actin in THP1 (E) and Raw264.7 (F) macrophages treated with the CM of MDA-MB-231-Br and 4T1 cells, respectively, in the presence or absence of PAR1 antagonist (PAR1i) MK-5348 (1 µM). (G and H) Immunoblots of P-TBK1, TBK1, P-P65, P65, and Actin in THP1 (G) and Raw264.7 (H) macrophages treated with or without MMP1 proteins (10 µg/mL) in the presence or absence of P65 inhibitor (P65i) SC75741 at indicated concentrations. (I and J) Immunoblots of P-TBK1, TBK1, P-P65, P65, and Actin in THP1 (I) and Raw264.7 (J) macrophages treated with or without MMP1 proteins (10 µg/mL) in the presence or absence of integrin αVβ5 inhibitor (αVi) MK-0429 at indicated concentrations. (K and L) Immunoblots of Vimentin, N-cadherin, E-cadherin, and Actin in MDA-MB-231-Br (K) and 4T1 (L) cells treated with the CM of MMP1-educated THP1 and Raw264.7 macrophages, respectively, in the presence or absence of MK-5348 (1 µM), BX795 (1 µM), or CMPD-1 (0.5 µM). (M and N) Representative images and quantification of relative migration (M) or invasion (N) of MDA-MB-231-Br cells (n = 3) following stimulation with the CM of MMP1-educated THP1 macrophages in the presence or absence of MK-5348 (1 µM), BX795 (1 µM), or CMPD-1 (0.5 µM). (Scale bar, 400 µm.)
Fig. 4.
Fig. 4.
Inhibition of TBK1 reduces BCBM development and breast cancer cell EMT in vivo. (A and B) Representative bioluminescence images and quantification (A) and survival curves (B) of the nude mice (n = 7 to 8) that were intracardiacally injected with 1 × 10⁵ BT-474-Br cells and treated with or without TBK1 inhibitor BX795 (20 mg/kg, i.p., every other day for eight doses) or Amlexanox (Amlex, 50 mg/kg, i.p., every other day for eight doses) beginning at day 8 post-orthotopic injection. Bioluminescence imaging was taken at indicated days. (C and D) Representative and quantification of immunofluorescence staining for N-cadherin (C) or E-cadherin (D) in BT-474-Br tumors (n = 5) treated with or without BX795 or Amlex. (Scale bar, 100 µm.) (E and F) Representative bioluminescence images and quantification (E) and survival curves (F) of WT and TBK1-mKO mice (n = 7 to 8) that were intracardiacally injected with 1 × 10⁵ 4T1 cells. Bioluminescence imaging was taken at indicated days. (G and H) Representative and quantification of immunofluorescence staining for N-cadherin (G) or E-cadherin (H) in 4T1 BCBM tumors (n = 5) from WT and TBK1-mKO mice. (Scale bar, 100 µm.)
Fig. 5.
Fig. 5.
TBK1-regulated GM-CSF in TAMs promotes BCBM. (A) Representative of human cytokine antibody array in THP1 macrophages treated with or without the CM from MDA-MB-231-Br cells in the presence or absence of TBK1 inhibitor BX795 (1 µM). Affected cytokines/factors are indicated. (B) RT-qPCR for CSF2, CCL2, IL18, IL12, and IL32A in THP1 macrophages (n = 6) treated with the CM from MDA-MB-231-Br in the presence or absence of TBK1 inhibitor BX795 (1 µM), CMPD-1 (0.5 µM), or Amlex (25 µM). The values were expressed as the fold change. (C) RT-qPCR for Csf2, Ccl2, Il18, Il12, and Il32a in primary BMDMs (n = 6) isolated from WT and TBK1-mKO mice treated with or without the CM from 4T1 cells. (D) Immunoblots of Vimentin, N-cadherin, E-cadherin, and Actin in MDA-MB-231-Br cells and 4T1 cells treated with the T-CM of THP1 and Raw264.7 macrophages, respectively, expressing shC and CSF2 shRNAs (shCSF2). CM from tumor cell-educated macrophages is defined as T-CM. (E) Representative images and quantification of relative migration of MDA-MB-231-Br cells or 4T1 cells (n = 3) following the stimulation with T-CM of THP1 or Raw264.7 macrophages, respectively, expressing shC and shCSF2. (Scale bar, 400 µm.) (F) Representative images and quantification of relative invasion of MDA-MB-231-Br cells and 4T1 cells (n = 3) following the stimulation with T-CM of THP1 and Raw264.7 macrophages, respectively, expressing shC and shCSF2. (Scale bar, 400 µm.) (G and H) ELISA for GM-CSF in the CM of number-matched THP1 macrophages (n = 3) treated with the CM from MDA-MB-231-Br cells (G) or BT-474-Br cells (H) in the presence or absence of BX795 (1 µM) and Amlex (25 µM). (I) ELISA for GM-CSF in the human plasma samples from healthy controls (n = 10) and BCBM patients (n = 57). (J and K) Representative bioluminescence images and quantification (J) and survival curves (K) of Balb/c mice (n = 8) intracardiacally injected with 1 × 10⁵ shC and Csf2ra shRNA (shCsf2ra) 4T1 cells. Bioluminescence imaging was taken at indicated days.
Fig. 6.
Fig. 6.
Inhibition of TBK1 and CSF2RA reduces tumor outgrowth in established BCBM mouse models. (A and B) Survival curves of nude mice (n = 10) implanted intracranially with 2 × 10⁴ MDA-MB-231-Br cells (A) or BT-474-Br cells (B) and treated with or without TBK1 inhibitor BX795 (20 mg/kg, i.p., every other day for eight doses) or Amlexanox (Amlex, 50 mg/kg, i.p., every other day for eight doses) beginning at day 8 post-orthotopic injection. (C) Survival curves of Balb/c mice implanted intracranially with 4T1 cells (2 × 10⁴ cells) and treated with or without BX795 and Amlex beginning at day 8 post-orthotopic injection (n = 10). (D) Survival curves of WT and TBK1-mKO mice (n = 7 to 10) implanted intracranially with 2 × 10⁴ 4T1 cells. (E) Survival curves of Balb/c mice (n = 7) implanted intracranially with 4T1 cells (2 × 10⁴ cells) expressing shC and Csf2ra shRNA (shCsf2ra). (F and G) Representative and quantification of immunohistochemistry for Ki67 (F) and cleaved Caspase-3 (CC3) (G) in 4T1 tumors (intracranial implantation, n = 3) from WT and TBK1-mKO mice. (Scale bar, 100 µm.) (H and I) Representative and quantification of immunofluorescence for Ki67 (H) and CC3 (I) in 4T1 tumors (intracranial implantation, n = 3) expressing shC and shCsf2ra. (Scale bar, 75 µm.) (J and K) Representative bioluminescence images and quantification (J) and survival curves (K) of Balb/c mice (n = 5) intracranially injected with 2 × 10⁴ 4T1 cells. Mice were treated radiation (2.5 Gy by X-RAD320 Irradiator for 4 d) in the presence or absence of BX795 or Amlex beginning at day 8 postorthotopic injection. Bioluminescence imaging was taken at indicated days.

References

    1. Kim J. S., Kim I. A., Evolving treatment strategies of brain metastases from breast cancer: Current status and future direction. Ther. Adv. Med. Oncol. 12, 1758835920936117 (2020). - PMC - PubMed
    1. Niikura N., et al. , Treatment outcomes and prognostic factors for patients with brain metastases from breast cancer of each subtype: A multicenter retrospective analysis. Breast Cancer Res. Treat. 147, 103–112 (2014). - PubMed
    1. Darlix A., et al. , Impact of breast cancer molecular subtypes on the incidence, kinetics and prognosis of central nervous system metastases in a large multicentre real-life cohort. Br. J. Cancer 121, 991–1000 (2019). - PMC - PubMed
    1. Ferguson S. D., et al. , Profiles of brain metastases: Prioritization of therapeutic targets. Int. J. Cancer 143, 3019–3026 (2018). - PMC - PubMed
    1. Quail D. F., Joyce J. A., Microenvironmental regulation of tumor progression and metastasis. Nat. Med. 19, 1423–1437 (2013). - PMC - PubMed

MeSH terms

Substances

LinkOut - more resources