. 2025 Sep 1;82(3):638-654.
doi: 10.1097/HEP.0000000000001065. Epub 2024 Aug 27.

Human-induced pluripotent stem cell-based hepatic modeling of lipid metabolism-associated TM6SF2-E167K variant

Affiliations

Human-induced pluripotent stem cell-based hepatic modeling of lipid metabolism-associated TM6SF2-E167K variant

Lanuza A P Faccioli et al. Hepatology. .

Abstract

Background and aims: TM6SF2 rs58542926 (E167K) is related to an increased prevalence of metabolic dysfunction-associated steatotic liver disease. Conflicting mouse study results highlight the need for a human model to understand this mutation's impact. This study aims to create and characterize a reliable human in vitro model to mimic the effects of the TM6SF2-E167K mutation for future studies.

Approach and results: We used gene editing on human-induced pluripotent stem cells from a healthy individual to create cells with the TM6SF2-E167K mutation. After hepatocyte-directed differentiation, we observed decreased TM6SF2 protein expression, increased intracellular lipid droplets, and total cholesterol, in addition to reduced VLDL secretion. Transcriptomics revealed the upregulation of genes involved in lipid, fatty acid, and cholesterol transport, flux, and oxidation. Global lipidomics showed increased lipid classes associated with endoplasmic reticulum (ER) stress, mitochondrial dysfunction, apoptosis, and lipid metabolism. In addition, the TM6SF2-E167K mutation conferred a proinflammatory phenotype with signs of mitochondria and ER stress. Importantly, by facilitating protein folding within the ER of hepatocytes carrying TM6SF2-E167K mutation, VLDL secretion and ER stress markers improved.

Conclusions: Our findings indicate that induced hepatocytes generated from human-induced pluripotent stem cells carrying the TM6SF2-E167K recapitulate the effects observed in human hepatocytes from individuals with the TM6SF2 mutation. This study characterizes an in vitro model that can be used as a platform to identify potential clinical targets and highlights the therapeutic potential of targeting protein misfolding to alleviate ER stress and mitigate the detrimental effects of the TM6SF2-E167K mutation on hepatic lipid metabolism.

Keywords: TM6SF2 E167K; human hepatocytes; iPSC; lipid metabolism; liver disease model.


Conflict of interest statement

Alina Ostrowska owns stock in Pittsburgh ReLiver Inc. Ira J. Fox owns stocks in Pittsburgh ReLiver Inc. Alejandro Soto-Gutierrez owns stock in VonBaer Wolff Inc and Pittsburgh ReLiver Inc. The remaining authors have no conflicts to report.

Figures

None
Graphical abstract
FIGURE 1
FIGURE 1
Generation and characterization of iPSC-TM6SF2-WT and iPSC-TM6SF2-E167K. (A) Genotype frequency of the TM6SF2 rs58542926 variant in a US cohort (healthy individuals, n = 123, and ESLD samples, n = 50). Human symbols represent 20% of the prevalence. (B) Schematic design of the generation of iPSC-TM6SF2-WT and iPSC-TM6SF2-E167K. We generated iPSC-TM6SF2-WT from fibroblasts obtained from a healthy individual, followed by gene editing using CRISPR/Cas9 to generate iPSC-TM6SF2-E167K. Sanger sequencing confirmed that iPSC-TM6SF2-WT cells were major homozygous (CC) and iPSC-TM6SF2-E167K cells are minor homozygous (TT) after gene editing for the TM6SF2 rs58542926, as indicated by the red arrow. (C) Immunofluorescence micrographs of pluripotency markers: Nanog, SSEA4, OCT4, and TRA-1-60 (left panel) and quantitative gene expressions of pluripotency markers: SOX2, LIN28A, OCT4, and Nanog (right panel) in both iPSC-TM6SF2-WT (n = 3) and iPSC-TM6SF2-E167K (n = 3). WTC11 cells were used as a positive control, and human fibroblasts were used as a negative control. Values are determined relative to β-actin and presented as fold change relative to the expression in human WTC11, which is set as 1. (D) Micrographs of embryoid bodies and immunofluorescence micrographs of the three germ layer markers: ectoderm (SOX1 and OTX-2), mesoderm (HAND-1 and Brachyury), and endoderm (SOX17 and GATA-4) in both iPSC-TM6SF2-WT and iPSC-TM6SF2-E167K. (E) G-banding analysis for karyotype in both iPSC-TM6SF2-WT and iPSC-TM6SF2-E167K shows no abnormalities in the cells. Abbreviation: iPSC, induced pluripotent stem cell.
FIGURE 2
FIGURE 2
Hepatic differentiation and characterization of iHep-TM6SF2-WT and iHep-TM6SF2-E167K. (A) Schematic illustration of the hepatocyte differentiation protocol, highlighting the 3 main stages of differentiation by sequential addition of defined medium protocols containing Activin-A, BMP-4, and FGF2 (stage 1); Activin-A (stage 2); and DMSO and HGF (stage 3). (B) Immunofluorescence micrographs (left panel) of endoderm marker SOX17 in both iDE-TM6SF2-WT (n = 4) and iDE-TM6SF2-E167K (n = 4). Bright-field micrographs of iHep-TM6SF2-WT and iHep-TM6SF2-E167K show cells on the last day of stage 3. Immunofluorescence micrographs of hepatocyte markers, adult isoform HNF4α, AFP, and albumin in both iHep-TM6SF2-WT and iHep-TM6SF2-E167K. Human adult hepatocytes (PHH) (n = 3) and human fetal hepatocytes (n = 3) were used as positive and negative controls, respectively. (C) Quantitative gene expression for hepatocyte markers: HNF4α, HNF1α, FOXA1, FOXA2, PPARα, LXR, RXR, FASN, EGFR, SREBP1c, ACC, and CEBPA in both iHep-TM6SF2-WT (n = 4) and iHep-TM6SF2-E167K (n = 4). PHH cells (n = 3) were used as a positive control, and both undifferentiated iPSC lines (n = 3) were used as a negative control. Values are determined relative to β-actin and presented as fold change relative to the expression in PHH, which is set as 1. Abbreviations: ACC, acetyl-CoA carboxylase; CEBPA, CCAAT enhancer binding protein alpha; EGFR, epidermal growth factor receptor; FASN, fatty acid synthase; FOXA1, forkhead box protein A1; FOXA2, forkhead box protein A2; HNF1α, hepatocyte nuclear factor 1 alpha; LXR, liver X receptor; PPARα, peroxisome proliferator-activated receptor alpha; RXR, retinoid X receptor; SREBP1c, sterol regulatory element-binding transcription factor 1.
FIGURE 3
FIGURE 3
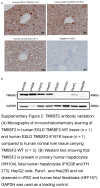
The TM6SF2-E167K mutation results in loss of function and alters lipid metabolism in human iHep. (A) TM6SF2 expression in both iHep-TM6SF2-WT and iHep-TM6SF2-E167K. The left upper panel shows quantitative gene expression. iPSC-TM6SF2-WT (n = 3), iPSC-TM6SF2-E167K (n = 3), and human fibroblast cells (n = 3) were applied as negative controls. Human normal liver tissue (n = 3), human ESLD-WT hepatocytes (n = 5), and adult PHH (n = 3) were used as positive controls. Values are determined relative to β-actin and presented as fold change relative to the expression in PHH, which is set as 1. The middle upper panel shows immunofluorescence micrographs of the TM6SF2 marker in iHep-TM6SF2-WT and iHep-TM6SF2-E167K. Adult PHH was used as a positive control, and fibroblast as a negative control. The relative TM6SF2 intensity showed a significant decrease in iHep-TM6SF2-E167K cells when compared to iHep-TM6SF2-WT (mean ± SD ***p = 0.0002 unpaired Welch’s t test, n = 20 cells). The same was observed by western blot. The bar chart shows the quantification of protein expression. There was a significant decrease in iHep-TM6SF2-E167K in comparison to iHep-TM6SF2-WT (mean ± SD ***p = 0.0005, unpaired Welch’s t test, n = 6). (B) The upper panel shows Nile red staining micrographs in both iHep-TM6SF2-WT and iHep-TM6SF2-E167K and shows that iHep-TM6SF2-E167K has a higher intracellular lipid droplet content when compared to iHep-TM6SF2-WT. Quantification shows a significant increase in the percentage of Nile red signal when the cells carry the E167K mutation (mean ± SD *p = 0.0274, unpaired Welch’s t test n = 5). The lower panel shows Perilipin 2 staining micrographs in both iHep-TM6SF2-WT and iHep-TM6SF2-E167K and shows that iHep-TM6SF2-E167K has a higher intracellular lipid droplet content when compared to iHep-TM6SF2-WT. Quantification shows a significant increase in the intensity of the Perilipin 2 signal when the cells carry the E167K mutation (mean ± SD *p = 0.0229, unpaired Welch’s t test n = 3). (C) ApoB100 secretion is impaired in iHep-TM6SF2-E167K. The intracellular content of ApoB100 in iHep-TM6SF2-WT and iHep-TM6SF2-E167K was quantified by western blot. The bar chart shows an increase of ApoB100 inside the iHep-TM6SF2-E167K (mean ± SD *p = 0.0144, unpaired Welch’s t test). iHep-TM6SF2-WT (n = 3) and iHep-TM6SF2-E167K (n = 4). (D) Intracellular total cholesterol and HLD amounts were measured in iHep-TM6SF2-WT and iHep-TM6SF2-E167K. The bar charts show a significant increase in the intracellular and extracellular ratio of total cholesterol in iHep-TM6SF2-E167K when compared to iHep-TM6SF2-WT (mean ± SD **p = 0.0079, unpaired Welch’s t test, iHep-TM6SF2-WT, n = 4 and iHep-TM6SF2-E167K, n = 4). The secretion of ApoB100 in iHep-TM6SF2-WT and iHep-TM6SF2-E167K was evaluated by ELISA and showed a decrease of this apolipoprotein in iHep-TM6SF2-E167K (mean ± SD **p = 0.0042, unpaired Welch’s t test) in iHep-TM6SF2-WT (n = 9) and iHep-TM6SF2-E167K (n = 11). The secretion of VLDL in iHep-TM6SF2-WT and iHep-TM6SF2-E167K was evaluated by ELISA and showed a decrease of VLDL in iHep-TM6SF2-E167K (mean ± SD *p = 0.0217, unpaired Welch’s t test) in iHep-TM6SF2-WT (n = 3) and iHep-TM6SF2-E167K (n = 3).
FIGURE 4
FIGURE 4
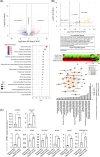
Transcription profiling analysis of iHep-TM6SF2-WT and iHep-TM6SF2-E167K. (A) Volcano plot showing the differential gene expression analysis of 3 independent differentiations of iHep-TM6SF2-WT and 4 independent differentiations of iHep-TM6SF2-E167K (left upper). The blue dots represent the downregulated genes, and the red dots represent the upregulated genes. The cutoff value for log2FC is 1.5 (adjust p = 0.05). The GSEA showed upregulated signaling pathways related to the TM6SF2-E167K mutation. (B) Volcano plot (upper panel) and heatmap (lower panel) showing human fatty liver metabolism RNA array analysis of 3 independent differentiations of iHep-TM6SF2-WT and iHep-TM6SF2-E167K. The table shows the upregulated and downregulated genes. Pathway analysis is based on the results from fatty liver metabolism RNA array analysis and the relationships between upstream regulators and biological functions. The top 23 pathways related to the iHep-TM6SF2-E167K mutation were ranked based on their p values. (C) Quantitative gene expression for important pathways highlighted by our differential expression and GSEA analysis. iHep-TM6SF2-E167K showed an increase in expression of ACSS2 (mean ± SD *p = 0.0109, unpaired Welch’s t test, n = 3), ACOX1 (mean ± SD ***p = 0.0001, unpaired Welch’s t test, n = 3), SULT1E1 (mean ± SD **p = 0.0027, unpaired Welch’s t test, n = 3), CD36 (mean ± SD *p = 0.0248, unpaired Welch’s t test, n = 3), ELOVL6 (mean ± SD *p = 0.0430, unpaired Welch’s t test, n = 4), APOH (mean ± SD *p = 0.0119, unpaired Welch’s t test, n = 3), VAMP7 (mean ± SD **p = 0.016, unpaired Welch’s t test, n = 3), and PPARGC1A (mean ± SD *p = 0.0290, unpaired Welch’s t test, n = 3) when compared to iHep-TM6SF2-WT. Values are determined relative to β-actin and presented as fold change relative to the expression in iHep-TM6SF2-WT, which is set as 1. Abbreviation: GSEA, gene set enrichment analysis.
FIGURE 5
FIGURE 5
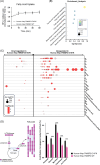
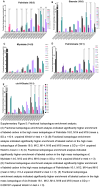
The TM6SF2-E167K variant modifies lipid metabolism in human iHeps. (A) Kinetics of fatty acid uptake in iHep-TM6SF2-WT and iHep-TM6SF2-E167K. Fatty acid uptake was measured using a fluorescent fatty acid analog, and the data are represented as RFU/millions of cells and normalized to time zero (n = 3). The uptake of fatty acids was assessed at 0,15, 30, 45, and 60 minutes. No differences were observed in iHep-TM6SF2-WT when compared to iHep-TM6SF2-E167K. (B) Pathway enrichment analysis on global lipidomics data. The analysis indicates an over-representation of lipids in the different pathways of interest. The data show an increased activity in the fatty acid synthesis pathway in mutant cells, which is one of the major building blocks for other lipids. The analysis was done with Metaboanalyzt (version 6.0). (C) Bubble plot showing the fold changes of various intracellular lipids of different classes in human iHep-TM6SF2-E167K (n = 3) when compared to the iHep-TM6SF2-WT (n = 3). The majority of the lipids measured in various classes have significant upregulation in the iHep-TM6SF2-E167K group when compared to the iHep-TM6SF2-WT group. The size of the circles represents the Log2 (fold change). (D) ISA shows significant utilization of glucose toward increasing the cytosolic acetyl-CoA in iHep-TM6SF2-E167K (n = 3) when compared to iHep-TM6SF2-WT (n = 3). Test statistics were calculated based on unpaired t test with Welch correction using Graphpad prism. Palmitate 16:0 (****p<10-4), Stearate 18:0 (****p<10-4), Myristate 14:0 (****p<10-4), Palmitoleate 16:1 (****p<10-4) cis-9-oleate 18:1 (***p = 0.000187). Inserted is a schematic depicting the mechanism by which glucose contributes labeled carbon into acetyl-CoA. Abbreviations: Cer, Ceramides; DG, diacylglycerols; FFA, free fatty acid; 2-HETE, hydroxyeicosatetraenoic acids; HexCer, hexosylceramide; ISA, isotopolog spectral analysis; LNAPE, N-acyl-lysophosphatidylethanolamines; LPC, lysophosphatidylcholines; LPE, lysophosphatidylethanolamine; LPG, Lyso-phosphatidylglycerol; PC, phosphatidylcholine; PE, phosphatidyethanolamine; PI, phosphatidylinositol; PS, phosphatidylserine; SM, sphingomyelin; SPH, sphingosine; TG, triglyceride.
FIGURE 6
FIGURE 6
Characterization of iHeps-TM6SF2-E167K revealed cellular stress. (A) The inflammatory response in iHep-TM6SF2-WT and iHep-TM6SF2-E167K was quantified by Multiplex Protein Detection. The representative images of human inflammatory array membranes show the expression analysis of 3 independent differentiations of iHep-TM6SF2-WT and 3 independent differentiations of iHep-TM6SF2-E167K. The blue rectangle represents the experimental positive control, the red rectangles represent downregulated cytokines and chemokines in iHep-TM6SF2-E167K, and the green rectangles represent upregulated cytokines and chemokines in iHep-TM6SF2-WT. After the development of the membranes, images were scanned and analyzed using ImageJ software. All dot density values were normalized to the dot density for positive control. The bar charts show an increase of IL-6 (mean ± SD *p = 0.0307, unpaired Welch’s t test), IL-8 (mean ± SD *p = 0.0410, unpaired Welch’s t test), MIP-1β (mean ± SD *p = 0.0279, unpaired Welch’s t test), and TIMP-2 (mean ± SD ****p < 0.0001, unpaired Welch’s t test), levels in iHep-TM6SF2-E167K when compared to iHep-TM6SF2-WT. (B) The bar chart shows that total ROS is significantly increased in iHep-TM6SF2-E167K when compared to iHep-TM6SF2-WT (mean ± SD **p = 0.0026, unpaired Welch’s t test n = 3). Total Caspase 3 measurement shows a significant increase in iHep-TM6SF2-E167K when compared to iHep-TM6SF2-WT (mean ± SD *p = 0.0317, unpaired Welch’s t test, n = 5). Total NAD/NADH quantification in iHep-TM6SF2-WT and iHep-TM6SF2-167K treated with 100 μM of PA for 48 hours shows a significant increase of NAD/NADH in iHep-TM6SF2-E167K treated when compared to iHep-TM6SF2-E167K nontreated (mean ± SD *p = 0.0407, unpaired Welch’s t test, n = 3). No difference was observed in iHep-TM6SF2-WT treated and nontreated (mean ± SD p = 0.0975, unpaired Welch’s t test, n = 3). (C) TEM images of ESLD-TM6SF2-WT (n = 1), ESLD-TM6SF2-E167K (n = 1), iHep-TM6SF2-WT (n = 3), and iHep-TM6SF2-E167K (n = 3). The white arrows indicate the rod mitochondrial shape commonly found in human hepatocytes. The yellow arrows show the round mitochondrial shape in hepatocytes that carried the TM6SF2-E167K mutation (scale bar: 600 nm). The right panel shows DNA quantitative gene expression for important functional mitochondria genes. iHep-TM6SF2-E167K showed a decrease in expression of mtCYB (mean ± SD **p = 0.0079, unpaired Welch’s t test, n = 5), mtCO3 (mean ± SD **p = 0.0079, unpaired Welch’s t test, n = 5), mtCO1 (mean ± SD **p = 0.0079, unpaired Welch’s t test, n = 5), and mtATP6 (mean ± SD **p = 0.0079, unpaired Welch’s t test, n = 5) when compared to iHep-TM6SF2-WT. Values are determined relative to β-actin and presented as fold change relative to the expression in iHep-TM6SF2-WT, which is set as 1. Abbreviation: TEM, transmission electron microscopy.
FIGURE 7
FIGURE 7
TM6SF2-E167K mutation is related to ER stress. (A) Immunofluorescence micrographs of XBP1, a protein related to ER stress, in ESLD-TM6SF2-WT (n = 1), ESLD-TM6SF2-E167K (n = 1), iHep-TM6SF2-WT (n = 3), and iHep-TM6SF2-E167K (n = 3), showing an increase in protein expression in the mutant samples (ESLD-TM6SF2-E167K and iHep-TM6SF2-E167K). The relative XBP1 expression was not significantly different in iHep-TM6SF2-E167K when compared to iHep-TM6SF2-WT (mean ± SD p = 0.4000, unpaired Welch’s t test n = 3). The opposite was observed by western blot. The bar chart shows the quantification of XBP1s protein expression, and a significant increase was observed in iHep-TM6SF2-E167K in comparison to iHep-TM6SF2-WT (mean ± SD ****p < 0.0001, unpaired Welch’s t test n = 6). (B) Immunofluorescence micrographs of HSPA5, a protein related to ER stress, in ESLD-TM6SF2-WT (n = 1), ESLD-TM6SF2-E167K (n = 1), iHep-TM6SF2-WT (n = 3), and iHep-TM6SF2-E167K (n = 3), showing an increase in protein expression in the mutant samples (ESLD-TM6SF2-E167K and iHep-TM6SF2-E167K). The relative HSPA5 expression showed a significant increase in iHep-TM6SF2-E167K when compared to iHep-TM6SF2-WT (mean ± SD *p = 0.0188, unpaired Welch’s t test n = 4). Values are determined relative to β-actin. The same was observed by western blot. The bar chart shows the quantification of HSPA5 protein expression, and a significant increase was observed in iHep-TM6SF2-E167K in comparison to iHep-TM6SF2-WT (mean ± SD **p = 0.0010, unpaired Welch’s t test n = 6). (C) Immunofluorescence micrographs of CHOP, a protein related to ER stress, in iHep-TM6SF2-WT (n = 3) and iHep-TM6SF2-E167K (n = 3), showing an increase in protein expression in iHep-TM6SF2-E167K. The bar chart shows that the intensity quantification of CHOP is significantly increased in iHep-TM6SF2-E167K in comparison to iHep-TM6SF2-WT (mean ± SD *p = 0.0118, unpaired Welch’s t test n = 3). The same was observed by western blot for AFT4, another protein related to ER stress. The bar chart shows that ATF4 protein expression is significantly increased in iHep-TM6SF2-E167K in comparison to iHep-TM6SF2-WT (mean ± SD ****p < 0.0001, unpaired Welch’s t test n = 6). (D) ER and Golgi expression in both iHep-TM6SF2-WT and iHep-TM6SF2-E167K. Immunofluorescence micrographs show calnexin marking ER in red and GM130 marking Golgi in green (×40, n = 3). The histograms show that there is no difference in ER region area in iHep-TM6SF2-E167K when compared to iHep-TM6SF2-WT. The opposite was observed in the Golgi area and ER intensity, where the histograms show a significant difference in iHep-TM6SF2-E167K when compared to iHep-TM6SF2-WT. (E) After treatment with 2 μM of 4PBA for 48 hours, ATF4 and HSPA5 protein expression was observed by western blot in both iHep-TM6SF2-WT and iHep-TM6SF2-E167K. The bar chart shows the quantification of ATF4 and HSPA5 normalized to nontreated cells. ATF4 and HSPA5 showed a significant increase in expression in iHep-TM6SF2-E167K treated when compared to nontreated iHep-TM6SF2-E167K (ATF4: mean ± SD *p = 0.0313, unpaired Welch’s t test n = 3), (HSPA5: mean ± SD ***p = 0.0007, unpaired Welch’s t test n = 3). No difference in either protein was observed in iHep-TM6SF2-WT treated when compared to nontreated iHep-TM6SF2-WT. The quantification of VLDL secretion showed no difference in iHep-TM6SF2-WT treated when compared to nontreated iHep-TM6SF2-WT (mean ± SD p = 0.6752, unpaired Welch’s t test n = 3) and a significant increase in the secretion of VLDL in iHep-TM6SF2-E167K treated when compared to nontreated iHep-TM6SF2-E167K (mean ± SD *p = 0.0321, unpaired Welch’s t test n = 3).
None
None
None
None
None

Update of

Similar articles

References

    1. Yen YH, Kee KM, Li WF, Liu YW, Wang CC, Hu TH, et al. Causes of death among patients with hepatocellular carcinoma according to chronic liver disease etiology. Cancers (Basel). 2023;15:1687. - PMC - PubMed
    1. Asrani SK, Devarbhavi H, Eaton J, Kamath PS. Burden of liver diseases in the world. J Hepatol. 2019;70:151–171. - PubMed
    1. Moon AM, Singal AG, Tapper EB. Contemporary epidemiology of chronic liver disease and cirrhosis. Clin Gastroenterol Hepatol. 2020;18:2650–2666. - PMC - PubMed
    1. Pais R, Barritt ASt, Calmus Y, Scatton O, Runge T, Lebray P, et al. NAFLD and liver transplantation: Current burden and expected challenges. J Hepatol. 2016;65:1245–1257. - PMC - PubMed
    1. Younossi ZM, Henry L. Epidemiology of non-alcoholic fatty liver disease and hepatocellular carcinoma. JHEP Rep. 2021;3:100305. - PMC - PubMed

LinkOut - more resources