. 2025 Aug 20;21(8):e1012501.
doi: 10.1371/journal.ppat.1012501. eCollection 2025 Aug.

Daxx mediated histone H3.3 deposition on HSV-1 DNA restricts genome decompaction and the progression of immediate-early transcription

Affiliations

Daxx mediated histone H3.3 deposition on HSV-1 DNA restricts genome decompaction and the progression of immediate-early transcription

Ashley P E Roberts et al. PLoS Pathog. .

Abstract

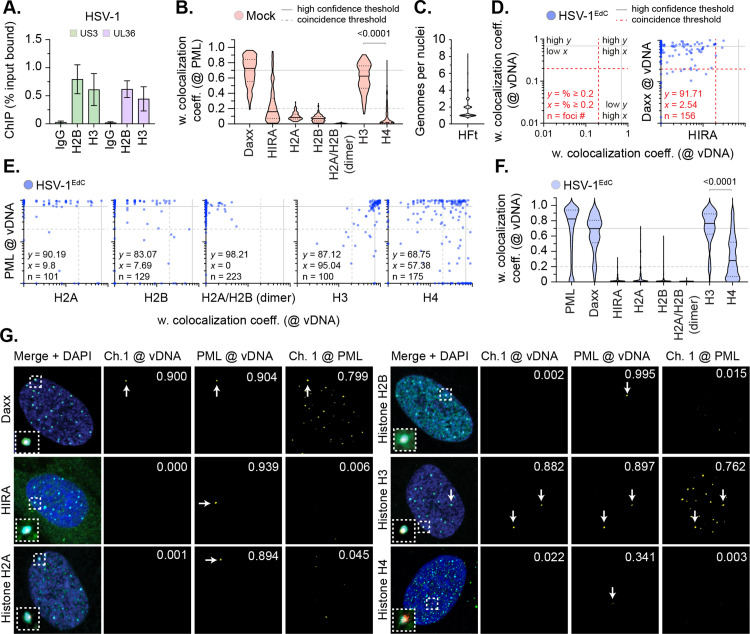
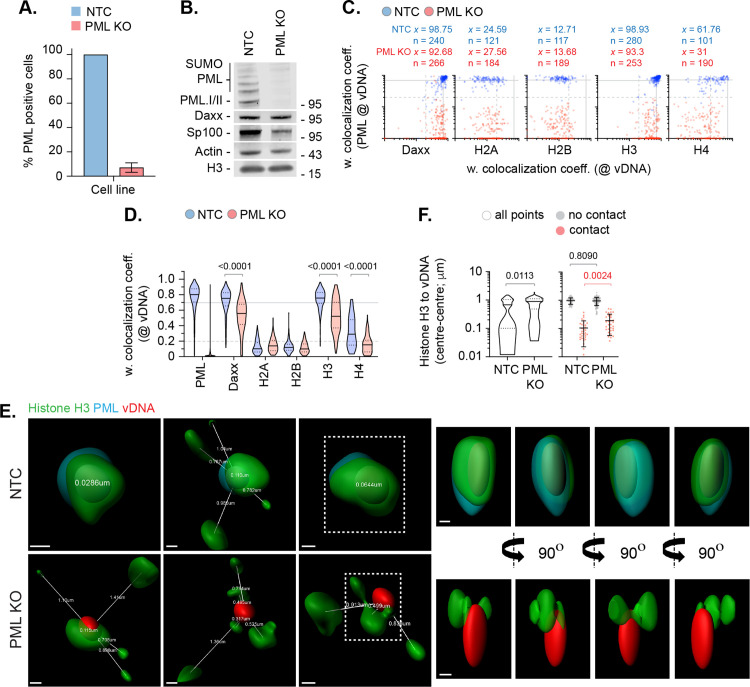
Herpesviruses are ubiquitous pathogens that cause a wide range of disease. Upon nuclear entry, their genomes associate with histones and chromatin modifying enzymes that regulate the progression of viral transcription and outcome of infection. While the composition and modification of viral chromatin has been extensively studied on bulk populations of infected cells by chromatin immunoprecipitation, this key regulatory process remains poorly defined at single-genome resolution. Here we use high-resolution quantitative imaging to investigate the spatial proximity of canonical and variant histones at individual Herpes Simplex Virus 1 (HSV-1) genomes within the first 90 minutes of infection. We identify significant population heterogeneity in the stable enrichment and spatial proximity of canonical histones (H2A, H2B, H3.1) at viral DNA (vDNA) relative to established promyelocytic leukaemia nuclear body (PML-NB) host factors that are actively recruited to viral genomes upon nuclear entry. We show the replication-independent histone H3.3/H4 chaperone Daxx to cooperate with PML to mediate the enrichment and spatial localization of variant histone H3.3 at vDNA and limit the rate of HSV-1 genome decompaction. This host response is counteracted by the viral ubiquitin ligase ICP0, which degrades PML to disperse Daxx and variant histone H3.3 from vDNA to stimulate the progression of viral immediate-early (IE) transcription, genome expansion, and onset of HSV-1 replication. Our data support a model of intermediate and sequential histone assembly initiated by Daxx that limits the rate of HSV-1 genome decompaction independently of the stable enrichment of histones H2A and H2B at vDNA required to facilitate canonical nucleosome assembly. We identify HSV-1 genome decompaction upon nuclear infection to play a key role in the initiation and functional outcome of HSV-1 lytic infection, findings pertinent to the transcriptional regulation of many nuclear replicating herpesvirus pathogens.


Conflict of interest statement

The authors have declared that no competing interests exist.

Figures

Fig 1
Fig 1. Canonical histones do not stoichiometrically localize to nuclear infecting HSV-1 genomes.
(A) HFt cells were infected with WT HSV-1 (MOI of 3 PFU/cell). Chromatin extracts were prepared at 90 mins post-infection (mpi; post-addition of virus) and subjected to ChIP using ChIP-grade anti-histone H2B or histone H3 antibodies and species-matched IgG (negative control). Bound viral DNA (vDNA) was quantified by qPCR using probes specific to HSV-1 US3 or UL36. Values were normalized to input loading controls and presented as percentage (%) input bound. Means and SEM shown. (B to G) HFt cells were mock-treated or infected with WT HSV-1EdC (MOI of 1 PFU/cell). Cells were fixed at 90 mpi and stained for PML, Daxx, HIRA, histones H2A, H2B, H2A/H2B heterodimers (dimer), H3, or H4 by indirect immunofluorescence. vDNA was detected by click chemistry [16]. Nuclei were stained with DAPI. (B) Colocalization frequency of cellular proteins at PML-NBs in mock-treated HFt cells. N ≥ 60 nuclei per staining condition. Confocal microscopy images shown in S1 Fig. Violin plots: median weighted (w.) colocalization coefficient (coeff.), solid black line; 25th to 75th percentile range, dotted black lines; coincidence threshold (0.2), dotted grey line; high confidence threshold (0.7), solid grey line. Threshold values determined from scatter plots shown in Fig 1D (Daxx positive control/HIRA negative control) and Fig 2B (PML positive control/eYFPnls negative control) [16,38]. Mann-Whitney U-test, P-value shown. (C) Quantitation of the number of genome foci detected in the nucleus of HSV-1EdC infected cells at 90 mpi. N = 883 nuclei derived from 18 independent experiments. (D/E) Scatter plots showing paired w. colocalization coeff. values of proteins of interest (indicated on x- and y-axis) at vDNA. Percentage (%) of genomes ≥ coincident threshold (x/y ≥ 0.2) per sample condition shown; number (n) of genome foci analysed per sample population shown. (F) Colocalization frequency of cellular proteins of interest at vDNA in HSV-1 infected HFt cells at 90 mpi (as in D, E). Mann-Whitney U-test, P-value shown. (G) Merged images of Daxx, HIRA, histones H2A, H2B, H3, or H4 (Channel 1 (Ch.1), green; as indicated), and PML (cyan) colocalization at vDNA (red). Cut mask (yellow) highlights regions of colocalization between cellular proteins of interest and vDNA or PML (as indicated); w. colocalization coeff. shown. Dashed boxes show magnified regions of interest. White arrows highlight regions of colocalization at vDNA. Individual channels shown in S4 Fig. (A to G) Data derived from a minimum of three independent experiments. Raw values presented in S1 Data.
Fig 2
Fig 2. Fluorescent histones do not stoichiometrically localize to nuclear infecting HSV-1 genomes.
(A to C) HFt cells were stably transduced with doxycycline inducible lentiviral vectors encoding C-terminally tagged fluorescent (mEmerald, mEm) histones or eYFPnls (negative control) as indicated. Cells were induced to express proteins of interest for 6 h prior to infection with WT HSV-1EdC (MOI of 1 PFU/cell). Cells were fixed at 90 mpi and stained for PML by indirect immunofluorescence and vDNA by click chemistry. Nuclei were stained with DAPI. (A) Merged confocal microscopy images of mEm-tagged histones or eYFPnls (green) and endogenous PML (cyan) colocalization at vDNA (red). Cut mask (yellow) highlights regions of colocalization between cellular proteins of interest and vDNA or PML; weighted (w.) colocalization coefficient (coeff.) shown. Dashed boxes show magnified regions of interest. White arrows highlight regions of colocalization at vDNA. Individual channels shown in S6 Fig. (B) Scatter plots showing paired w. colocalization coeff. values of proteins of interest (indicated on x- and y-axis) at vDNA. Percentage (%) of genomes ≥ coincident threshold (x/y ≥ 0.2) per sample condition shown; number (n) of genome foci analysed per sample condition shown. (C) Colocalization frequency of proteins of interest at vDNA (as in B). Violin plots: median w. colocalization coeff., solid black line; 25th to 75th percentile range, dotted black lines; coincidence threshold (0.2), dotted grey line; high confidence threshold (0.7), solid grey line. Mann-Whitney U-test, P-values shown. (A to C) Data derived from a minimum of three independent experiments. Raw values presented in S1 Data.
Fig 3
Fig 3. Histone H3 is enriched at vDNA independently of its sub-cellular localization at PML-NBs.
(A to E) HFt, HEL, RPE, or HaCaT cells were mock-treated or infected with WT HSV-1EdC (MOI of 1 PFU/cell). Cells were fixed at 90 mpi and stained for proteins of interest (as indicated) by indirect immunofluorescence and vDNA by click chemistry. Nuclei were stained with DAPI. (A) Confocal microscopy images of mock-treated HFt and HaCaT cells showing sub-nuclear localization of histone H3, Daxx, or ATRX (green) and PML (red). Cut mask (yellow) highlights regions of colocalization between cellular proteins of interest and PML; weighted (w.) colocalization coefficient (coeff.) shown. (B) Colocalization frequency of histone H3 at PML-NBs in mock-treated HFt, HEL, RPE, and HaCaT cells. Violin plots: median w. colocalization coeff., solid black line; 25th to 75th percentile range, dotted black lines; coincidence threshold (0.2), dotted grey line; high confidence threshold (0.7), solid grey line. Mann-Whitney U-test, P-value shown. N > 240 nuclei per sample condition. (C) Colocalization frequency of proteins of interest at PML-NBs in mock-treated HaCaT cells. N ≥ 250 nuclei per sample condition. (D) Scatter plots showing paired w. colocalization coeff. values of proteins of interest (indicated on x- and y-axis) at vDNA within infected HaCaT cells. Percentage (%) of genomes ≥ coincident threshold (x/y ≥ 0.2) per sample condition shown; number (n) of genome foci analysed per sample condition shown. (E) Distribution of PML, histones H2A, H2B, H3, and H4 colocalization frequency at vDNA (as in D). Mann-Whitney U-test (top), one-way ANOVA Kruskal-Wallis test (bottom), P-values shown. (A to E) Data derived from a minimum of three independent experiments. Raw values presented in S1 Data.
Fig 4
Fig 4. Cellular histones show alternate patterns of spatial proximity to nuclear infecting HSV-1 genomes.
HFt cells were infected with WT HSV-1EdC (MOI of 1 PFU/cell). Samples were fixed at 90 mpi and stained for proteins of interest (histones H2A, H2B, H3, or H4, and PML) by indirect immunofluorescence and vDNA by click chemistry. (A) Left; 3D render projections showing the spatial proximity and distance (white lines, μm) of endogenous cellular histones (green, as indicated) and PML (cyan) within a 2 μm3 region centred on vDNA (red). Right; 360° rotation of region of interest (dashed white boxes, left). Scale bars = 0.2 μm. (B/C) Quantitation of histone proximity (centre-to-centre distance, μm) to PML-NBs (B) or vDNA (C). Violin plots: median, solid black line; 25th to 75th percentile range, dotted lines. Scatter plots: black line, mean; whisker, SD. N > 100 vDNA foci per sample condition (all points). One-way ANOVA Kruskal-Wallis test, P-values shown. (D) Quantitation of PML-NB volume (μm3) in the presence or absence of vDNA. N ≥ 150 PML-NBs per condition. Mann-Whitney U-test, P-value shown. (E) HFt SPOT.PML.I expressing cells were infected with HSV-1 (MOI of 3 PFU/cell). Chromatin extracts were prepared at 90 mpi and subjected to ChIP using anti-SPOT-tag or species-matched IgG (negative control). Bound vDNA was quantified by qPCR using probes to HSV-1 US3 or UL36. Values were normalized to input loading controls and presented as percentage (%) input bound. Means and SEM shown. (A to E) Data derived from a minimum of three independent experiments. Raw values presented in S1 Data.
Fig 5
Fig 5. PML-NBs do not sterically inhibit histone H2A or H2B enrichment to nuclear infecting HSV-1 genomes.
HFt cells were stably transduced with lentiviruses expressing CRISPR/Cas9 and non-targeting control (NTC) or PML-targeting (PML KO) gRNAs. (A) Quantitation of PML knockout in NTC and PML KO HFt cells by indirect immunofluorescence staining. N = 17 fields of view per sample condition; means and SD shown. (B) Western blot of NTC or PML KO HFt WCLs. Membranes were probed for PML, Sp100, Daxx, histone H3, and Actin (loading control). Molecular mass markers indicated. (C) NTC or PML KO HFt cells were infected with WT HSV-1EdC (MOI of 1 PFU/cell). Cells were fixed at 90 mpi and stained for proteins of interest (Daxx, histones H2A, H2B, H3, or H4, and PML) by indirect immunofluorescence and vDNA by click chemistry. Scatter plots showing paired weighted (w.) colocalization coefficient (coeff.) values of proteins of interest (indicated on x- and y-axis) at vDNA. Percentage (%) of genomes ≥ coincident threshold (x/y ≥ 0.2) per sample condition shown; number (n) of genome foci analysed per sample condition shown. Confocal images shown in S8 Fig. (D) Distribution in protein colocalization frequency at vDNA (as in C). Violin plots: median, solid black line; 25th to 75th percentile range, dotted lines. Mann-Whitney U-test, P-values shown. (E) Left; 3D rendered projections of super-resolution images showing spatial proximity and distance (white lines, μm) of histone H3 (green) and PML (cyan) within a 2 μm3 region centred on vDNA (red). Right; 360° rotation of region of interest (dashed white boxes, left). Scale bars = 0.2 μm. (F) Quantitation of histone H3 proximity (centre-to-centre distance, μm). N ≥ 90 vDNA foci per sample condition (all points). Violin plots (as described in D). Scatter plots: black lines, mean; whisker, SD. Mann-Whitney U-test, P-values shown. (A, C to F) Data derived from a minimum of three independent experiments. Raw values presented in S1 Data.
Fig 6
Fig 6. Daxx promotes histone H3 deposition at HSV-1 DNA to limit viral genome expansion.
HFt cells were stably transduced with lentiviruses expressing CRISPR/Cas9 and non-targeting control (NTC) or Daxx-targeting (Daxx KO) gRNAs. (A) Quantitation of Daxx knockout in NTC or Daxx KO HFt cells by indirect immunofluorescence staining. N ≥ 60 fields of view per sample condition; means and SD shown. Confocal images shown in S9 Fig. (B) Western blot of NTC or Daxx KO HFt WCLs. Membranes were probed for PML, Sp100, Daxx, histone H3, and Actin (loading control). Molecular mass markers indicated. (C) Confocal microscopy images of NTC or Daxx KO HFt cells stained for histone H3 (green) and Daxx (cyan). Nuclei were stained with DAPI (blue). Cut mask (yellow) highlights regions of colocalization between cellular proteins of interest; weighted (w.) colocalization coefficient (coeff.) shown. (D) Distribution in histone H3 colocalization frequency at PML-NBs in NTC and Daxx KO HFt cells. Violin plots: median, solid black line; 25th to 75th percentile range, dotted lines. N ≥ 175 nuclei per sample condition. Mann-Whitney U-test, P-value shown. (E) NTC or Daxx KO HFt cells were infected with WT HSV-1EdC (MOI of 1 PFU/cell). Cells were fixed at 90 mpi and stained for proteins of interest (PML, ATRX, histones H3 or H4, and Daxx) by indirect immunofluorescence and vDNA by click chemistry. Scatter plots showing paired w. colocalization coeff. values of proteins of interest (indicated on x- and y-axis) at vDNA. Percentage (%) of genomes ≥ coincident threshold (x/y ≥ 0.2) per sample condition shown; number (n) of genome foci analysed per sample condition shown. Confocal images shown in S10 Fig. (F) Distribution in protein colocalization frequency at vDNA (as in E). Violin plots (as described in D); Mann-Whitney U-test, P-values shown. (G) Left; 3D rendered projections of super-resolution images showing spatial proximity and distance (white lines, μm) of histone H3 (green) and PML (cyan) within a 2 μm3 region centred on vDNA (red) within infected NTC or Daxx KO HFt cells. Right; 360° rotation of region of interest (dashed white boxes, left). Scale bars = 0.2 μm. (H) Quantitation of histone H3 proximity (centre-to-centre distance, μm) to vDNA. Violin plots (as described in D). N ≥ 80 vDNA foci per sample condition (all points); Mann-Whitney U-test, P-values shown. (I) Quantitation of genome volume (μm3) in NTC, PML KO, or Daxx KO HFt cells. N ≥ 45 vDNA foci per sample condition; One-way ANOVA Kruskal-Wallis test, P-values shown. (A, C to I) Data derived from a minimum of three independent experiments. Raw values presented in S1 Data.
Fig 7
Fig 7. HSV-1 DNA retains a significant degree of native compaction post-capsid release.
(A to C) Representative super-resolution confocal microscopy images of in vitro released HSV-1EdC genomes in the presence (A) or absence (B) of 0.5% SDS (no FBS supplement). (C) Magnified regions of interest (dotted boxes in A and B, as indicated). White arrows highlight the detection of linear genomes in the presence of SDS. Scale bars = 5 μm. (D) 3D rendering of super-resolution images of HSV-1EdC genomes released in vitro in the presence carrier protein (0.1% FBS final concentration) or within infected HFt cells (MOI 1 PFU/cell) at 90 mpi (left and right-hand panels, respectively). Scale bars = 2 μm. White arrows show cytosolic and nuclear vDNA foci. (A to D) vDNA was detected by click chemistry. (D) Nuclei were stained with DAPI (blue). (E) Quantitation of vDNA foci dimensions (μm3) (as in D). Boxes, 25th to 75th percentile range; whisker, 5th to 95th percentile range; black line, median. Number (n) of genome foci analyzed per sample population shown; Mann-Whitney U-test, P-value shown. Data derived from a minimum of three independent experiments. Raw values presented in S1 Data.
Fig 8
Fig 8. ICP0 disperses Daxx and variant histone H3.3 from vDNA to stimulate HSV-1 genome decompaction and progression of IE gene transcription.
(A/B) HFt cells were infected with WT or ICP0 null-mutant (ΔICP0) HSV-1EdC/A (MOI of 0.5 PFU/cell) for the indicated times (minutes post-infection; mpi). Cells were fixed and stained for Daxx, histone H3, and PML by indirect immunofluorescence. vDNA was detected by click chemistry. (A) Scatter plots showing paired weighted (w.) colocalization coefficient (coeff.) values of proteins of interest (indicated on x- and y-axis) at vDNA at either 90 or 240 mpi (blue and red dots, respectively). Percentage (%) of genomes ≥ coincident threshold (x/y ≥ 0.2) per sample condition shown; number (n) of genome foci analysed per sample condition shown. (B) Distribution in protein colocalization frequency at vDNA (as in A). Violin plots: median w. colocalization coeff., solid black line; 25th to 75th percentile range, dotted black lines; coincidence threshold (0.2), dotted grey line; high confidence threshold (0.7), solid grey line. One-way ANOVA Kruskal-Wallis test, P-values shown. (C/D) Quantitation of HSV-1EdC/A and ΔICP0EdC/A DNA foci dimensions (μm3) over time (as indicated) in the presence of 2 μM supplemental EdC within the overlay medium; N ≥ 270 genome foci per sample population. (C) Means and SD shown. Mann-Whitney U-test, P-value shown. (D) All points at 90 and 240 mpi shown. Mann-Whitney U-test, P-value shown. (E) RT-qPCR analysis of HSV-1 IE gene transcription (ICP0 and ICP4, as indicated) in NTC and Daxx KO HFt cells infected with WT HSV-1 (MOI 0.5 PFU/cell) over time (mpi). Values were normalized to NTC infected cells at 360 mpi. Means and SEM shown; paired two-tailed t test, P-values shown. Individual replicate experiments shown in S12B Fig. (F) Quantitation of HSV-1 immediate gene expression (ICP0 and ICP4) within AFP (auto fluorescent protein) HSV-1 (MOI 0.5 PFU/cell) infected NTC and Daxx KO HFt cells over time (mpi). Values normalized to the total population of DAPI positive cells (normalized [norm.] counts) and presented as percentage (%) positive cells. Means and SEM shown; paired two-tailed t test, P-values shown. (G) WT and ICP0 null-mutant (ΔICP0) HSV-1 cell released virus (CRV) titres derived from supernatants of infected NTC and Daxx KO HFt cells (MOI 0.5 PFU/cell) over time (hour post-infection; hpi). Boxes, 25th to 75th percentile range; whisker, 5th to 95th percentile range; black line, median. Mann-Whitney U-test, P-values shown. (A to F) Data derived from a minimum of three independent experiments. Raw values presented in S1 data.

Update of

Similar articles

References

    1. Knipe DM, Howley PM. Fields virology. 6th ed. Philadelphia, PA: Wolters Kluwer/Lippincott Williams & Wilkins Health. 2013.
    1. Davison AJ. Comparative analysis of the genomes. In: Arvin A, Campadelli-Fiume G, Mocarski E, Moore PS, Roizman B, Whitley R. Human herpesviruses: Biology, Therapy, and Immunoprophylaxis. Cambridge. 2007. - PubMed
    1. Booy FP, Newcomb WW, Trus BL, Brown JC, Baker TS, Steven AC. Liquid-crystalline, phage-like packing of encapsidated DNA in herpes simplex virus. Cell. 1991;64(5):1007–15. doi: 10.1016/0092-8674(91)90324-r - DOI - PMC - PubMed
    1. Sae-Ueng U, Li D, Zuo X, Huffman JB, Homa FL, Rau D, et al. Solid-to-fluid DNA transition inside HSV-1 capsid close to the temperature of infection. Nat Chem Biol. 2014;10(10):861–7. doi: 10.1038/nchembio.1628 - DOI - PMC - PubMed
    1. Zhou ZH, Chen DH, Jakana J, Rixon FJ, Chiu W. Visualization of tegument-capsid interactions and DNA in intact herpes simplex virus type 1 virions. J Virol. 1999;73(4):3210–8. doi: 10.1128/JVI.73.4.3210-3218.1999 - DOI - PMC - PubMed

MeSH terms