. 2025 Sep 1;74(9):1695-1707.
doi: 10.2337/db25-0105.

DNA Methylation Biomarkers Predict Offspring Metabolic Risk From Mothers With Hyperglycemia in Pregnancy

Affiliations

DNA Methylation Biomarkers Predict Offspring Metabolic Risk From Mothers With Hyperglycemia in Pregnancy

Johnny Assaf et al. Diabetes. .

Abstract

Maternal hyperglycemia is linked to 19 cord blood DNA methylation biomarkers that predict offspring metabolic dysfunction. These methylation changes, associated with maternal glycemic status, improved the prediction of β-cell dysfunction at 7, 11, and 18 years of age compared with clinical factors alone. Validation in human β-cells and pancreatic ductal epithelial cells confirmed that hyperglycemia influences methylation-dependent gene expression. These findings highlight the role of epigenetic modifications at birth as early indicators of diabetes risk, suggesting that in utero hyperglycemic exposure may mediate long-term metabolic outcomes in offspring.


Conflict of interest statement

Duality of Interest. No potential conflicts of interest relevant to this article were reported.

Figures

None
Graphical abstract
Figure 1
Figure 1
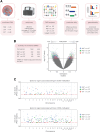
Use of DNA methylation biomarkers yields biomarkers associated with robust performance and accuracy in diagnosing maternal hyperglycemia. A: Summary of the experimental design and EdgeR workflow. DNA was isolated from 112 cord blood samples, and deep sequencing was performed on methylated-DNA enriched using Methyl-Miner. Differential methylation analysis was conducted using pairwise comparisons of three groups: NGT, IGT, and LGT. DMRs were identified using EdgeR with a significance threshold of P < 0.001. B: Differential methylation associated with IGT and LGT in pregnancy. Volcano plot of EdgeR results. The methylated regions are visualized through their relative log-fold change (logFC) vs. −log10 (P value). The horizontal line is −log10 (0.001), the cutoff P value used to identify DMRs associated with maternal glucose tolerance. C: Localization of DMRs associated with maternal hyperglycemia during pregnancy. Manhattan plot of AUC scores of candidate biomarkers from EdgeR analysis. A total of 1,912 DMRs were individually tested for glucose tolerance classification accuracy using ROC analysis to calculate the AUC. Potential biomarkers were selected based on specific criteria, including AUC > 0.65 per tested contrast and DMRs with more than four CpG sites. Biomarkers with an AUC > 0.65, as indicated by a red dashed line, are colored according to the contrast in which they were found to be significantly differentially methylated. The binomial model used ROC to test the AUC based on which contrast it was differentially methylated in. The x-axis indicates the approximate position of the DMR in the genome (AUC > 0.65 and P < 0.001).
Figure 2
Figure 2
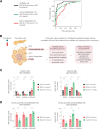
Integration of DNA methylation biomarkers provide robust prediction of LGT during pregnancy. A: DNA methylation indices of GDM. ROC curves were generated for the combination of 19 candidate biomarkers to diagnose LGT (n = 38, binomial model = 1) from the collective IGT and NGT groups (n = 74, binomial model = 0). The black line represents all biomarkers included in the model, while the red and green lines denote biomarkers with gain or loss of methylation, respectively. P values were computed in R package CARET using a one-sided binominal test. B: Workflow methylation-mediated gene expression. The refined 19 biomarkers were prioritized for validation in hyperglycemic cell models and assessed by targeted methods such as methyl-qPCR (methylation) and real-time qRT-PCR for gene expression. C: Validation of methylation-mediated gene expression in human β-cells following hyperglycemia. Left: Methylation assessment was conducted using methyl-qPCR for FRAS1, KATNAL1, and CACNA1E. The bar graph shows the individual methylation levels in cells exposed to low glucose (LG) (0.5 mmol/L), normal glucose (NG) (5.5 mmol/L), and high glucose (HG) (15.5 mmol/L) for 3 days. DNA methylation fold change was calculated using methyl-qPCR data for LG (n = 3), NG (n = 3), and HG (n = 2) adjusted to methylated-DNA spike in control. The significance was calculated by comparing LG with NG and HG using a Student t test. *P < 0.05, **P < 0.01, ***P < 0.001. Error bars indicate the SEM. Right: The mRNA expression levels of FRAS1, KATNAL1, and CACNA1E assessed by real-time qRT-PCR (adjusted to H3F3A). Significance was calculated by comparing LG with NG and HG using a Student t test. *P < 0.05, **P < 0.01. Error bars indicate the SEM. D: Validation of candidate methylation-mediated gene expression in human pancreas ductal epithelial cells following hyperglycemia. Left: Methylation assessment was conducted using methyl-qPCR. Bar graph shows the individual methylation levels for candidate methylation biomarkers in cultured cells exposed to NG (5.5 mmol/L) and HG (25.5 mmol/L) for 7 days. DNA methylation fold change was calculated using methyl-qPCR data for NG and HG normalized to methylated-DNA spike in control. The significance was calculated by comparing NG with HG using a Student t test. **P < 0.01. Error bars indicate the SEM (n = 3). Right: mRNA expression of FRAS1, KATNAL1, and CACNA1E were also assessed using real-time qRT-PCR (adjusted to H3F3A). Significance was calculated by comparing NG with HG using a Student t test. *P < 0.05. Error bars indicate the SEM (n = 3).

References

    1. Sweeting A, Hannah W, Backman H, et al. Epidemiology and management of gestational diabetes. Lancet 2024;404:175–192 - PubMed
    1. McIntyre HD, Kampmann U, Dalsgaard Clausen T, Laurie J, Ma RCW. Gestational diabetes: an update 60 years after O’Sullivan and Mahan. J Clin Endocrinol Metab 2024;110:e19–e31 - PMC - PubMed
    1. Magliano DJ, Boyko EJ; IDF Diabetes Atlas 10th Edition Scientific Committee 2021 . IDF Diabetes Atlas. 10th ed. Brussels: International Diabetes Federation, 2021
    1. Arora GP, Åkerlund M, Brøns C, et al. Phenotypic and genotypic differences between Indian and Scandinavian women with gestational diabetes mellitus. J Intern Med 2019;286:192–206 - PubMed
    1. Pervjakova N, Moen G-H, Borges M-C, et al. Multi-ancestry genome-wide association study of gestational diabetes mellitus highlights genetic links with type 2 diabetes. Hum Mol Genet 2022;31:3377–3391 - PMC - PubMed