. 2025 Oct;12(39):e08940.
doi: 10.1002/advs.202508940. Epub 2025 Aug 20.

Leukemic Cells Hijack Stromal Bioelectricity to Reprogram the Bone Marrow Niche via CaV1.2-Dependent Mechanisms

Affiliations

Leukemic Cells Hijack Stromal Bioelectricity to Reprogram the Bone Marrow Niche via CaV1.2-Dependent Mechanisms

Ambra Da Ros et al. Adv Sci (Weinh). 2025 Oct.

Abstract

Mesenchymal stromal cells (MSCs) are key components of the tumor microenvironment (TME), influencing leukemia progression through poorly understood mechanisms. Here, the bioelectrical properties of MSCs derived from pediatric acute myeloid leukemia (AML) patients (AML-MSCs) are investigated, identifying a significant depolarization of their resting voltage membrane potential (Vmem, -14.7 mV) compared to healthy MSCs (h-MSCs, -28.5 mV), accompanied by downregulation of Calcium channel, voltage-dependent, L type, alpha 1C subunit1.2 (CaV1.2) L-type calcium channel expression. AML-MSCs display increased spontaneous calcium oscillations, suggesting altered ion homeostasis. Notably, h-MSCs exposed to AML blasts undergo a similar Vmem depolarization (-11.8 mV) and CaV1.2 downregulation, indicating that leukemic cells actively reprogram MSCs. Functionally, Vmem depolarization in h-MSCs promotes a pro-leukemic phenotype, whereas hyperpolarization of AML-MSCs restores a normal behavior. CaV1.2 over-expression by lentiviral vectors in AML-MSCs shifts the Vmem toward hyperpolarization and partially reverses their leukemia-supportive properties, in part through CaV1.2 transfer via tunneling nanotubes. These findings reveal that AML blasts impose a bioelectrical signature on MSCs, modulating ion channel activity to sustain a leukemic niche. Targeting this electrical reprogramming through CaV1.2 restoration represents a potential strategy to re-establish homeostasis in the bone marrow microenvironment.

Keywords: acute myeloid leukemia; bioelectricity; mesenchymal stromal cells; tumor microenvironment; voltage membrane potential.


Conflict of interest statement

The authors declare no competing interests.

Figures
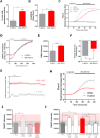
Figure 1
Figure 1
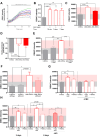
Ca2+ flux and resting Vmem are altered in AML‐MSCs. A) Percentage of spontaneous Ca2+ oscillating h‐MSCs and AML‐MSCs cells loaded with calcium indicator Fluo‐4 AM probe (n = 3, t‐test). B) Average amplitude of calcium oscillations in h‐MSCs and AML‐MSCs loaded with Fluo‐4 AM probe (n = 3, 7, and 50 cells per sample, respectively, t‐test). C) Intracellular calcium increases in h‐MSCs and AML‐MSCs, loaded with Fluo‐4 AM probe and stimulated with KCl (65 mm), in the presence/absence of external Ca2+ (n = 3, t‐test at maximum h‐MSCs fluorescence increase. D) DiBAC fluorescence intensity in h‐MSCs and AML‐MSCs loaded with the voltage‐sensitive dye DiBAC and stimulated with KCl (65 mm). Fluorescence intensity data were normalized to the KCl maximum intensity value (n = 4, t‐test at 200, 300, and 400 s, = not significant). E) Fluorescence intensity calculated from DiBAC fluorescence staining in AML‐MSCs (n = 14) and h‐MSCs (n = 7) (25 cells/image, 4 images, t‐test). F) Histogram of average resting membrane potentials (mV) measured by patch clamp in AML‐MSCs (n = 5, 11 cells) and h‐MSCs (n = 4, 10 cells, t‐test). G) Representative traces of two cells where resting membrane potential was recorded in current clamp configuration. H) Intracellular calcium increases in h‐MSCs treated or not with the depolarizing agent Ouabain 10 nm, and then loaded with Fluo‐4 AM probe and stimulated with KCl (n = 4, 100 cells, AU: arbitrary unit, t‐test performed at every other second, being significant from 30 to 50 s). I) DiBAC fluorescence intensity in h‐MSCs treated with BAPTA (50 µm) or EGTA (2 mm) alone or in combination (n = 3, t‐test comparing all treated groups versus h‐MSCs). J) DiBAC fluorescence intensity in h‐MSCs treated with Ouabain (10 nm, n = 4) or K+ gluconate (40 mm, n = 3, t‐test comparing treated groups versus h‐MSCs) and in AML‐MSCs treated with Ivermectin (IVM, 1 µm, n = 3) or Lubiprostone (Lubi, 10 µm, n = 5, t‐test comparing treated groups versus AML‐MSCs) for 72 h. All histograms show mean ± SEM; * p  < 0.05, ** p < 0.01, **** p < 0.0001.
Figure 2
Figure 2
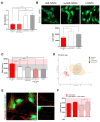
Vmem pharmacological depolarization induces an AML‐MSCs‐like phenotype in h‐MSCs. A) Cell proliferation of AML‐MSCs, h‐MSCs, and h‐MSCs treated with 40 mm K+ gluconate or 10 nm Ouabain by Presto Blue assay (n = 5). Data were normalized to time 0‐hour samples (t‐test comparing all groups versus h‐MSCs). B,C) Cell density of murine IL‐3–dependent 32D cell line cultured in the presence (black bar) or absence of IL‐3 (blue bar), compared with 32D cell line cultured on a layer of AML‐MSCs (red bar), h‐MSCs (grey) or h‐MSCs pre‐treated for 72 h with Ouabain (B, n = 5) or with K+ gluconate (C, n = 5). t‐test was performed to compare treated groups or AML‐MSCs versus h‐MSCs, with ±IL3 used as experimental control. D) Total branches length of HUVEC tubes by using conditioned medium derived from AML‐MSCs (n = 7) and h‐MSCs pre‐treated or not for 72 h with Ouabain or K+ gluconate and then stimulated (st) or not (unst) with a pro‐inflammatory cytokine cocktail (hIL‐1β, hIL‐6, and hTNF‐α) for 24 h; tube formation was evaluated after 4 h and normalized to unst condition (AU: arbitrary unit, n = 4, t‐test comparing treated or AML‐MSCs stimulated groups versus stimulated h‐MSCs). E) Percentage of PHA‐stimulated CD3+ T‐cells expressing CD69 and CD25 after 72 h of co‐culture with AML‐MSCs and h‐MSCs pre‐treated for 72 h with Ouabain or K+ gluconate, relative to SF condition (without MSCs) (n = 4, t‐test comparing treated or AML‐MSCs groups versus h‐MSCs). F) Relative expression measured by RQ‐PCR of IL‐6 (interleukin‐6) in h‐MSCs pre‐treated or not for 72 h with K+ gluconate (n = 4) and in AML‐MSCs (n = 3, t‐test comparing treated or AML‐MSCs groups versus h‐MSCs). G) IL‐6 protein secretion levels (pg/mL), measured by ELISA, in AML‐MSCs (n = 24) or in h‐MSCs pre‐treated or not for 72 h with K+ gluconate (n = 4 or n = 6, respectively), relative to h‐MSCs untreated condition (t‐test comparing treated or AML‐MSCs groups versus h‐MSCs). H–J) Relative RQ‐PCR expression of osteoprogenitor‐associated genes TNAP (Tissue‐nonspecific alkaline phosphatase, H, n = 7 h‐MSCs and n = 3 AML‐MSCs) and OPN (osteopontin, I, n = 6 h‐MSCs and n = 3 AML‐MSCs), and pro‐inflammatory gene PTGS2 (prostaglandin‐endoperoxide synthase 2, J), n = 7 h‐MSCs and n = 5 AML‐MSCs) in h‐MSCs pre‐treated or not for 72 h with Ouabain or K+ gluconate and in AML‐MSCs. T‐test was used to compare the treated or AML‐MSCs groups versus h‐MSCs. All histograms show mean ± SEM; * p < 0.05, ** p < 0.01, *** p < 0.001.
Figure 3
Figure 3
AML blasts depolarize MSCs Vmem by cell–cell contact. A) Time course of DiBAC fluorescence intensity in h‐MSCs during co‐culture with AML blasts (ratio 1:10) calculated for the first 30 min of co‐culture and normalized with respect to t0 fluorescence intensity value (15 cells, n = 1). B) Vmem variations measured by DiBAC fluorescence intensity in h‐MSCs co‐cultured with AML blasts for 30 min, 3 days or 7 days (n = 3, t‐test comparing all groups versus h‐MSCs). DiBAC fluorescence intensity of h‐MSCs cultured alone was used as control. C) DiBAC fluorescence intensity in h‐MSCs (n = 9), h‐MSCs cultured with AML blasts for 4 days (iAML‐MSCs, n = 15), and AML‐MSCs (n = 11). Pink and grey bands represent the interval values of AML‐ and h‐MSCs DiBAC intensity, respectively, after 4 days of culture. T‐test was used to compare i‐AML‐MSCs or AML‐MSCs versus h‐MSCs. D) Histogram of average resting membrane potentials (mV) measured by patch clamp in h‐MSCs (n = 4, 10 cells), iAML‐MSCs (n = 4, 10 cells), and AML‐MSCs (n = 5, 11 cells). T‐test was used to compare i‐AML‐MSCs or AML‐MSCs versus h‐MSCs. E,F) DiBAC fluorescence intensity in iAML‐MSCs treated with CBX (100 µm, n = 3) or silenced for Cx‐43 (n = 3) during co‐culture with AML blasts. h‐MSCs siRNeg and siRCx‐43 DiBAC fluorescence intensity were used as controls. T‐test was performed to compare h‐MSCs or i‐AML‐MSCs treated with CBX/SirCx43 versus i‐AML‐MSCs. G) Fluorescence intensity measured by DiBAC staining after 3 days of h‐MSCs co‐culture with AML primary cells or normal PBMCs (n = 7), with or without the addition of CBX (n = 3). T‐test was performed to compare all groups with their respective h‐MSCs group. H) DiBAC intensity of h‐MSCs co‐culture with AML primary cells or normal PBMCs for 3 days (n = 7), 6 days (n = 3), or 3 days of co‐culture followed by 3 days of washout (WO, n = 3). T‐test used to compare all groups with their respective h‐MSCs group. All histograms show mean ± SEM; * p < 0.05, ** p < 0.01, *** p < 0.001, **** p < 0.0001.
Figure 4
Figure 4
AML‐MSCs Vmem pharmacological hyperpolarization restores a healthy phenotype. A) Cell proliferation measured by Presto Blue assay in h‐MSCs and AML‐MSCs treated or not with 10 µm Lubi or 1 µm IVM for 72 h (n = 4, t‐test comparing all groups versus AML‐MSCs). B,C) Cell density of murine IL‐3–dependent 32D cell line cultured in the presence or absence of IL‐3, with h‐MSCs, and compared with 32D cell line co‐cultured on AML‐MSCs layer treated with Lubi (B, n = 5) or IVM (C, n = 5). T‐test was performed to compare treated groups or h‐MSCs versus AML‐MSCs, with ±IL3 used as experimental control. D) Total branches length of HUVEC tubes by using conditioned medium derived from h‐MSCs (n = 4) and AML‐MSCs untreated (n = 7) or pre‐treated with Lubi (n = 8) or IVM (n = 5) for 72 h and then stimulated (st) or not (unst) with a pro‐inflammatory cytokine cocktail for 24 h; tube formation was evaluated after 4 h and normalized to unst condition (AU: arbitrary unit, t‐test comparing treated or h‐MSCs stimulated groups versus stimulated AML‐MSCs). E) Percentage of PHA‐stimulated CD3+ T‐cells expressing CD69 and CD25 after 72 h of co‐culture on a layer of h‐MSCs or AML‐MSCs treated or not with Lubi (10 µm) or IVM (1 µm), relative to SF condition (n = 4, t‐test comparing treated or h‐MSCs groups versus AML‐MSCs). F,G) Relative expression of osteoprogenitor‐associated genes TNAP (F, n = 7 AML‐MSCs, n = 4 h‐MSCs) and OPN (G, n = 6 AML‐MSCs, n = 4 h‐MSCs) in h‐MSCs and AML‐MSCs treated or not for 72 h with Lubi (10 µm) or IVM (1 µm) and measured by RQ‐PCR (t‐test comparing treated or h‐MSCs groups versus AML‐MSCs). All histograms show mean ± SEM; * p < 0.05, ** p < 0.01, *** p < 0.001, **** p < 0.0001.
Figure 5
Figure 5
Vmem of MSCs controls CaV1.2 expression. A) CaV1.2 expression in h‐MSCs when co‐cultured with AML cells (red bar) for 4 days or treated with Ouabain or K+ gluconate (red bar) for 72 h, relative to h‐MSCs (grey bar), analyzed by flow cytometry (n = 3, t‐test comparing all groups versus h‐MSCs). B) CaV1.2 expression in AML‐MSCs when treated with Lubi or IVM (grey bar, n = 4) for 72 h, normalized to AML‐MSCs (red bar), analyzed by flow cytometry (t‐test comparing all groups versus AML‐MSCs). C) Cell viability was analyzed by ATP of h‐MSCs pre‐treated or not for 72 h with Ouabain or K+ gluconate and then incubated for 48 h with lercanidipine. ATP values were normalized to their respective untreated control (DMSO, n = 6, t‐test comparing all groups versus untreated h‐MSCs). D) Cell viability, measured by ATP, of AML‐MSCs pre‐treated or not for 72 h with Lubi or IVM and then for 48 h with lercanidipine, relative to DMSO value (n = 8, t‐test comparing all groups versus untreated AML‐MSCs). Dotted line represents 50% cell viability. All histograms show mean ± SEM; * p < 0.05, ** p < 0.01.
Figure 6
Figure 6
CaV1.2 expression controls MSCs Vmem depolarization. A) Relative CACNA1C (CaV1.2) mRNA expression measured by RQ‐PCR in AML‐MSCs UT, transduced with control GFP‐mCherry or CaV‐mCherry LVs (re‐AML‐MSCs, n = 11), or h‐MSCs (n = 3, t‐test comparing all groups versus AML‐MSCs). B) Representative images of immunofluorescence staining of CaV1.2 (green) and DAPI nuclear counterstain (blue) and relative quantification of CaV1.2 mean fluorescence intensity (MFI) (20X, 20 cells/image, 5 images, scale bar = 50 µm, n = 3 AML‐MSCs and re‐AML‐MSCs, n = 2 h‐MSCs, t‐test comparing all groups). C) DiBAC intensity of AML‐MSCs (n = 9), re‐AML‐MSCs total (n = 9) or gated on mCherry positive cells (n = 6), in a mixed culture of re‐AML‐MSCs and AML‐MSCs UT (ratio 1:1, n = 4), and h‐MSCs as control (n = 3). T‐test was adopted to compare all groups versus AML‐MSCs). D) Principal Component Analysis (PCA) performed on gene expression data of h‐MSCs (grey, n = 6), AML‐MSCs (red, n = 21), AML‐MSCs UT (black, n = 2), and re‐AML‐MSCs (orange, n = 8). Big dots represent the cluster centroid, and small dots represent samples. E) Representative images showing the presence of CaV1.2 channel inside the TNTs. Green indicates CaV1.2, blue indicates nuclei staining with DAPI, and red indicates F‐actin staining with Alexa647‐Phalloidin (100X, scale bar = 10 µm). F) DiBAC intensity in AML‐MSCs and in a mixed culture of re‐AML‐MSCs and AML‐MSCs UT (ratio 1:1), treated or not with 100 µm Carbenoxolone (CBX) for 72 h (n = 6). T‐test was applied to compare treated MSCs versus untreated. All histograms show mean ± SEM; * p < 0.05, ** p < 0.01, *** p < 0.001, **** p < 0.0001.
Figure 7
Figure 7
Vmem of MSCs influences leukemia proliferation and normal hematopoiesis. A) DiBAC fluorescence intensity of h‐MSCs (n = 2), AML‐MSCs (n = 3) and re‐AML‐MSCs (n = 2) in 3D. T‐test was performed to compare all groups. B) Percentage of Ki‐67 positive AML blasts after a 7‐day co‐culture in 3D with AML‐MSCs (n = 3), re‐AML‐MSCs (n = 2), h‐MSCs treated or not with K+ gluconate (n = 2, t‐test comparing all groups). C) Cell density of CD34+ cells after a 5‐day co‐culture with AML‐MSCs UT, re‐AML‐MSCs (n = 9), and h‐MSCs (n = 3). CD34+ cells cultured in SF conditions were used as controls. T‐test was performed to compare all groups. D) Percentage of Ki‐67 positive CD34+ cells after 5 days of co‐culture with AML‐MSCs UT, re‐AML‐MSCs, and h‐MSCs (n = 3, t‐test comparing all groups versus AML‐MSCs). E) On the top, schematic representation of the in vivo pipeline. On the bottom, percentage of human CD45 cells in NSG mice PB at 3, 5, and 10 weeks after tail vein co‐infusion of 1.0 × 105 human cord blood CD34+ cells with 1.0 × 106 h‐MSCs (n = 3 mice), AML‐MSCs (n = 6 mice), or re‐AML‐MSCs (n = 6 mice, t‐test comparing all groups). Created with BioRender.com. All histograms show mean ± SEM; * p < 0.05, ** p < 0.01, *** p < 0.001.

References

    1. Hoggatt J., Kfoury Y., Scadden D. T., Annu. Rev. Pathol. Mech. Dis. 2016, 11, 555. - PubMed
    1. McLaughlin K. A., Levin M., Dev. Biol. 2018, 433, 177. - PMC - PubMed
    1. Schofield Z., Meloni G. N., Tran P., Zerfass C., Sena G., Hayashi Y., Grant M., Contera S. A., Minteer S. D., Kim M., Prindle A., Rocha P., Djamgoz M. B. A., Pilizota T., Unwin P. R., Asally M., Soyer O. S., J. R. Soc. Interface 2020, 17, 20200013. - PMC - PubMed
    1. Fan J. J., Huang X.. in Reviews of physiology, biochemistry and pharmacology, Springer International Publishing, Berlin: 2020, pp. 103–133.
    1. Buchanan P. J., McCloskey K. D., Eur. Biophys. J. 2016, 45, 621. - PMC - PubMed

MeSH terms

Substances

LinkOut - more resources