. 2025 Aug 20;16(1):7438.
doi: 10.1038/s41467-025-62486-3.

Tumor cell-adipocyte gap junctions activate lipolysis and contribute to breast tumorigenesis

Affiliations

Tumor cell-adipocyte gap junctions activate lipolysis and contribute to breast tumorigenesis

Jeremy Williams et al. Nat Commun. .

Abstract

A pro-tumorigenic role for adipocytes has been identified in breast cancer, and reliance on fatty acid catabolism found in aggressive tumors. The molecular mechanisms by which tumor cells coopt neighboring adipocytes, however, remain incompletely understood. Here, we describe a direct interaction linking tumorigenesis to adjacent adipocytes. We examine breast tumors and their normal adjacent tissue from several patient cohorts, patient-derived xenografts, and mouse models, and find that lipolysis and lipolytic signaling are activated in neighboring adipose tissue. We find that functional gap junctions form between breast cancer cells and adipocytes. As a result, cAMP is transferred from breast cancer cells to adipocytes and activates lipolysis in a gap junction-dependent manner. We find that connexin 31 (GJB3) promotes receptor triple negative breast cancer growth and activation of lipolysis in vivo. Thus, direct tumor cell-adipocyte interaction contributes to tumorigenesis and may serve as a new therapeutic target in breast cancer.


Conflict of interest statement

Competing interests: The authors declare no competing interests.

Figures

Fig. 1
Fig. 1. Lipolysis and lipolytic signaling are activated in breast tumor-adjacent adipocytes from breast cancer patients and mouse models of breast cancer.
a Representative lipid content image (left) and hematoxylin and eosin-stained excision specimen (right) from patients with invasive breast cancer. Lesion (L), and NAT 0–2 mm (R1), 2–4 mm (R2), and 4–6 mm (R3) away are indicated. b Percent lipid content (lipid content/lipid + water + protein content) of L, R1, R2, and R3 from patients (n = 46) with invasive breast cancer (L vs R1 p < 0.0001, R1 vs R2 p = 0.0038, R2 vs R3 p = 0.0451). c Adipocyte area in R1 (blue) and R3 (red) from a subset of patients (n = 11) in (b). Black line indicates mean adipocyte area, and patient identifiers are indicated. Each point represents an individual adipocyte. d Correlation of change in lipid content in (b) and change in average adipocyte area in (c) from R3 to R1 for matched patients in (c). e ssGSEA enrichment scores for cAMP-dependent lipolysis signature in primary breast tumors (n = 9), NAT 1 cm (n = 7), 2 cm (n = 5), 3 cm (n = 3), and 4 cm (n = 4), and healthy non-tumor breast tissue (n = 10). f HNF4α protein abundance from LC-MS/MS of primary healthy control breast tissue (n = 42, p < 0.0001), NAT (n = 4) and stroma (n = 36, p < 0.0001), and of luminal A (n = 38, p < 0.0001), luminal B (n = 6, p < 0.0001), luminal A/B (n = 1, p = 0.0153), HER2-amplified (n = 9, p < 0.0001), HER2-amplified/luminal B (n = 5, p < 0.0001), and basal (n = 16, p < 0.0001) tumors. Each point represents individual sample LCM on which LC-MS/MS was performed; LCM and LC-MS/MS were performed in (n = 2) technical duplicates on sequential histological slides from each patient, and technical duplicates are displayed. g Immunoblot analysis (left) showing expression levels of lipolysis activators HSL and HNF4α, and phosphorylated HSL (pHSL S563) in healthy non-tumor mammary gland and NAT and tumor tissues from a panel of PDXs. Quantification (right) of displayed pHSL/HSL ratio, normalized to b-actin levels, for non-tumor (blue), and NAT (red) and indicated tumors. h Immunoblot analysis (left) showing expression levels of lipolysis activators HSL and HNF4α, and phosphorylated HSL (pHSL S563) in healthy non-tumor mammary gland (n = 3 mice), mock-transplanted mammary gland (n = 3 mice), and NAT and tumor tissues from (n = 3) MTB-TOM allografts. Quantification (right) of displayed pHSL/HSL ratio, normalized to b-actin level for each biological replicate. For (b and e), solid black lines indicate matched samples from individual patients. For (f and h) mean ± s.e.m. is shown. *P < 0.05, **P < 0.01, ***P < 0.001, ****P < 0.0001; repeated measures one-way ANOVA with multiple comparisons (b), two-way ANOVA with multiple comparisons (c), Spearman correlation and two-tailed t test (d), repeated measures mixed effects model with multiple comparisons (e), ordinary one-way ANOVA with multiple comparisons (f and h). For (g and h), the samples derive from the same experiment, but different gels for pHSL(S563), HNF4α, and Actin, and another for HSL were processed in parallel. Source data are provided as a Source Data file.
Fig. 2
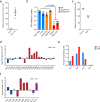
Fig. 2. Breast cancer cells form functional gap junctions and express Cx31.
a Relative frequency of dye transfer from Calcein AM-loaded cells (donor) to unloaded mCherry-labelled cells (recipient) as determined by FACS (fluorescence-activated cell sorting) analysis (p = 0.0050). Each point represents a biological replicate. b ATP levels in TN high MYC (red), TN low MYC (orange), and RP (blue) cell lines after treatment with 150 μM CBX for 24 h, relative to untreated (control) cells. Each point represents a biological replicate averaging three technical replicates. c Relative frequency of dye transfer from Calcein AM-loaded cells (donor) to unloaded mCherry-labeled cells (recipient) treated with 150 μM CBX or vehicle control for 24 h, as determined by FACS analysis (p < 0.0001). Each point represents a biological replicate. d Fold change (log2) in expression of indicated GJA (navy), GJB (maroon), GJC (purple), and GJD (green) connexin genes in TN (n = 123) versus RP (n = 648) tumors based on RNA-seq data acquired from TCGA of 771 breast cancer patients. e Fraction of cells in patient tumors of RP (blue, n = 6) and TNBC (red, n = 5) subtypes expressing indicated gap junction (GJ) family members, based on sc-RNA-seq of 317 tumor cells. f Fold change (log2) in expression of indicated GJA (navy), GJB (maroon), and GJC (purple) connexin genes in tumor (T, n = 10) versus non-tumor (NT, n = 3) tissues based on RNA-seq data from MTB-TOM allograft-bearing mice or healthy controls, respectively. For (ac) mean ± s.e.m. of three independent biological replicates is shown. **P < 0.01, ****P < 0.0001; unpaired two-tailed t test (a and c); ordinary one-way ANOVA with multiple comparisons (b). For (d and f), all differential expression analysis was done using the “limma” R package with a 0.05 adjusted P value. Source data are provided as a Source Data file.
Fig. 3
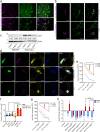
Fig. 3. Breast cancer cell-adipocyte gap junctions form, transfer cAMP, and activate lipolytic signaling dependent on Cx31 expression.
a Staining with Cx31 (green) and pan-cytokeratin (magenta) of primary TNBC patient biopsies. Scale bar, top 100 μm, bottom 25 μm. b Staining with Cx31 (green) and pan-cytokeratin (magenta) of primary mammary adipose tissue from a healthy individual (PT001) injected with TN mCherry-HCC1143 cells (top) or RP mCherry-T47D cells (bottom) and co-cultured overnight. White arrowheads indicate staining of Cx31 along point of contact between HCC1143 and adipocyte plasma membranes. Scale bar, 25 μm. c Immunoblot analysis showing protein expression levels of Cx31 in vitro in (a) panel of clonally derived control GJB3WT and partial depletion TN lines with one-third and two- thirds loss of GJB3 expression. For the Cx31-depleted lines each clone is referred to by level of GJB3 expression (e.g., GJB3Med expresses two-thirds WT level, and GJB3Low expresses one third GJB3WT level). Quantification of displayed Cx31 level normalized to b-actin level is indicated. d Staining with Cx31 (magenta), pHSL(S563) (yellow), and phalloidin (blue), of healthy patient primary mammary tissue (PT002) injected with GFP-expressing HCC1143 GJB3WT (top), HCC1143-GJB3Low (middle), or T47D cells (bottom) and co-cultured overnight. White arrowheads indicate Cx31 staining at GFP cancer cell-adipocyte interface. Scale bar, 20 μm. e Dye transfer from indicated HCC1143 control and Cx31-depleted lines to primary mammary adipose tissue of indicated (n = 3) healthy individuals. f cAMP levels in TN high MYC (red), TN low MYC (orange, p = 0.0487), and RP (blue, p = 0.487) cell lines after treatment with 150 μM CBX for 24 h, relative to untreated (control) cells. Each point represents a biological replicate averaging three technical replicates. g cAMP transfer from indicated HCC1143 control and Cx31 partial expression loss lines to primary mammary adipose tissue of indicated (n = 3) healthy individuals. h Fold change in UCP1 (red) and FABP4 (blue) expression in differentiated adipocytes after treatment with vehicle (control) or 10 μM forskolin, or co-cultured with indicated Cx31 partial expression loss lines for 24 h. Representative results from experiments done in biological triplicates shown for (ad). For (f and h) mean ± s.e.m. of three independent biological replicates is shown. ^P < 0.10, *P < 0.05, **P < 0.01, ***P < 0.001; repeated measures one-way ANOVA with multiple comparisons for (e and g), ordinary one-way ANOVA with multiple comparisons for (f and h). Source data are provided as a Source Data file.
Fig. 4
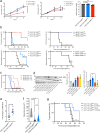
Fig. 4. Cx31 loss impairs breast cancer cell growth in vitro, tumorigenesis, and activation of lipolysis in adjacent adipocytes in vivo.
a Cell growth of indicated Cx31 partial depletion cell lines in HCC1143 (left) and HS578T (middle) over 72 h (n = 3 biological replicates), and cell viability at 72 h of indicated lines normalized to WT control (right, n = 3 biological replicates). b Kaplan–Meier analysis of tumor onset (top) and ethical endpoint survival (bottom) of mice bearing indicated Cx31 partial expression loss orthotopic xenografts (n = 5 per group). c Kaplan–Meier analysis of tumor onset in mice bearing indicated orthotopic xenografts with inducible Cx31 (shCx31) or GFP (shGFP) hairpin, with doxycycline (solid line, shGFP n = 7, shCx31 n = 5 mice) and without doxycycline (broken line, shGFP n = 13, shCx31 n = 5 mice). d Immunoblot analysis (left) showing expression levels of HSL and phosphorylated HSL (pHSL S563) in healthy non-tumor mammary gland (gray, n = 2 mice) and NAT from mice bearing indicated GJB3 WT (black), Med (blue) or Low (red) xenografts (n = 3) or mice that were transplanted, but did not develop a tumor (yellow, n = 2). Quantification of displayed total HSL(middle) and pHSL/HSL ratio (right), normalized to b-actin levels. Biological replicates from distinct mice are indicated. The samples derive from the same experiment, but different gels for HSL and Actin, and another for pHSL, were processed in parallel. e Fold change in cAMP levels in HCC1143 GJB3Med (n = 5) xenografts versus HCC1143 GJB3WT (n = 4) xenografts (p = 0.0492). f Adipocyte area adjacent to HCC1143 GJB3 Med xenografts (pooled from n = 5 tumors, n = 517 adipocytes) and HCC1143 GJB3 WT xenografts (pooled from n = 4, n = 771 adipocytes) and area in control non-tumor (NT) tissue (pooled n = 3 mice, n = 2611 adipocytes). Broken line indicates mean adipocyte area; dotted lines indicate quartiles. Each point represents an individual adipocyte. g Kaplan–Meier analysis of tumor onset of mice bearing HCC1143 GJB3WT (black) or GJB3Med (blue) orthotopic xenografts (n = 5 per group) and treated with vehicle (solid line) or with 1 mg/kg CL316243 (broken line). For (b and c), ethical endpoint survival indicates the percentage of mice bearing xenografts <2 cm in any dimension. For (a, d, and e) mean ± s.e.m. is shown. *P < 0.05, **P < 0.01, ***P < 0.001, ****P < 0.0001; unpaired two-tailed t test (a) (left and center) and (e), log-rank test (b, c, and g), ordinary one-way ANOVA with multiple comparisons (a) (right), (d and f). Source data are provided as a Source Data file.

References

    1. Goodwin, P. J. & Chlebowski, R. T. Obesity and cancer: insights for clinicians. J. Clin. Oncol.34, 4197–4202 (2016). - PMC - PubMed
    1. Camarda, R. et al. Inhibition of fatty acid oxidation as a therapy for MYC-overexpressing triple-negative breast cancer. Nat. Med.22, 427–432 (2016). - PMC - PubMed
    1. Park, J. H. et al. Fatty acid oxidation-driven Src links mitochondrial energy reprogramming and oncogenic properties in triple-negative breast cancer. Cell Rep.14, 2154–2165 (2016). - PMC - PubMed
    1. Barnard, M. E. et al. Body mass index and mammographic density in a multiracial and multiethnic population-based study. Cancer Epidemiol. Biomark. Prev.31, 1313–1323 (2022). - PMC - PubMed
    1. Ye, H. et al. Leukemic stem cells evade chemotherapy by metabolic adaptation to an adipose tissue niche. Cell Stem Cell19, 23–37 (2016). - PMC - PubMed

MeSH terms