. 2025 Aug 20;16(1):7757.
doi: 10.1038/s41467-025-62756-0.

Intracristal space proteome mapping using super-resolution proximity labeling with isotope-coded probes

Affiliations

Intracristal space proteome mapping using super-resolution proximity labeling with isotope-coded probes

Myeong-Gyun Kang et al. Nat Commun. .

Abstract

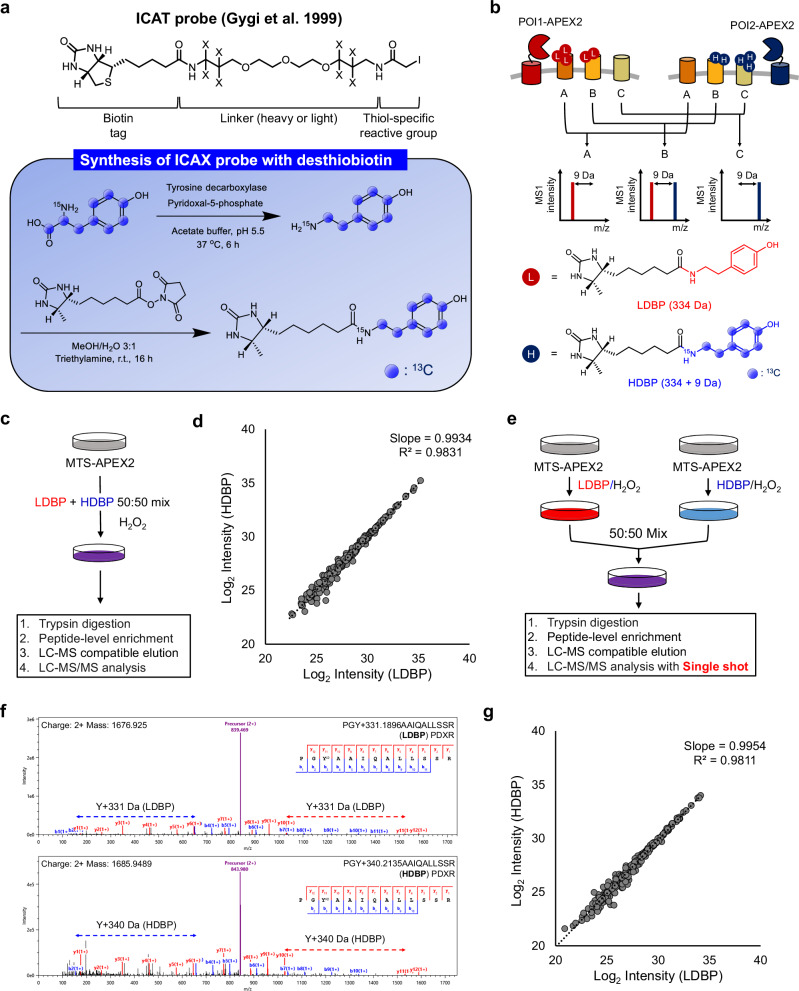
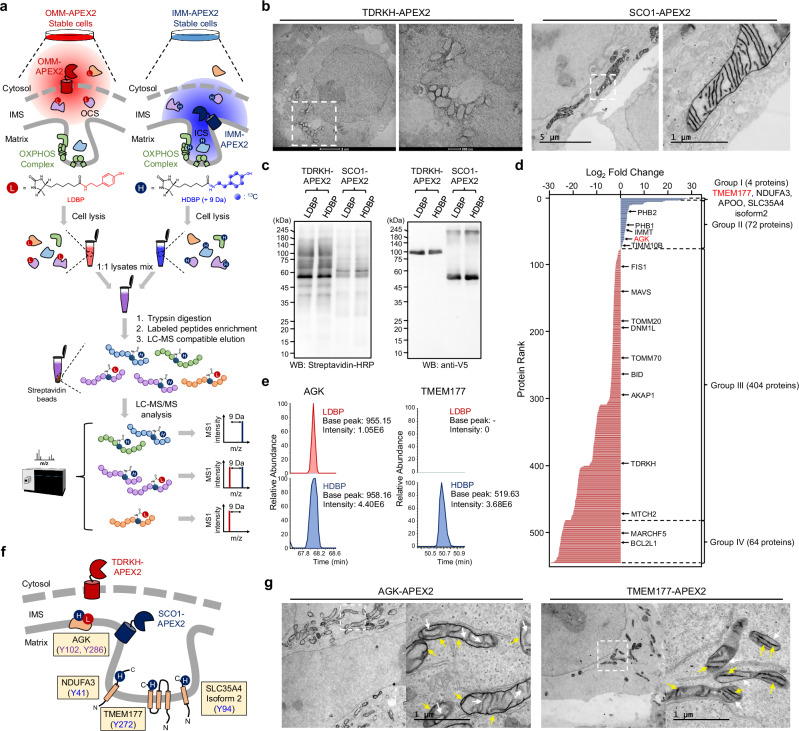
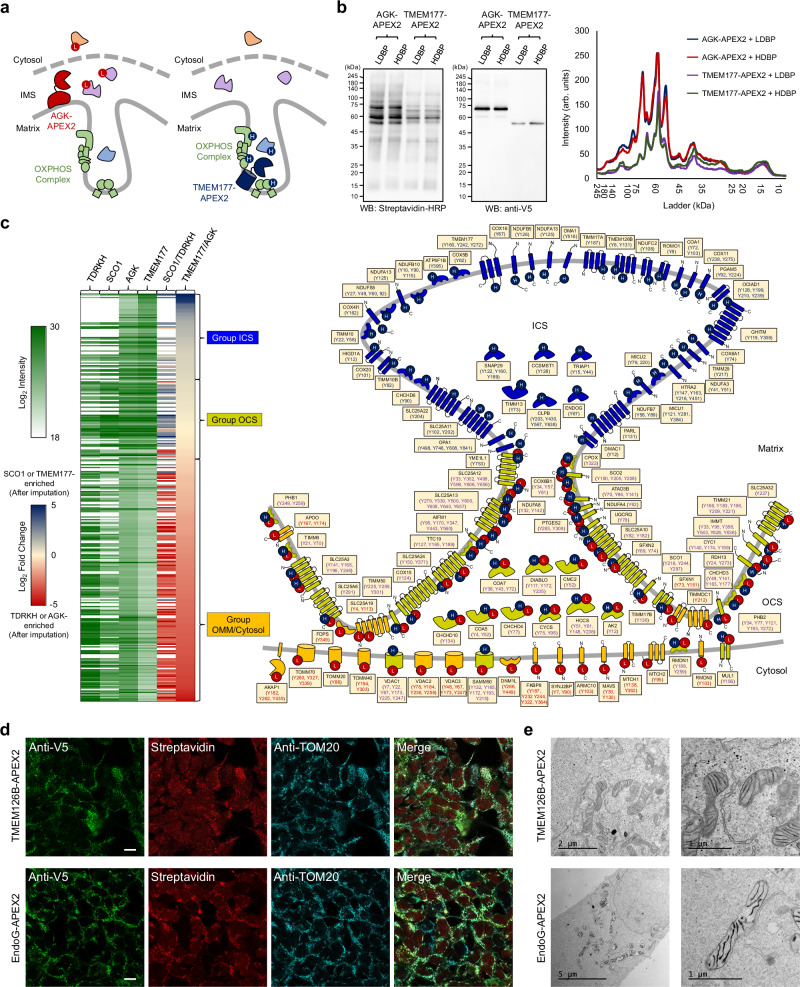
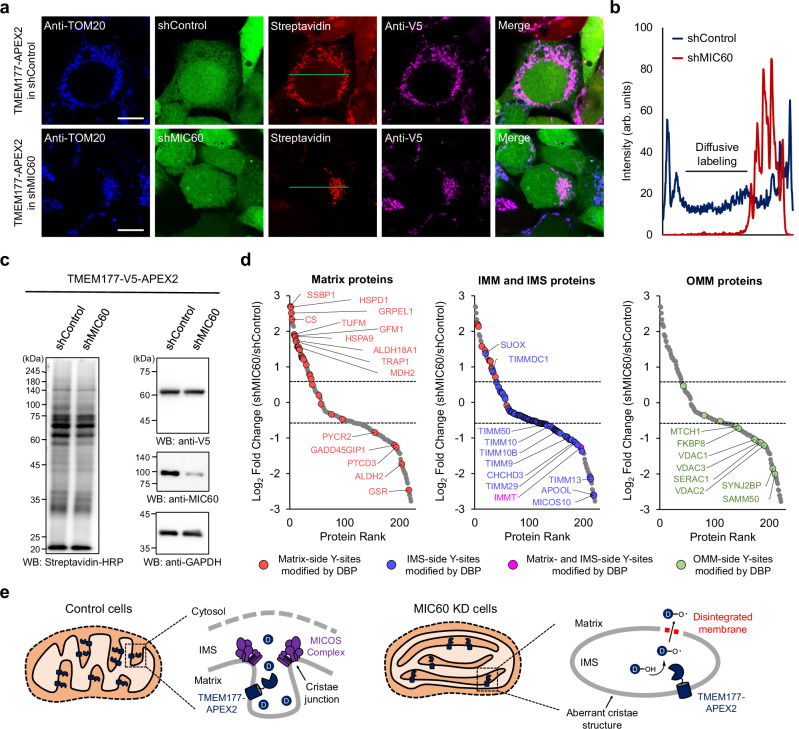
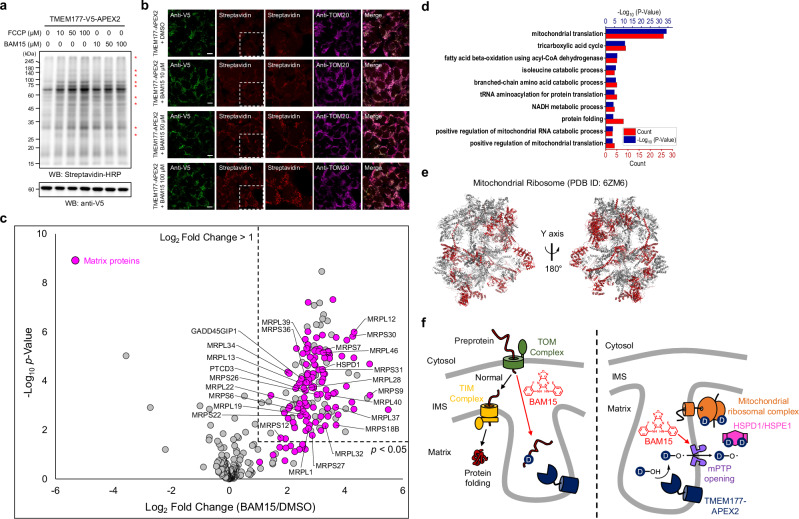
Proximity labeling with engineered ascorbate peroxidase (APEX) has been widely used to identify proteomes within various membrane-enclosed subcellular organelles. However, constructing protein distribution maps between two non-partitioned proximal spaces remains challenging with the current proximity labeling tools. Here, we introduce a proximity labeling approach using isotope-coded phenol probes for APEX labeling (ICAX) that enables the quantitative analysis of the spatial proteome at nanometer resolution between two distinctly localized APEX enzymes. Using this technique, we identify the spatial proteomic architecture of the mitochondrial intracristal space (ICS), which is not physically separated from the peripheral space. ICAX analysis further reveals unexpected dynamics of the mitochondrial spatiome under mitochondrial contact site and cristae organizing system (MICOS) complex inhibition and mitochondrial uncoupling, respectively. Overall, these findings highlight the importance of ICS for mitochondrial quality control under dynamic stress conditions.


Conflict of interest statement

Competing interests: A patent application with M.-G.K. and H.W.R. has been filed by Seoul National University relating to this work. The remaining authors declare no competing interests.

Figures

Fig. 1
Fig. 1. Chemical synthesis of isotope-coded ascorbate peroxidase probes for quantitative proximity labeling.
a Chemical structure of heavy isotope-coded ascorbate peroxidase (APEX) probes used in this study. APEX probes were synthesized from tyrosine and conjugated with a desthiobiotin moiety. b Schematic representation of the quantitative mass analysis of proximity-dependent, labeled tyrosine residues using APEX probes. c Schematic representation of the experimental design of the equal activity test of desthiobiotin conjugated APEX probes (light desthiobiotin-phenol [LDBP] and heavy desthiobiotin-phenol [HDBP], 50:50 ratio mixture) on cells expressing mitochondrial targeting sequence (MTS)-APEX2. d Scatter plot showing MS1 intensity of both LDBP- and HDBP-modified proteins labeled using MTS-APEX2 with equimolar pre-mixed probe solutions (n = 3 biological replicates). R-squared (R2) values and trendline slopes were used to validate accuracy. e Experimental procedure of duplexed quantification using the ICAX method. f Annotated mass spectrometry (MS)/MS spectra of the LDBP- and HDBP-modified peptides (PGY*AAIQAALSSR) for the PDXR protein. g Scatter plot showing the MS1 intensity of both LDBP- and HDBP-modified peptides identified by ICAX analysis. R2 values and trendline slopes in biological triplicate experiments are listed in the Supplementary Fig. 3a.
Fig. 2
Fig. 2. Duplexed super-resolution proximity labeling analysis using isotope-coded phenol probes for APEX labeling and its application in ICS proteome profiling.
a Strategy for intracristal space (ICS) proteome mapping using desthiobiotin-conjugated isotope-coded phenol probes for APEX labeling (ICAX). Light desthiobiotin-phenol (LDBP) modified proteins labeled with outer mitochondrial membrane (OMM)-APEX2 were mixed with heavy desthiobiotin-phenol (HDBP) modified proteins labeled with inner mitochondrial membrane (IMM)-APEX2 after cell lysis. The mixed proteome was digested and subjected to the enrichment procedure of labeled peptides using streptavidin beads, followed by liquid chromatography-mass spectrometry (LC-MS)/MS analysis for isotopic MS1 quantification. b Electron microscopic (EM) images of TDRKH-APEX2 (OMM-APEX2) and SCO1-APEX2 (IMM-APEX2) after DAB staining. The boxed region is expanded in the image on the right. c Labeled proteins were analyzed via western blotting with streptavidin-HRP. The levels of TDRKH-APEX2 and SCO1-APEX2 were confirmed via western blotting with an anti-V5 antibody. d Bar graph showing the FC values of proteins labeled with TDRKH-APEX2 (LDBP) and SCO1-APEX2 (HDBP); groups I–IV (a total of 544 proteins). OMM and IMM marker proteins are indicated according to MitoCarta 3.0. n = 3 biological replicates. e MS1 intensity of AGK and TMEM177, labeled with LDBP (TDRKH-APEX2) and HDBP (SCO1-APEX2), respectively. f Membrane topology and labeled sites of the representative ICS and outer ICS (OCS) proteins. g EM images of AGK-APEX2 and TMEM177-APEX2 after diaminobenzidine (DAB) staining. The white dashed box indicates the region of interest, which is enlarged in the adjacent image. White arrows indicate the mitochondrial membrane stained with OsO4, and yellow arrows indicate the DAB precipitate stained with OsO4.
Fig. 3
Fig. 3. ICS proteome mapping using AGK- and TMEM177-APEX2.
a Schematic representation showing TMEM177-APEX2 and AGK-APEX2 labeling using isotope-coded phenol probes for APEX labeling (ICAX) for the identification of intracristal space (ICS) and outer ICS (OCS) proteins, respectively. b Streptavidin-HRP western blot pattern of light desthiobiotin-phenol (LDBP)- and heavy desthiobiotin-phenol (HDBP) proteins labeled with AGK-APEX2 and TMEM177-APEX2. APEX2 expression levels were detected using an anti-V5 antibody. c Heat map-based comparison of the TMEM177/AGK (n = 4 biological replicates) and SCO1/TDRKH datasets. The ICS, OCS, and outer mitochondrial membrane (OMM)/Cytosol groups were classified based on fold-change values; the inner mitochondrial membrane, intermembrane space, and OMM proteins in each group are illustrated according to their known topology in the right panel, with modification sites from the TMEM177/AGK dataset. A blank space indicates that no proteins were detected in the primary SCO1/TDRKH dataset. d Confocal images of TMEM126B-APEX2 and EndoG-APEX2 obtained after immunostaining. Scale bars represent 10 µm. e Localization of TMEM126B and EndoG validated through APEX electron microscopy imaging.
Fig. 4
Fig. 4. Proteome mapping in the aberrant ICS induced by the MICOS complex inhibition.
a Confocal imaging results showed aggregated mitochondria in the MIC60 KD cells. Anti-V5 and anti-TOM20 antibodies were used to visualize TMEM177-APEX2 and mitochondria, respectively. Scale bars represent 10 µm. b Line scan analysis for region of interest (green line) in (a) shows diffusivity of DBP radicals. (c) Biotinylation level in MIC60 knockdown (KD) cells was detected by western blotting using streptavidin-HRP. TMEM177-V5-APEX2 expression level was visualized using an anti-V5 antibody, and GAPDH was used as a loading control. Reduced expression level of MIC60 in KD cells were determined by anti-MIC60 antibody. d Scatter plot showing the log2-fold change of the identified proteins in shMIC60 compared with shControl cells (n = 2 biological replicates). Identified proteins were highlighted according to their localization and the modification sites in the mitochondria. e Proposed model demonstrating that the inhibition of mitochondrial contact site and cristae organizing system (MICOS) complex leads to disintegration of membrane structures in aberrant intracristal space.
Fig. 5
Fig. 5. Mitochondrial dynamics under the mitochondrial uncoupling process.
a Western blot analysis of proteins labeled with desthiobiotin-phenol (DBP) using TMEM177-APEX2 after uncoupler treatment (e.g., FCCP or BAM15). Additional biotinylated bands are indicated by asterisks. TMEM177-APEX2 levels were analyzed using an anti-V5 antibody. b Confocal images showing the expression patterns of TMEM177-APEX2 and those of its biotinylated proteins with or without BAM15 treatment. Biotinylated proteins were stained with streptavidin-conjugated AF568, and APEX2 was detected using an anti-V5 antibody. Fluorescence intensity is indicative of the biotinylation signal intensity. Scale bars represent 10 µm. c Volcano plot analysis of proteins labeled with ICAX probes using TMEM177-APEX2 under BAM15 or DMSO (control) treatment (n = 4 biological replicates). The p value was obtained using an unpaired two-tailed Student’s t-test. Mitochondrial matrix proteins are displayed in pink dots, and mitochondrial ribosome subunits and mitochondrial heat shock proteins (HSPD1 and HSPE1) are indicated by gene names. d DAVID functional Gene ontology analysis of biological processes for the detected mitochondrial matrix proteins shown in (c). The p value was obtained using a Modified Fisher’s Exact Test. The red bar indicates the number of proteins involved in the described processes, and the dark blue bar indicates the –log10 p value. e Mitochondrial ribosomal subunits (24/111, red color) that were strongly labeled with TMEM177-APEX2 under uncoupler treatment are shown in the cryo-electron microscopy structure of the mitochondrial ribosome (PDB: 6ZM6). Nucleic acid chains and ligands have been omitted for clarity. f Proposed possible models of the mitochondrial intracristal subdomain dynamics during the mitochondrial uncoupling process.

Similar articles

References

    1. Martell, J. D. et al. Engineered ascorbate peroxidase as a genetically encoded reporter for electron microscopy. Nat. Biotechnol.30, 1143–1148 (2012). - PMC - PubMed
    1. Rhee, H. W. et al. Proteomic mapping of mitochondria in living cells via spatially restricted enzymatic tagging. Science339, 1328–1331 (2013). - PMC - PubMed
    1. Choi-Rhee, E., Schulman, H. & Cronan, J. E. Promiscuous protein biotinylation by Escherichia coli biotin protein ligase. Protein Sci.13, 3043–3050 (2004). - PMC - PubMed
    1. Roux, K. J., Kim, D. I., Raida, M. & Burke, B. A promiscuous biotin ligase fusion protein identifies proximal and interacting proteins in mammalian cells. J. Cell Biol.196, 801–810 (2012). - PMC - PubMed
    1. Branon, T. C. et al. Efficient proximity labeling in living cells and organisms with TurboID. Nat. Biotechnol.36, 880–887 (2018). - PMC - PubMed

MeSH terms

LinkOut - more resources