. 2025 Aug 20;8(1):1254.
doi: 10.1038/s42003-025-08577-9.

Changes in brain connectivity and neurovascular dynamics during dexmedetomidine-induced loss of consciousness

Affiliations

Changes in brain connectivity and neurovascular dynamics during dexmedetomidine-induced loss of consciousness

Panagiotis Fotiadis et al. Commun Biol. .

Abstract

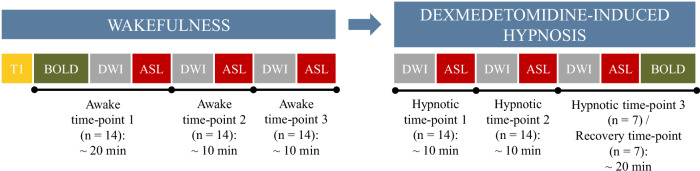
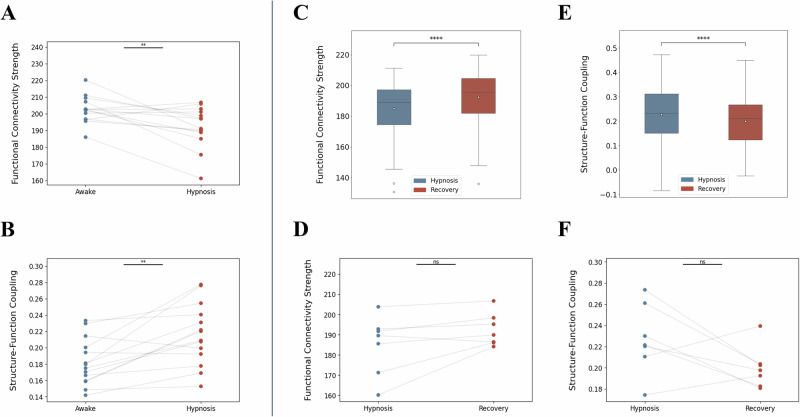
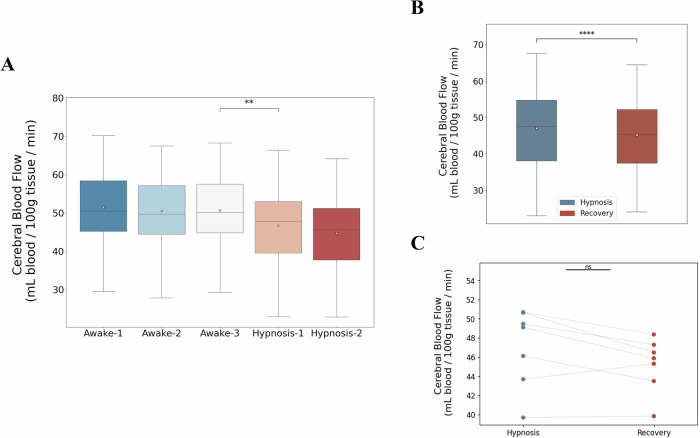
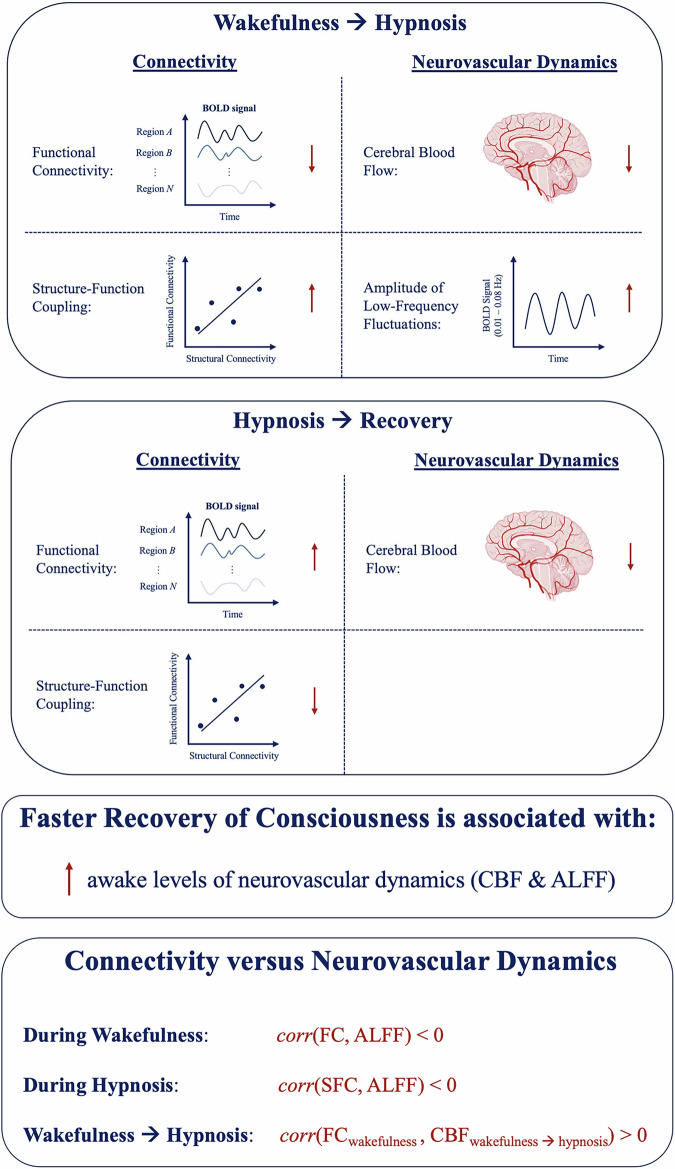
Understanding the neurophysiological changes underlying conscious-unconscious transitions is a key goal in neuroscience. Using magnetic resonance neuroimaging, we investigate the network connectivity and neurovascular changes occurring as the human brain transitions from wakefulness to dexmedetomidine-induced hypnosis, and recovery. Hypnosis led to widespread decreases in functional connectivity strength and increased structure-function coupling, indicating functional patterns more constrained by the underlying anatomical connectivity. As individuals began to regain consciousness, both connectivity markers returned towards awake levels, with particularly prominent coupling changes across the cerebellum. Neurovascular dynamics were disrupted during hypnosis as well: cerebral blood flow decreased globally-most notably in the brainstem, thalamus, and cerebellum-and continued decreasing even as recovery commenced, except within the cerebellum. Notably, regions with higher functional connectivity strength during wakefulness exhibited greater blood flow reductions during hypnosis. Hypnosis also heightened the amplitude of low-frequency fluctuations in the hemodynamic signal, especially in visual and somatomotor regions. Critically, individuals who regained consciousness faster displayed higher baseline levels of both neurovascular, but not connectivity, markers. Together, these results reveal that the induction of, and emergence from, dexmedetomidine-induced unconsciousness involve widespread, coordinated changes in brain connectivity and neurovascular function; across our findings, we also highlight the recurrent role of cerebellum in conscious-unconscious transitions.


Conflict of interest statement

Competing interests: The authors declare no competing interests. Citation diversity statement: Recent work in several fields of science has identified a bias in citation practices such that papers from women and other minority scholars are under-cited relative to the number of such papers in the field105–109. We obtained the predicted gender of the first and last author of each reference by using databases that store the probability of a first name being carried by a woman109. By this measure (and excluding self-citations to the first and last authors of our current paper), our references contain 3% woman(first)/woman(last), 12.9% man/woman, 29.7% woman/man, and 54.4% man/man. This method is limited in that a) names, pronouns, and social media profiles used to construct the databases may not, in every case, be indicative of gender identity and b) it cannot account for intersex, non-binary, or transgender people. We look forward to future work that could help us better understand how to support equitable practices in science.

Figures

Fig. 1
Fig. 1. Experimental design.
Schematic illustration of the experimental setup used in this study. Healthy individuals (n = 14) underwent a magnetic resonance imaging (MRI) battery consisting of structural (T1-weighted), resting-state (BOLD) functional MR, diffusion-weighted, and arterial spin labeling imaging, while awake. Each awake time-point is denoted, followed by the total number of individuals who completed it and the approximate duration. The MRI data collection during wakefulness lasted ~46 min. Each participant then received an intravenous dexmedetomidine bolus over 10 min (1 μg/kg), followed by a continuous dexmedetomidine intravenous infusion (1 μg/kg/h). Once individuals were behaviorally unconscious, the same MRI battery was repeated during hypnosis. For hypnotic time-points 1 and 2, data from all individuals (n = 14) were used. During the last experimental time-point (hypnotic time-point 3/recovery time-point), a subset of individuals began recovering from hypnosis (recovery sample: n = 7); the remaining individuals (unconscious sample: n = 7) remained unconscious. MRI data collection during hypnosis lasted ~40 min. BOLD blood oxygen level-dependent signal, DWI diffusion-weighted imaging, ASL arterial spin labeling.
Fig. 2
Fig. 2. Whole-brain changes in functional connectivity strength and structure-function coupling from wakefulness to dexmedetomidine-induced unconsciousness.
A Changes in whole-brain functional connectivity strength across the 3 awake and 2 hypnotic time-points (n = 132 brain regions/datapoints for each boxplot, averaged across all individuals). B Changes in whole-brain functional connectivity strength across the average awake state and the average hypnotic state (n = 132 brain regions/datapoints for each boxplot, averaged across all individuals). C Changes in whole-brain structure-function coupling across the 3 awake and 2 hypnotic time-points (n = 132 brain regions/datapoints for each boxplot, averaged across all individuals). D Changes in whole-brain structure-function coupling across the average awake state and the average hypnotic state (n = 132 brain regions/datapoints for each boxplot, averaged across all individuals). p-value annotation legend: non-significant (ns): 0.05 < p ≤ 1, *: 0.01 < p ≤ 0.05, **: 0.001 < p ≤ 0.01, ***: 10−4 < p ≤ 10−3, ****: p ≤ 10−4; p-values in (A, C) correspond to repeated measures ANOVA tests followed by post-hoc correction for multiple comparisons (Tukey’s honestly significant difference [HSD] test), while p-values in (B, D) correspond to paired samples Wilcoxon tests.
Fig. 3
Fig. 3. Whole-brain changes in connectivity from wakefulness to dexmedetomidine-induced unconsciousness and then early-stage recovery.
A Changes in whole-brain functional connectivity strength for each individual across the average awake state and the average hypnotic state (n = 14 datapoints for each state, denoting each individual). Out of the 14 individuals, 10 displayed decreased magnitude. B Changes in whole-brain structure-function coupling for each individual across the average awake state and the average hypnotic state (n = 14 datapoints for each state, denoting each individual). Out of the 14 individuals, 12 displayed increased magnitude. C Changes in whole-brain functional connectivity strength across the last hypnotic time-point and the recovery time-point (n = 132 brain regions/datapoints for each boxplot, averaged across the 7 individuals that recovered consciousness before the end of the experiment). D Changes in whole-brain functional connectivity strength for each individual across the last hypnotic time-point and the recovery time-point (n = 7 datapoints for each state, denoting each individual that recovered consciousness before the end of the experiment). Out of the 7 individuals, 6 displayed increased magnitude. E Changes in whole-brain structure-function coupling across the last hypnotic time-point and the recovery time-point (n = 132 brain regions/datapoints for each boxplot, averaged across the 7 individuals that recovered consciousness before the end of the experiment). F Changes in whole-brain structure-function coupling for each individual across the last hypnotic time-point and the recovery time-point (n = 7 datapoints for each state, denoting each individual that recovered consciousness before the end of the experiment). Out of the 7 individuals, 5 displayed decreased magnitude. p-value annotation legend: non-significant (ns): 0.05 < p ≤ 1, *: 0.01 < p ≤ 0.05, **: 0.001 < p ≤ 0.01, ***: 10−4 < p ≤ 10−3, ****: p ≤ 10−4; p-values in (A, B, D, F) correspond to paired t-tests, while p-values in (C, E) correspond to paired samples Wilcoxon tests.
Fig. 4
Fig. 4. Whole-brain changes in amplitude of low-frequency fluctuations and cerebral blood flow from wakefulness to dexmedetomidine-induced unconsciousness.
A Changes in whole-brain amplitude of low-frequency fluctuations (ALFF) across the awake state and the hypnotic state (n = 132 brain regions/datapoints for each boxplot, averaged across the 7 individuals that remained unconscious until the end of the experiment). B Changes in whole-brain cerebral blood flow (CBF) across the average awake state and the average hypnotic state (n = 132 brain regions/datapoints for each boxplot, averaged across all individuals). C Changes in whole-brain ALFF for each individual across the awake state and the hypnotic state (n = 7 datapoints for each state, denoting each individual that remained unconscious until the end of the experiment). Out of the 7 individuals, 6 displayed increased magnitude. D Changes in whole-brain CBF for each individual across the average awake state and the average hypnotic state (n = 14 datapoints for each state, denoting each individual). Out of the 14 individuals, 12 displayed decreased magnitude. p-value annotation legend: non-significant (ns): 0.05 < p ≤ 1, *: 0.01 < p ≤ 0.05, **: 0.001 < p ≤ 0.01, ***: 10−4 < p ≤ 10−3, ****: p ≤ 10−4; p-values in (A, B) correspond to paired samples Wilcoxon tests, while p-values in (C, D) correspond to paired t-tests.
Fig. 5
Fig. 5. Whole-brain changes in cerebral blood flow from wakefulness to dexmedetomidine-induced unconsciousness and then early-stage recovery.
A Changes in whole-brain cerebral blood flow across the 3 awake and 2 hypnotic time-points (n = 132 brain regions/datapoints for each boxplot, averaged across all individuals). B Changes in whole-brain cerebral blood flow across the last hypnotic time-point and the recovery time-point (n = 132 brain regions/datapoints for each boxplot, averaged across the 7 individuals that recovered consciousness before the end of the experiment). C Changes in whole-brain CBF for each individual across the last hypnotic time-point and the recovery time-point (n = 7 datapoints for each state, denoting each individual that recovered consciousness before the end of the experiment). p-value annotation legend: non-significant (ns): 0.05 < p ≤ 1, *: 0.01 < p ≤ 0.05, **: 0.001 < p ≤ 0.01, ***: 10−4 < p ≤ 10−3, ****: p ≤ 10−4; the p-value in Fig. 5A corresponds to a repeated measures ANOVA test followed by post-hoc correction for multiple comparisons (Tukey’s honestly significant difference [HSD] test), the p-value in (B) corresponds to a paired samples Wilcoxon test, and the p-value in (C) corresponds to a paired t-test.
Fig. 6
Fig. 6. Regional changes in cerebral blood flow during the transition from wakefulness to dexmedetomidine-induced unconsciousness and then early-stage recovery.
Top row: Cerebral blood flow (CBF) changes during the transition from wakefulness to hypnosis along axial brain slices (left column), sagittal slices (middle column), and on a 3D rendered standardized (MNI152) brain (right column), across all individuals (n = 14). Warm colors indicate brain regions where CBF is higher during wakefulness, compared to hypnosis. Bottom row: CBF changes during the transition from hypnosis to early-stage recovery of consciousness along axial brain slices (left column), sagittal slices (middle column), and on a 3D rendered standardized (MNI152) brain (right column), across individuals within the recovery sample (n = 7). Warm colors indicate brain regions where CBF is higher during hypnosis, compared to recovery. The orientation of the axial slices on the leftmost column follows neurological convention. All spatial maps were generated using FSL’s randomize tool, a non-parametric permutation inference tool (number of permutations for each analysis = 5000). test statistic: threshold-free cluster enhancement-based statistic derived from FSL’s randomize tool; pFWE: p-value corrected for family-wise error.
Fig. 7
Fig. 7. Whole-brain differences in connectivity and neurovascular dynamics between the subset of individuals who remained unconscious until the end of the experiment (unconscious sample) and the individuals who started regaining consciousness earlier (recovery sample).
A Differences in whole-brain functional connectivity strength between the two samples (n = 132 brain regions/datapoints for each boxplot). B Differences in whole-brain structure-function coupling between the two samples (n = 132 brain regions/datapoints for each boxplot). C Differences in whole-brain amplitude of low-frequency fluctuations between the two samples (n = 132 brain regions/datapoints for each boxplot). D Differences in whole-brain cerebral blood flow between the two samples (n = 132 brain regions/datapoints for each boxplot). p-value annotation legend: non-significant (ns): 0.05 < p ≤ 1, *: 0.01 < p ≤ 0.05, **: 0.001 < p ≤ 0.01, ***: 10−4 < p ≤ 10−3, ****: p ≤ 10−4; p-values here correspond to two-sided Mann-Whitney U tests.
Fig. 8
Fig. 8. Schematic summary of main findings.
First box: Changes in connectivity (functional connectivity strength, structure-function coupling) and neurovascular dynamics (cerebral blood flow, amplitude of low-frequency fluctuations) in the human brain during the transition from wakefulness to dexmedetomidine-induced hypnosis. ↑: Marker increased during hypnosis, ↓: Marker decreased during hypnosis. Second box: Changes in connectivity (functional connectivity strength, structure-function coupling) and neurovascular dynamics (cerebral blood flow, amplitude of low-frequency fluctuations) in the human brain during the transition from dexmedetomidine-induced hypnosis to early-stage recovery of consciousness. ↑: Marker increased during recovery, ↓: Marker decreased during recovery. Third box: Faster recovery of consciousness was associated with increased levels of neurovascular dynamics, but not brain connectivity. CBF Cerebral Blood Flow, ALFF Amplitude of Low-Frequency Fluctuations. Fourth box: Relationship between the examined markers of connectivity and neurovascular dynamics. The function corr refers to the correlation between the examined markers, as reported in the manuscript. FC Functional Connectivity Strength, SFC Structure-Function Coupling, CBF Cerebral Blood Flow, ALFF Amplitude of Low-Frequency Fluctuations.

Update of

Similar articles

References

    1. Hudetz, A. G. General anesthesia and human brain connectivity. Brain Connect.2, 291–302 (2012). - PMC - PubMed
    1. Långsjö, J. W. et al. Returning from oblivion: imaging the neural core of consciousness. J. Neurosci.32, 4935–4943 (2012). - PMC - PubMed
    1. Shehabi, Y. et al. Early sedation with dexmedetomidine in critically ill patients. N. Engl. J. Med.380, 2506–2517 (2019). - PubMed
    1. Kaur, M. & Singh, P. M. Current role of dexmedetomidine in clinical anesthesia and intensive care. Anesth. Essays Res.5, 128–133 (2011). - PMC - PubMed
    1. Huupponen, E. et al. Electroencephalogram spindle activity during dexmedetomidine sedation and physiological sleep. Acta Anaesthesiol. Scand.52, 289–294 (2008). - PubMed

MeSH terms

Grants and funding

LinkOut - more resources