. 2025 Aug 20;16(1):7747.
doi: 10.1038/s41467-025-62913-5.

IWS1 positions downstream DNA to globally stimulate Pol II elongation

Affiliations

IWS1 positions downstream DNA to globally stimulate Pol II elongation

Aiturgan Zheenbekova et al. Nat Commun. .

Abstract

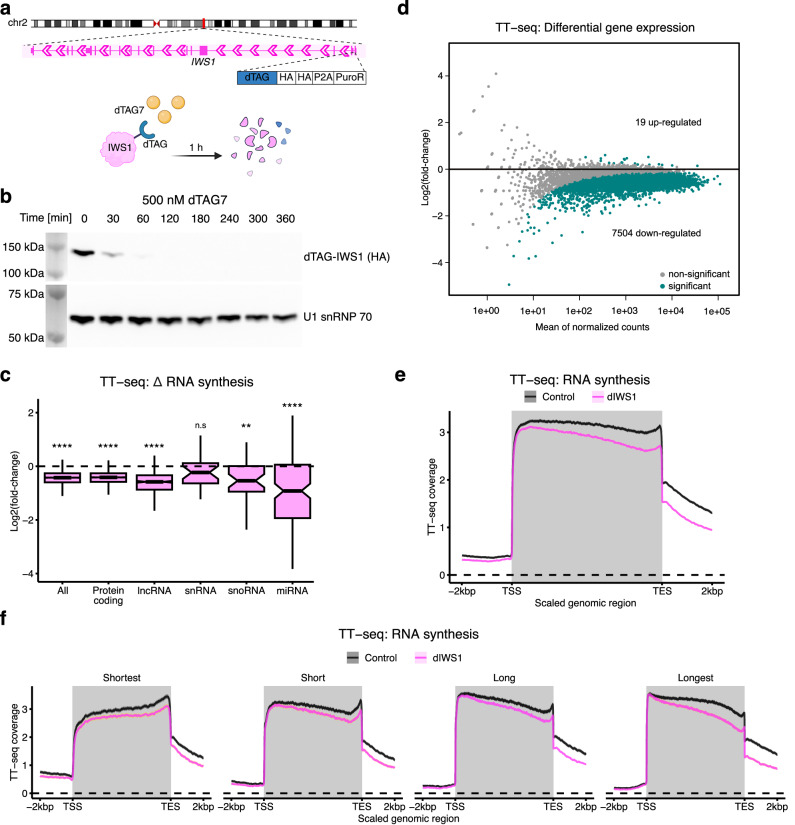
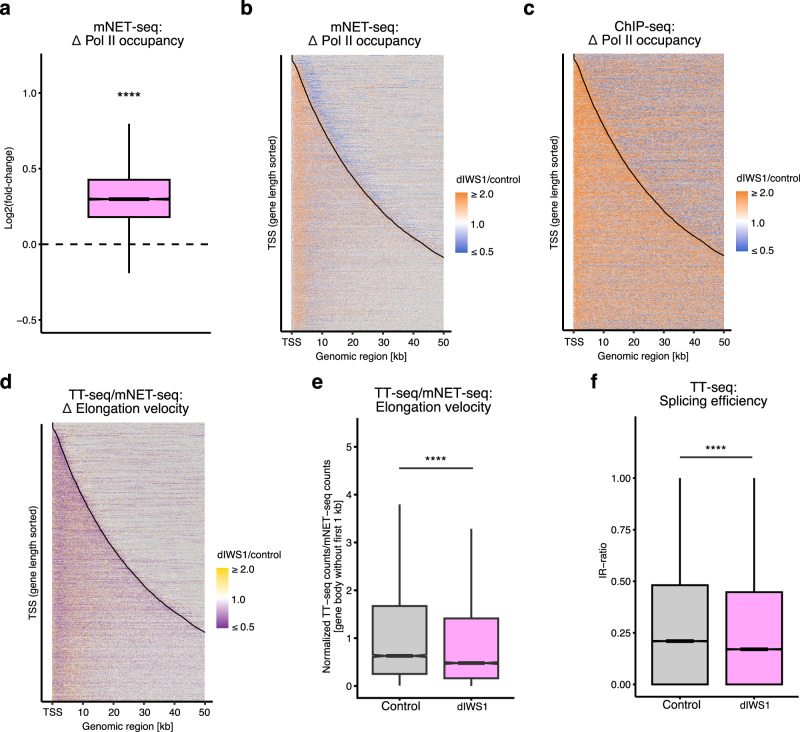
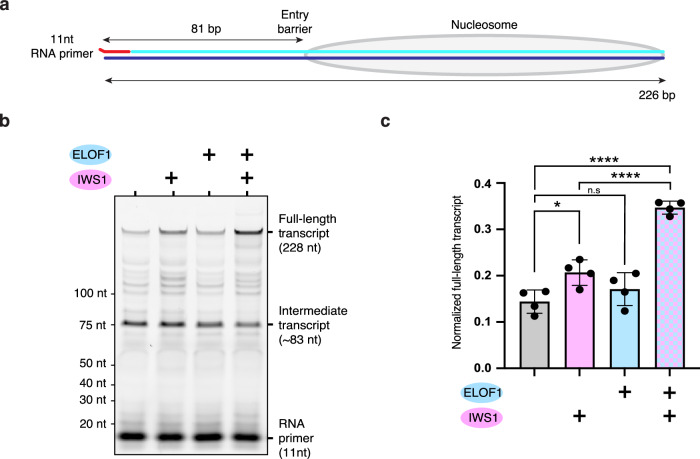
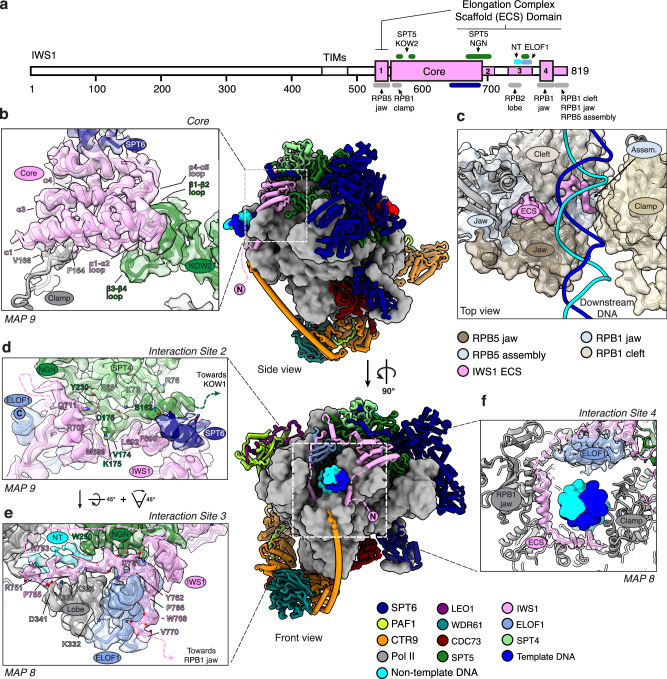
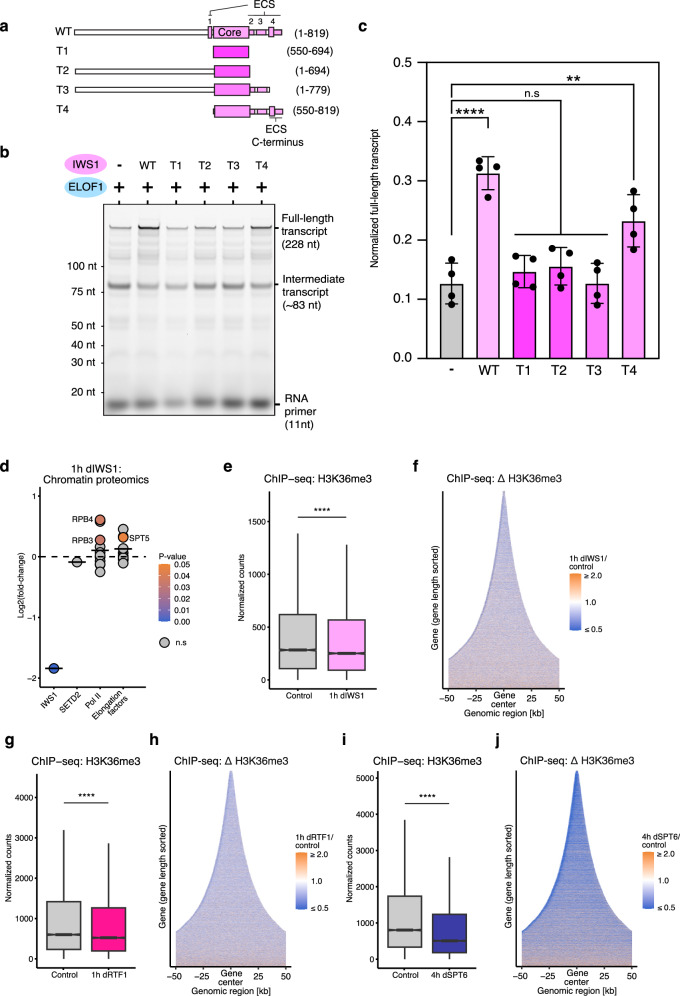
The protein IWS1 (Interacts with SPT6 1) is implicated in transcription-associated processes, but a direct role in RNA polymerase (Pol) II function is unknown. Here, we use multi-omics kinetic analysis after rapid depletion of IWS1 in human cells to show that loss of IWS1 results in a global decrease of RNA synthesis and a global reduction in Pol II elongation velocity. We then resolve the cryo-EM structure of the activated Pol II elongation complex with bound IWS1 and elongation factor ELOF1 and show that IWS1 acts as a scaffold and positions downstream DNA within the cleft of Pol II. In vitro assays show that the disordered C-terminal region of IWS1 that contacts the cleft of Pol II is responsible for stimulation of Pol II activity and is aided by ELOF1. Finally, we find that the defect in transcription upon IWS1 depletion leads to a decrease of histone H3 tri-methylation at residue lysine-36 (H3K36me3), but that this secondary effect is an indirect function of IWS1. In summary, our structure-function analysis establishes IWS1 as a Pol II-associated elongation factor that acts globally to stimulate Pol II elongation velocity and ensure proper co-transcriptional histone methylation.


Conflict of interest statement

Competing interests: The authors declare no competing interests.

Figures

Fig. 1
Fig. 1. IWS1 depletion leads to decreased RNA synthesis.
a Schematic representation of dTAG insertion into IWS1 gene using CRISPR/Cas9. Created in BioRender. Zheenbekova, A. (2025) https://BioRender.com/mjvatf1. b Western blots of IWS1 (anti-HA) in lysates of dTAG-IWS1 cells treated with dTAG7 for the indicated time. U1 snRNP 70 is a loading control. The experiment was repeated two times from independent biological replicates. c Boxplots showing fold-changes (dIWS1/control) in RNA synthesis (TT-seq) in expressed genes (All, n = 10,147) and individual gene biotypes (protein coding, n = 9089; lncRNA, n = 615; snRNA, n = 25; snoRNA, n = 41; miRNA, n = 145) after 1 h depletion of IWS1. The thickened line represents the median and the hinges represent the first and third quartiles. The notches stretch to 1.58-times the interquartile range, divided by the square root of the sample size, approximating a 95% confidence interval. Whiskers extend to the maximum and minimum values within 1.5-times the interquartile range from the hinge, outliers are not shown. p-values were determined using one-sample two-sided Wilcoxon test (mu = 0), and shown as n.s = p > 0.05, *p < 0.05, **p < 0.01, ***p < 0.001, ****p < 0.0001. All: p < 2.2 × 10−16, protein-coding: p < 2.2 × 10−16, lncRNA: p < 2.2 × 10−16, snRNA: p = 0.2411, snoRNA: p = 0.007296, miRNA: p = 2.116 × 10−9. d MA plot of TT-seq data after 1 h depletion of IWS1 showing differential gene expression (n = 10,147). Significantly differentially expressed genes are shown in green and other genes are shown in gray. e Metagene analysis of mean TT-seq coverage in expressed genes (n = 10,147) in 1 h control- or dTAG7-treated (dIWS1) cells. The scaled metagene profiles are aligned at the transcript start (TSS) and transcript end site (TES). The y-axis represents the bootstrapped mean of log2-transformed normalized TT-seq coverage and the shaded areas around the mean indicate 95% confidence intervals of the mean. The gene region is shaded in gray. f As in e), but split into gene length quartiles: shortest (<10 kb, n = 2537), short (10–26.5 kb, n = 2537), long (26.5–65 kb, n = 2536), and longest (> 65 kb, n = 2537) genes.
Fig. 2
Fig. 2. Loss of IWS1 decreases Pol II elongation velocity.
a Boxplot showing fold-changes (dIWS1/control) in Pol II occupancy (mNET-seq) after 1 h depletion of IWS1. Representations as in Fig. 1c. p < 2.2 × 10−16. b Heatmap representation of changes in mNET-seq signal in expressed genes (n = 10,147) after depletion of IWS1. Gene regions are aligned at TSS. The black line represents ends of the genes and bins without signal are shown in gray. c As in (b), but for Pol II ChIP-seq signal. d Heatmap representation of changes in Pol II elongation velocity after 1 h depletion of IWS1. Representation as in (b). e Boxplots show mean TT-seq/mNET-seq ratios per gene (n = 10,147). p-values were determined using two-sample two-sided Wilcoxon test, and indicated as follows: n.s = p > 0.05, *p < 0.05, **p < 0.01, ***p < 0.001, ****p < 0.0001. Representation as in Fig. 1c. p < 2.2 × 10−16. f Boxplots of intron retention ratios (IR-ratio) per gene in TT-seq. Representation as in e. p < 2.2 × 10−16.
Fig. 3
Fig. 3. IWS1 stimulates Pol II elongation in vitro.
a Schematic representation of the nucleosome-positioning DNA template used for RNA extension assays. RNA primer is shown in red, the template and non-template DNA strands are shown in blue and cyan, respectively. b Denaturing PAGE analysis of RNA extension assays. Fluorescently labeled RNA primer was extended by the activated elongation complex ± IWS1 ± ELOF1. RNA lengths and the main extension products are indicated on the left and right side, respectively. c Quantification of the full-length transcripts from the RNA extension assay shown in b). Data represent mean ± SEM from four independent replicates. p-values were determined using one-way ANOVA followed by Tukey’s multiple comparisons test, and indicated as follows: n.s = p > 0.05, *p < 0.05, **p < 0.01, ***p < 0.001, ****p < 0.0001. Statistical significance was observed between three conditions (+/− IWS1 (p = 2.7 × 10−2), +/− both IWS1 and ELOF1 (p = 8.4 × 10−7) and +/− ELOF1 with IWS1 present (p = 4.1 × 10−5). No significance was observed between +/− ELOF1 alone (p = 0.5).
Fig. 4
Fig. 4. Architecture of the activated elongation complex with IWS1 and ELOF1.
a Schematic 2D overview of IWS1 (top). Colored regions represent residues of IWS1 that we resolved in cryo-EM reconstructions. IWS1 binding regions for Pol II, elongation factors (SPT5, SPT6 and ELOF1), and the non-template DNA (NT) strand are indicated in their respective colors. IWS1 regions corresponding to Interaction Sites 1-4 are numbered and the regions making up the Elongation Complex Scaffold (ECS) domain are indicated. The side and front views of the overall structure of the activated elongation complex with IWS1 and ELOF1 (bottom). Pol II is depicted in gray and the DNA and elongation factors are depicted in their respective colors. b Zoomed-in panel highlighting the interaction between IWS1 core and RPB1 clamp head and KOW2 domain of SPT5, respectively. c Top view of the Pol II cleft showing the C-terminal region of the ECS domain of IWS1. The ECS C-terminus binds to the RPB1 jaw, bridges between the RPB5 jaw and assembly domains, and extends to the RPB1 clamp. Pol II domains are shown in cartoon and transparent surface representations, colored according to the legend. The cryo-EM density for the ECS domain of IWS1 from MAP8 is shown. d Interaction Site 2: Residues 649–711 of the ECS domain of IWS1 makes a three-way contact between the NGN domain of SPT5 and the TND interaction motif (TIM) of SPT6. e Interaction Site 3: Residues 748–770 of the ECS domain of IWS1 interact with the non-template strand of the open transcription bubble (NT), bind the RPB2 lobe, and interact with zinc finger of ELOF1. f Interaction Site 4: Residues 786–819 of the ECS domain of IWS1 bind to the RPB1 jaw and cleft domains. Cryo-EM densities in (b, dh) are rendered as transparent surfaces and both densities and cartoons are colored as per legend.
Fig. 5
Fig. 5. ESC domain of IWS1 stimulates Pol II elongation to support H3K36me3.
a Schematic 2D overview of IWS1 truncation mutants analyzed in RNA extension assays (T1-4). b Denaturing PAGE analysis of RNA extension assays. Fluorescently labeled RNA primer was extended by the activated elongation complex with ELOF1 ± IWS1 mutants. Labels as in Fig. 3b.c Quantification of the full-length transcripts from the RNA extension assay shown in a). Data represent mean ± SEM from four independent replicates. p-values were determined using one-way ANOVA followed by Tukey’s multiple comparisons test, representation as in Fig. 3c. Statistical significance was observed between multiple conditions including +/− IWS1 WT (p = 6.2 × 10−7) and +/− IWS1 T4 (p = 3.5 × 10−3). No significance was observed between +/− T1, T2 or T3 (p = 0.9, p = 0.9, p = 0.9, respectively). d Dotplot depicts fold changes in levels of Pol II and its associated factors in the chromatin fraction after 1 h depletion of IWS1. Each dot represents a factor/subunit, where colors denote p-value, non-significant changes are shown in gray. The horizontal line represents mean log2 fold-change of each set. p-values were assessed using two-sided Student’s t-test. e Boxplots show H3K36me3 ChIP-seq counts of expressed genes (n = 10,147) in 1 h control- or dTAG7-treated (dIWS1) cells. Representation as in Fig. 2e. p-value = 1.518 × 10−12. f Heatmap representation of changes in H3K36me3 ChIP-seq signal of expressed genes (n = 10,147) aligned at the gene centers after 1 h depletion of IWS1. Representation as in Fig. 2b. g As in e), but after 1 h depletion of RTF1 (n = 12,976). p < 2.2 × 10−16. h As in (f), but after 1 h depletion of RTF1 (n = 12,976). i As in (e), but after 4 h depletion of SPT6 (n = 14,002). p < 2.2 × 10−16. j As in (f), but after 4 h depletion of SPT6 (n = 14,002).

Similar articles

References

    1. Roeder, R. G. & Rutter, W. J. Multiple forms of DNA-dependent RNA polymerase in eukaryotic organisms. Nature224, 234–237 (1969). - PubMed
    1. Sentenac, A. Eukaryotic RNA polymerases. CRC. Crit. Rev. Biochem18, 31–90 (1985). - PubMed
    1. Cramer, P. Eukaryotic transcription turns 50. Cell179, 808–812 (2019). - PubMed
    1. Miller, T. E. et al. Transcription elongation factors represent in vivo cancer dependencies in glioblastoma. Nature547, 355–359 (2017). - PMC - PubMed
    1. Adelman, K. et al. Immediate mediators of the inflammatory response are poised for gene activation through RNA polymerase II stalling. Proc. Natl. Acad. Sci. USA106, 18207–18212 (2009). - PMC - PubMed

MeSH terms

LinkOut - more resources