

Unsupervised clustering of biochemical markers reveals health profiles associated with function and survival in active aging
- PMID: 40835865
- PMCID: PMC12368133
- DOI: 10.1038/s41598-025-14580-1
Unsupervised clustering of biochemical markers reveals health profiles associated with function and survival in active aging
Abstract
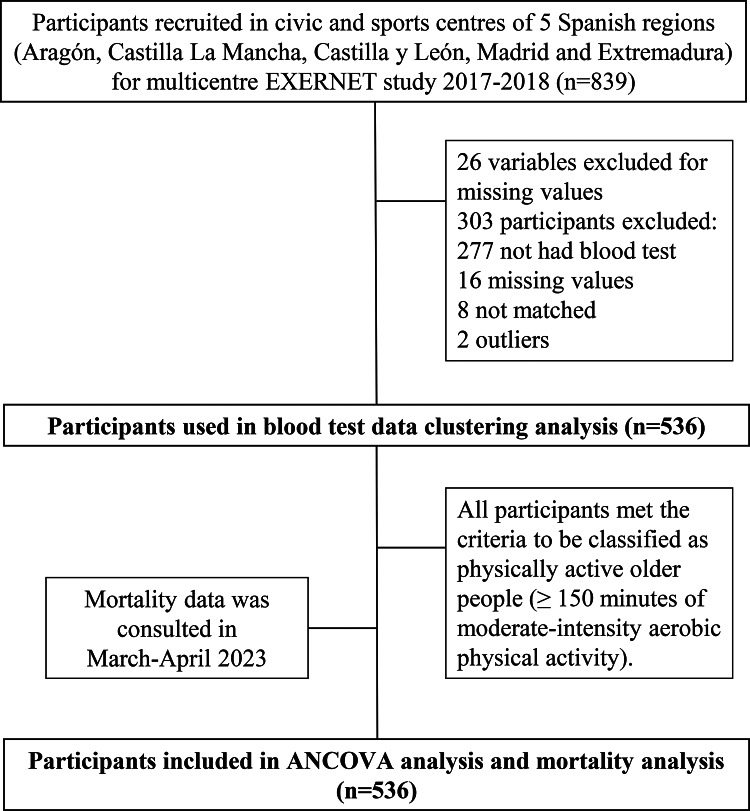
This study explores the relationships between biochemical phenotypes identified using machine learning, and key health outcomes, including body composition, physical function, and mortality risk. Data were collected from 536 physically active Spanish participants aged over 65 years (76.5% women) enrolled in the EXERNET cohort (2017-2018), with a 6-year mortality follow-up. Principal component analysis, and hierarchical and k-means clustering was used to identify distinct biochemical profiles. Associations between clusters and health outcomes were assessed using analysis of covariance and Cox proportional hazards models. Three distinct clusters emerged: 'Healthy', characterized by biochemical values within the normal range and used as the reference group; 'Metabolic', marked by dysregulated metabolic parameters; and 'Hepatic', which exhibited impaired liver function markers. Notably, all clusters showed subclinical levels of dysfunction. The 'Healthy Cluster' demonstrated the highest levels of organized physical activity (90%, p < 0.001), whereas the 'Metabolic Cluster' showed poorer body composition and reduced physical performance. Both the 'Metabolic' and 'Hepatic' clusters demonstrated a higher mortality risk, as confirmed through Cox regression analyses. Adjusted hazard ratios were significantly elevated when considering physical activity and adiposity, with values of 3.45 and 3.71 for the 'Metabolic Cluster', and 3.01 and 3.85 for the 'Hepatic Cluster' (p < 0.05). This study underscores the strong link between metabolic health, physical activity, body composition and 6-years mortality risk in older adults. Machine learning techniques for identifying phenotypic clusters offers a promising tool for early detection and targeted interventions to improve aging outcomes.
Keywords: Aging; Biochemical phenotypes; Body composition; Cluster analysis; Mortality risk; Physical function.
© 2025. The Author(s).
Conflict of interest statement
Declarations. Competing interests: The authors declare no competing interests.
Figures


References
-
- United Nations Department of Economic and Social Affairs. World Population Ageing 2019. (2019).
-
- Fernández-Ballesteros, R., Sánchez-Izquierdo, M. & Santacreu, M. Active Aging and Quality of Life. In Handbook of Active Ageing and Quality of Life: From Concepts to Applications (eds Rojo-Pérez, F. & Fernández-Mayoralas, G.) 15–42 (Springer International Publishing, 2021).
-
- Zemedikun, D. T., Gray, L. J., Khunti, K., Davies, M. J. & Dhalwani, N. N. Patterns of multimorbidity in middle-aged and older adults: An analysis of the UK biobank data. Mayo Clin. Proc.93(7), 857–866. 10.1016/j.mayocp.2018.02.012 (2018). - PubMed
MeSH terms
Substances
Grants and funding
- IND2022/BMD-23595/Comunidad de Madrid
- SBPLY/23/180225/000234/Regional Government of Castilla-La Mancha co-financed by the European Union.
- Red EXERNET DEP2005-00046/Ministerio de Educación y Ciencia
- RED2022-134800-T/Ministerio de Ciencia y Innovación
- 09/UPB/19, 45/UPB/20, 27/UPB/21, 29/UPB/22, 5/UPB/23 and EXP_99828/High Council of Sports
- 305483/European Union's Seventh Framework Programme (FP7/2007-2013)
- CB16/10/00477 and CB16/10/00456/Centro de Investigación Biomédica en Red Fragilidad y Envejecimiento Saludable
- 2022-GRIN-34296 and SBPLY/23/180225/000234/Plan Propio de Investigación of the University of Castilla-La Mancha and FEDER funds from the European Union
LinkOut - more resources
Full Text Sources
Medical
