. 2025 Oct;31(10):3414-3424.
doi: 10.1038/s41591-025-03901-6. Epub 2025 Aug 20.

AI-driven reclassification of multiple sclerosis progression

Affiliations

AI-driven reclassification of multiple sclerosis progression

Habib Ganjgahi et al. Nat Med. 2025 Oct.

Abstract

Multiple sclerosis (MS) affects 2.9 million people. Traditional classification of MS into distinct subtypes poorly reflects its pathobiology and has limited value for prognosticating disease evolution and treatment response, thereby hampering drug discovery. Here we report a data-driven classification of MS disease evolution by analyzing a large clinical trial database (approximately 8,000 patients, 118,000 patient visits and more than 35,000 magnetic resonance imaging scans) using probabilistic machine learning. Four dimensions define MS disease states: physical disability, brain damage, relapse and subclinical disease activity. Early/mild/evolving (EME) MS and advanced MS represent two poles of a disease severity spectrum. Patients with EME MS show limited clinical impairment and minor brain damage. Transitions to advanced MS occur via brain damage accumulation through inflammatory states, with or without accompanying symptoms. Advanced MS is characterized by moderate to high disability levels, radiological disease burden and risk of disease progression independent of relapses, with little probability of returning to earlier MS states. We validated these results in an independent clinical trial database and a real-world cohort, totaling more than 4,000 patients with MS. Our findings support viewing MS as a disease continuum. We propose a streamlined disease classification to offer a unifying understanding of the disease, improve patient management and enhance drug discovery efficiency and precision.


Conflict of interest statement

Competing interests: A.J.T. receives fees from being Co-Chair, UCL-Eisai Steering Committee drug discovery collaboration; Member, National Multiple Sclerosis Society (NMSS) Research Programs Advisory Committee; Clinical Trials Committee, Progressive MS Alliance; Board Member, European Charcot Foundation; Editor in Chief, Multiple Sclerosis journal; and Editorial Board Member, Lancet Neurology. He receives no fees from being Chair (Scientific Ambassadors), ‘Stop MS’ Appeal Board, UK MS Society; research & academic counsellor, Fundació Privada Cemcat; and Ambassador, European Brain Council. A.J.T. additionally holds a patent for the MSIS-29 Impact Scale. X.M. has received speaking honoraria and travel expenses for participation in scientific meetings and has been a steering committee member of clinical trials or has participated in advisory boards of clinical trials in the past years with AbbVie, Actelion, Alexion, Biogen, Bristol Myers Squibb/Celgene, EMD Serono, Genzyme, F. Hoffmann-La Roche, Immunic, Janssen Pharmaceuticals, MedDay Pharmaceuticals, Merck, Mylan, NervGen, Novartis, Sandoz, Sanofi-Genzyme, Teva, TG Therapeutics, EXCEMED, the MS International Federation and the NMSS. F.D.L. reports as sources of funding for research: Novartis, Actelion, Biogen, Sanofi, NMSS, National Institutes of Health and Brainstorm Cell Therapeutics; consulting agreements/advisory boards/data and safety monitoring board: Biogen, EMD Serono, Novartis, Teva, Actelion/Janssen, Sanofi/Genzyme, Acorda, Roche/ Genentech, MedImmune/Viela Bio, Receptos/Celgene/Bristol Myers Squibb, TG Therapeutics, MedDay Pharmaceuticals, Atara Biotherapeutics, Mapi Pharma, Apitope, Orion Biotechnology, Brainstorm Cell Therapeutics, Jazz Pharmaceuticals, GW Pharma, Mylan, Immunic, Population Council, Avotres, Neurogene, Banner Life Sciences, LabCorp, Entelexo Biotherapeutics and NeuraLight; stock options: Avotres and NeuraLight; and speaker: Sanofi (non-promotional). L.K.’s institution (University Hospital Basel) has received the following exclusively for research support: steering committee, advisory board and/or consultancy fees (Biogen, EMD Serono Research and Development, Genentech, Janssen, Novartis, Clene Nanomedicine, Bayer, Bristol Myers Squibb, Celltrion, Eli Lilly (Suisse) SA, EMD Serono Research and Development, Galapagos NV, Kiniksa Pharmaceuticals, Merck Healthcare AG, Minoryx and Santhera, Neurostatus UHB AG, Roche, Sanofi, Santhera Pharmaceuticals, Shionogi BV, Wellmera AG and Zai Lab); speaker fees (Bristol Myers Squibb, Janssen, Novartis, Roche and Sanofi); grants (European Union, Innosuisse, Merck Healthcare AG, Novartis and Roche); and testimony (Df-mp Mplina & Pohlman). D.L.A. reports consulting fees from Biogen, Biohaven, Bristol Myers Squibb, Eli Lilly, EMD Serono, Find Therapeutics, Frequency Therapeutics, GlaxoSmithKline, Idorsia Pharmaceuticals, Kiniksa Pharmaceuticals, Merck, Novartis, Race to Erase MS, Roche, Sanofi-Aventis, Shionogi and Xfacto Communications as well as an equity interest in NeuroRx. R.A.B. has served as a consultant for AstraZeneca, Biogen, EMD Serono, Genzyme, Genentech, Novartis and VielaBio. He also receives research support from Biogen, Genentech and Novartis. H.W. has received honoraria for being a member of scientific advisory boards for Biogen, Evgen, Genzyme, MedDay Pharmaceuticals, Merck Serono, Novartis, Roche Pharma AG and Sanofi-Aventis as well as speaker honoraria and travel support from Alexion, Biogen, Cognomed, F. Hoffmann-La Roche, Gemeinnützige Hertie-Stiftung, Merck Serono, Novartis, Roche Pharma AG, Genzyme, Teva and WebMD Global. H.W. is also acting as a paid consultant for AbbVie, Actelion, Biogen, IGES, Johnson & Johnson, Novartis, Roche, Sanofi-Aventis and the Swiss Multiple Sclerosis Society. His research is funded by the German Ministry for Education and Research (BMBF), the Deutsche Forschungsgemeinschaft (DFG), the Else Kröner Fresenius Foundation, the European Union, the Hertie Foundation, the NRW Ministry of Education and Research, the Interdisciplinary Center for Clinical Studies (IZKF) Muenster and RE Children’s Foundation, Biogen, GlaxoSmithKline, Roche Pharma AG and Sanofi-Genzyme. D.A.H., P.A., G.G., W.S., E.F., L.G. and B.C.K. are employees of Novartis. H.G., Y.S., S.G., T.E.N. and C.C.H. are current employees of the Big Data Institute, which received funding from Novartis to collaborate on AI in medicine, including the work presented here. C.B. and S.P.T. are employees of Roche. A.B. received speaker honoraria from Amicus Therapeutics and Biogen. T.E.N. received consulting fees from Perspectum Ltd.

Figures

Fig. 1
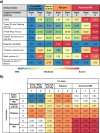
Fig. 1. Disease evolution of MS based on the transition probabilities among the eight states of MS as proposed by the FAHMM model for NO.MS (main result), the independent validation dataset (Roche MS) and the real-world cohort (MS PATHS).
a, Graphical summary of the eight statistical states of MS and the transition probabilities among them. b, Estimated loading matrices to identify ‘key dimensions of MS’. Bolded numbers refer to measures significantly (positively or negatively) associated with the dimensions based on the posterior probability of belonging to the slab component. Asymptomatic MS disease activity is identified based on the presence of Gd+ T1 lesions, in the absence of relapses. c, Descriptive summary of the percentage of patients with an MS subtype diagnosis (RRMS, SPMS or PPMS) and empirical means of the original variables characterizing the eight states; for more complete summary statistics, see Supplementary Table 2.1 and Extended Data Fig. 3. Note that, for MS PATHS, the diagnosis was self-reported by the patient and was missing for most (53%) and, therefore, not reported here. For a more detailed comparison of baseline features of the patients in NO.MS, Roche MS and MS PATHS datasets, see Supplementary Fig. 1.2 and Extended Data Table 2. d, Transition matrix between disease states as estimated by FAHMM, where each cell indicates the probability of a patient transitioning from their current state (row) to a subsequent state (column) over the course of 1 month. Patients may transition in any order between disease states. The thickness of the arrows in a is proportional to the probability of the transition between states as described in the transition probability matrix in d. In all figures, the color code refers to the clinical meta-states: blue indicates EME MS; yellow indicates asymptomatic MS disease activity; orange indicates relapse; and red indicates advanced MS. BPF, brain parenchymal fraction; Gd+, gadolinium-enhancing; s, seconds.
Fig. 2
Fig. 2. Disease progression and effect of treatments based on NO.MS.
a, Time to first 3-month PIRA as a function of the clinical state in which the patient started at trial baseline. Kaplan–Meier estimates with shaded area representing 95% confidence intervals. b, Sankey plot of individual patient trajectories among the four clinical states of MS over a timeframe of 5 years. At year 0, patients are shown in the disease state in which they entered into a clinical trial: patients were in an EME state (blue), in a state of asymptomatic radiological disease activity (yellow), in a relapse (orange) or in an advanced state of MS (red). From left to right, the plot illustrates the proportion of patients who remain in the same disease state or move to another disease state. Please note that, for clarity of the graphic, only the yearly status of the patients is shown, and transitions between yearly visits are not displayed to avoid overcrowding the figure. If patients had relapses or radiological inflammation at these annual visits, this is correctly presented in orange and yellow, respectively. However, patients may have experienced relapses or asymptomatic radiological inflammation states between these annual points that contributed to their worsening, which cannot appear in this graphical representation; this explains why the figure displays blue connection lines between EME and advanced disease states in the figure even though the probability of a direct transition between EME and advanced states without passing through the inflammatory states is, in fact, low (see underlying transition matrix in Fig. 1d). c, Effect of (any) DMTs (versus placebo) on the transition probabilities among the four clinical states of MS. ‘Any DMT’ includes one of the following: interferon beta-1, glatiramer acetate, teriflunomide, fingolimod, siponimod or ofatumumab, which were compared to ‘no DMT’ (that is, placebo). The numbers refer to the percentage risk reduction (1 − HR, where HR refers to the hazard ratio between treated and untreated (placebo) patients and is reported with 95% confidence limits).
Extended Data Fig. 1
Extended Data Fig. 1. Disease classification of multiple sclerosis.
Consensus definitions from 1996 and in its ‘2013 revisions’ and variants of it as used in indication statements in US packet inserts, summaries of product characteristics by the European Medicines Agency and in scientific publications. Relapsing forms of multiple MS include CIS, RRMS, and aSPMS in adults. aRRMS, active RRMS; aSPMS, active SPMS; CIS, clinically isolated syndrome; haRRMS, highly active RRMS; IPPMS, late PPMS (as opposed to ‘early PPMS’); MS, multiple sclerosis; naSPMS, non-active SPMS (as opposed to ‘active SPMS’); PMS progressive MS (SPMS + PPMS); PPMS, primary progressive MS; PRMS, progressive relapsing MS; RRMS relapsing remitting MS; SPMS, secondary progressive MS; «progression in MS » refers to the process of progression, which occurs in all subtypes of MS.
Extended Data Fig. 2
Extended Data Fig. 2. Selecting the number of states.
BIC, Bayesian Information Criterion. A local minimum would indicate the optimal number of states. However, no single best number of states was identified. Models with more and more states with overlapping disease features (as illustrated in Extended Data Fig. 3) – representing a gradient in disease severity features – were found to be a better representation of the data than simpler models.
Extended Data Fig. 3
Extended Data Fig. 3. Graphical illustration of disease states and MS as a gradient.
The states represent a gradient of disease severity based on physical disability and brain damage with distinct inflammatory states without accompanying symptoms (state 4) or with such symptoms, that is relapse (state 5). a, Density plots in the eight-state model: Latent factor distribution in the eight states. Overlapping distributions form a gradient of disease severity based on physical disability and brain damage. Distinct inflammatory states for the clinical relapse (state 5), and for asymptomatic lesions (state 4) b, Endpoint distribution of the original clinical and radiological variables in the eight states. EDSS, Expanded Disability Status Scale; Gd, gadolinium-enhancing; MS, multiple sclerosis; PASAT, Paced Auditory Serial Addition Test.
Extended Data Fig. 4
Extended Data Fig. 4. Alternative models with nine or ten states.
a, b, model with nine states. c, d, model with 10 states. Composite score of MS dimensions and empirical means of the original variables characterising the states (a and c). Transition probability matrix from FAHMM (b and d). The transition probabilities refer to the probability of changing from one disease state to another one within a period of 1 month; the colour code refers to the clinical disease states as described in Fig. 1. Asympt., asymptomatic; EDSS, Expanded Disability Status Scale; Gd + , gadolinium-enhancing; PASAT, Paced Auditory Serial Addition Test.
Extended Data Fig. 5
Extended Data Fig. 5. Eight-state modelling by MS subtypes.
Clinical states (a) and transition matrices between states (b) for bout-onset MS (RRMS, SPMS) and PPMS separately. The disease severity gradient from EME to advanced states of MS, as well as the relapse and asymptomatic disease activity states, were re-discovered for PPMS, and similar to those observed for bout-onset MS. As a minor difference, only one EME state and several advanced states were discovered when fitting the model only to PPMS patients. This is expected, as studies in PPMS systematically excluded patients with an EDSS < 3.5. Overall, disease states and transition patterns were similar between RRMS-SPMS and PPMS patients.
Extended Data Fig. 6
Extended Data Fig. 6. Eight-state modelling with no imputation of missing data.
Analysis based on non-missing data, that is analysis without data imputation performed by mapping data to annual visits (based on the availability of annual MRI scans): (a) clinical states and (b) transition matrix between states. The frequency of subclinical disease activity is underestimated in this model due to the remapping of relapses from other timepoints were they occurred to the annual visits where MRI scans are available. Overall, the disease states and transition patterns observed were similar to those in the main model.

References

    1. MS International Federation. Atlas of MS. https://www.atlasofms.org
    1. Walton, C. et al. Rising prevalence of multiple sclerosis worldwide: insights from the Atlas of MS, third edition. Mult. Scler.26, 1816–1821 (2020). - PMC - PubMed
    1. Lublin, F. D. & Reingold, S. C. Defining the clinical course of multiple sclerosis: results of an international survey. Neurology46, 907–911 (1996). - PubMed
    1. Lublin, F. D. et al. Defining the clinical course of multiple sclerosis: the 2013 revisions. Neurology83, 278–286 (2014). - PMC - PubMed
    1. Rotstein, D. & Montalban, X. Reaching an evidence-based prognosis for personalized treatment of multiple sclerosis. Nat. Rev. Neurol.15, 287–300 (2019). - PubMed

LinkOut - more resources