. 2025 Oct;31(10):3350-3359.
doi: 10.1038/s41591-025-03887-1. Epub 2025 Aug 20.

Genetic and molecular landscape of comorbidities in people living with HIV

Affiliations

Genetic and molecular landscape of comorbidities in people living with HIV

Javier Botey-Bataller et al. Nat Med. 2025 Oct.

Abstract

People living with HIV (PLHIV) have an increased susceptibility to non-AIDS comorbidities. In this study, we systematically profiled 1,342 PLHIV across five omics layers and immune function. We found latent factors, resulting from integrating epigenomics, transcriptomics, proteomics, metabolomics and immune responses, linked to cardiovascular diseases, the presence of carotid plaque and chronic obstructive pulmonary disease in PLHIV. Mapping four omics layers to genetic variation identified 5,962 molecular quantitative trait loci, illustrating a common genetic regulation in PLHIV compared to healthy individuals. By performing Mendelian randomization, we uncovered host genetic-driven changes in baseline molecules causally related to immune responses upon stimulation with inactivated pathogens. Lastly, we uncovered that the inflammasome, genetically regulated by the NLRP12 locus, contributes to systemic inflammation across multiple molecular layers. This study offers a unique catalog of genetic and molecular determinants of immune function in PLHIV and elucidates molecular pathways driving inter-individual variation in immune response and comorbidities.


Conflict of interest statement

Competing interests: The authors declare no competing interests.

Figures

Fig. 1
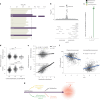
Fig. 1. Integrative omics in PLHIV.
a, Overview of the data available for the cohort. Multi-omics data, together with immune response profiling, were collected. Clinical data on non-AIDS comorbidities were available. b, Multi-omics integration. Features across all layers were integrated using MOFA. This captured LFs related to processes such as systemic inflammation and aging. c, Multi-omics QTL to dissect the genetic basis of inter-individual variation in PLHIV. d, Mendelian randomization to study the causal effect of circulating molecules on immune function in PLHIV. Schematics were created with BioRender.com. LF, latent factor.
Fig. 2
Fig. 2. Multi-omic LFs underlying clinical variables in PLHIV.
a, Left, variance explained by each of the 21 LFs, in percentage. Colored bar plot indicates the proportion of the percentage of variance explained in each of the data modalities. Heatmap indicates the correlation between each of the LFs and IL-1β expression in cytokine production upon stimulation, plasma protein concentration and gene expression. Only significant correlations after FDR correction are colored. Right, dot plot, association of LFs with covariates and clinical variables. Wilcoxon rank-sum test was used for binary variables, Kruskal–Wallis for categorical variables and Pearson’s correlation for continuous variables. Color indicates the direction of the association times its significance (−log10 FDR), and size indicates the significance of the association. *FDR < 0.05, **FDR < 0.01, ***FDR < 0.001. b, Effect estimates, derived by linear modeling, of increased LF8 values and different clinical variables, including cardiovascular, endocrine, gastrointestinal and respiratory endpoints. Error bars correspond to the limits of the 95% conficence interval. c,e,h, Association of the multi-omic factor values with clinical parameters. P values: 2.54 × 10−6 (c), 2.96 × 10−4 (e) and 1.69 × 10−5 (h). f, Association of two LF8-related metabolites, indoxyl sulphate (IS) (P = 0.003) and DHEA-S (P = 0.044), and myocardial infarction. d,g,i, Enrichment in features with positive and negative weights for each factor. x axis indicates the direction of enrichment (MOFA pathway enrichment). c,e,f,h, Two-sided Wilcoxon rank-sum test, *P < 0.05, **P < 0.01, ***P < 0.001. ndiscovery = 1,075, nvalidation = 267. Box plots show the median (center), first and third quartiles (bounds) and 1.5 times the interquantile range (whiskers). cos, cosine; cyt, cytokine; gex, gene expression; IBD, inflammatory bowel disease; INR, immunological non-responder; PAV, peripheral arterial vascular disease; prot, proteomics; RP, rapid progressor; sin, sine; VTE, venous thromboembolism.
Fig. 3
Fig. 3. Multi-omics genetic regulation of PLHIV.
a, Number of loci identified per molecular layer. b,d,f,h, SWs QTL; only significant associations are shown. SWs is defined by correcting the GWs threshold (P < 5 × 10−8) by the number of effective tests (Methods). b, eQTL. d, pQTL. f, mQTL. h, cQTL. c,e,g, Comparison of effects between QTL in PLHIV and healthy individuals. Gray shaded area indicates the 95% confidence interval. c, Compared to eQTL in whole blood in GTEx. d, Compared to pQTL in plasma in the UK Biobank. e, Compared to metabolite QTL in the 500 Functional Genomics Project (500FG). i, LocusZoom plot of the CCL2–CCL3 hotspot, two contiguous loci harboring regulation of immune responses, plasma proteins and gene expression. Dotted line indicates the GWs threshold (P < 5 × 10−8). 7d, 7 days; calbhy, C. albicans (hyphae); cmv, cytomegalovirus; ecoli, E. coli; HIVenv, HIV viral envelope; il1a, IL-1A; imq, imiquimod; lps, lipopolysaccharide; mtb, Mycobacterium tuberculosis; pha, polyhydroxyalkanoate; polyic, poly I:C; saureus, S. aureus; spneu, S. pneumoniae.
Fig. 4
Fig. 4. The causal link between circulating markers and the immune response of PLHIV.
a,c, Top genes (a) and proteins (c) with the most significant Mendelian randomization (MR) links to cytokine responses. Significance was estimated by IVW MR with sensitivity checks (Methods). Color indicates the effect calculated by IVW MR. *P < 0.05, **P < 0.01, ***P < 0.001. b,d,e, Examples of regulators of immune response in PLHIV. All effects and P values were calculated by IVW MR. Only significant effects (P < 0.05 and sensitivity checks passed) are shown. b, All cytokine responses regulated by LINC00173. d, Responses to the HIV envelope regulated by IL-17D. e, All the regulators of CCL3 responses to the HIV envelope. Schematics were created with BioRender.com.
Fig. 5
Fig. 5. The NLRP12 locus and the multi-omics landscape of the inflammasome in PLHIV.
a, Top association between LFs and genome-wide variants by QTL mapping. b, LocusZoom plot of the association between the NLRP12 locus and LF6. c, Number of GWs (P < 5 × 10−8) associations replicated in the validation cohort (P < 0.05) between the missense variant rs34436714 and different omics layers. d, Association between rs34436714 and an inflammasome score computed at gene expression and protein levels. Discovery cohort, n = 1,075. Two-sided pairwise Wilcoxon rank-sum test, *P < 0.05, **P < 0.01, ***P < 0.01. Box plots show the median (center), first and third quartiles (bounds) and 1.5 times the interquantile range (whiskers). e, Correlation between AMP and taurine abundance and the inflammasome score computed at gene expression and protein levels. Pearson’s correlation. f, Correlation between LF6 and two monocyte proportions. Pearson’s correlation. The gray shaded area indicates the 95% confidence interval. g, Schematic of the hypothesized mechanism. Schematics were created with BioRender.com.
Extended Data Fig. 1
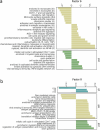
Extended Data Fig. 1. Enrichment profiles.
a, Enrichment profile for latent factor 6. b, Enrichment profile of latent factor 8.
Extended Data Fig. 2
Enrichment profile for latent factor 11.
Extended Data Fig. 3
Extended Data Fig. 3. Overview of latent factor 20.
a, Association of latent factor 20 with rapid progression. b,c, Features with significant weights in gene expression, examined in gene expression and protein abundances. Wilcoxon rank-sum test *P < 0.05 **P < 0.01 ***P < 0.001 ****P < 0.0001. d, Enrichment profile for latent factor 20.
Extended Data Fig. 4
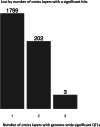
Extended Data Fig. 4. Genetic loci by number of layers in which at least one genome-wide significant hit was found.
Results show per locus the SNP with the highest number of molecular layers with a significant QTL.
Extended Data Fig. 5
Extended Data Fig. 5. Comparison of effects between cis eQTL in PLHIV and healthy individuals from eQTLgen.
Top SNPs for each genome-wide significant locus were tested in the eQTLgen consortium.
Extended Data Fig. 6
Extended Data Fig. 6. Inflammasome scores in gene expression in PBMCs and protein abundance in Plasma.
a, Spearman correlation for scores between gene expression and protein abundance. Calculated based on four different gene sets: Gene Ontology (GO) biological processes (BP), GO cellular component (CC) and Reactome. b, Association of rs34436714 with the four different gene sets.
Extended Data Fig. 7
Extended Data Fig. 7. Correlation between the inflammasome score in gene expression in PBMCs and protein abundance in plasma and plasma metabolite abundances of AMP and Taurine.
Spearman correlation.
Extended Data Fig. 8
Extended Data Fig. 8. Multi-omics IL-1β scores.
a, Distribution of IL-1β scores across three data layers. b–e, Spearman correlation of the IL-1β scores between each pair of data layers.
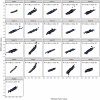
Extended Data Fig. 9
Spearman correlation between factor values computed by MOFA and the values interpolated by multiplying the significant feature weights by the feature values.

References

    1. Fauci, A. S. & Folkers, G. K. Toward an AIDS-free generation. JAMA308, 343–344 (2012). - PubMed
    1. Deeks, S. G., Lewin, S. R. & Havlir, D. V. The end of AIDS: HIV infection as a chronic disease. Lancet382, 1525–1533 (2013). - PMC - PubMed
    1. Webel, A. R., Schexnayder, J., Cioe, P. A. & Zuñiga, J. A. A review of chronic comorbidities in adults living with HIV: state of the science. J. Assoc. Nurses AIDS Care32, 322–346 (2021). - PMC - PubMed
    1. Babu, H. et al. Systemic inflammation and the increased risk of inflamm-aging and age-associated diseases in people living with HIV on long term suppressive antiretroviral therapy. Front. Immunol.10, 1965 (2019). - PMC - PubMed
    1. Van Der Heijden, W. A. et al. Chronic HIV infection induces transcriptional and functional reprogramming of innate immune cells. JCI Insight6, e145928 (2021). - PMC - PubMed

MeSH terms

LinkOut - more resources