. 2025 Aug 20;15(1):30639.
doi: 10.1038/s41598-025-13877-5.

Parameter analysis using swallowing sounds shows differences in bolus volume, bolus viscosity, sex, and age

Affiliations

Parameter analysis using swallowing sounds shows differences in bolus volume, bolus viscosity, sex, and age

Yuka Konoike et al. Sci Rep. .

Abstract

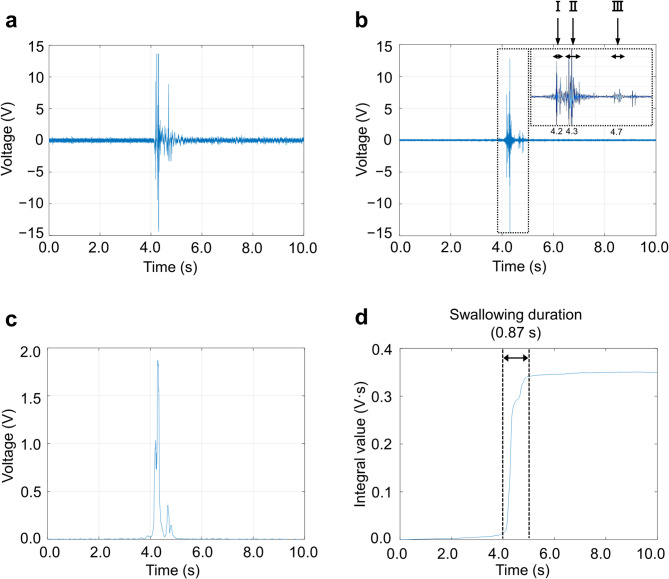
Acoustic analysis of pharyngeal sounds during swallowing may capture physiological functions, providing a noninvasive method for early screening of swallowing decline. In this study, we examined changes in swallowing function across variations in bolus volume, bolus viscosity, sex, and age using parameters such as swallowing duration, average voltage, and swallowing power derived from swallowing sounds. The results showed that average voltage and swallowing power were significantly higher in men, both in younger (aged 20-25 years) and older (aged 50-65 years) groups, regardless of bolus volume and viscosity. These parameters generally decreased as bolus viscosity increased, with significant differences observed in all participants except older men. Regarding swallowing duration, older men took significantly longer to swallow a high-viscosity bolus compared to younger men, whereas no age-related differences were observed in women. This finding suggests that men experience greater age-related deterioration in swallowing than women. Overall, this simple and noninvasive measurement method appears to be an effective and objective tool for evaluating swallowing function. It is capable of detecting alterations associated with sex and aging, as well as changes in swallowing status related to the physical properties of dysphagia diets.

Keywords: Acoustic analysis; Cervical auscultation; Deglutition; Deglutition disorders; Measurement; Swallowing sounds.


Conflict of interest statement

Competing interests: The authors declare no competing interests. Ethical approval: This study was performed on human participants under the approval of the Ethics Committee of Okayama Prefectural University (approval number: 23–43). Informed consent: Informed consent was obtained from all individual participants included in the study.

Figures

Fig. 1
Fig. 1
Signal measured by the microphone during swallowing sound collection.
Fig. 2
Fig. 2
A typical signal waveform of swallowing sound and parameter transformation trace. The original signal (a) from the microphone contained noise and was processed with a digital filter to obtain a cleaner signal (b). The waveform within the dashed line in (b) is enlarged in the inset, showing that the swallowing sound consists of three components: I, II, and III. Since signal (b) corresponds to sound pressure in voltage, it was transformed by taking the absolute value to obtain signal (c). From signal (c), the swallowing power (d), calculated as the time integral of the voltage, was derived. Furthermore, signal (d) was differentiated and smoothed using a moving average, and the numerical gradient was calculated from differences, allowing for the determination of the swallowing start and end times.
Fig. 3
Fig. 3
Changes in swallowing sound parameters in the younger group (aged 20–25 years). Effect of bolus volume on swallowing sound parameters (a), and comparison of swallowing sound parameters between men and women (b). Swallowing duration (s), average voltage (V), and swallowing power (V·s) were analyzed for each bolus volume (3, 5, 10, and 15 mL of water) were analyzed as described in the Methods. The plots represent the median (horizontal line) ± interquartile range (IQR) from eight participants (men or women), each with three measurements (n = 24). The Bonferroni or Dunnett test was used. M: men, W: women.
Fig. 4
Fig. 4
Effect of bolus viscosity on swallowing sound parameters in the younger (aged 20–25 years) and older (aged 50–65 years) groups, separated by sex. Given the observed sex differences in the bolus volume experiment (Fig. 3), the analysis was stratified by age group and sex to clarify the differential effects of viscosity on swallowing physiology. In both younger and older groups, women showed greater changes in average voltage and swallowing power in response to variations in bolus viscosity compared to men, suggesting sex-related differences in physiological responses. Swallowing duration (s), average voltage (V), and swallowing power (V·s) were analyzed in the younger (a) and older (b) groups by sex. Boluses with 0.0%, 1.0%, and 3.5% concentrations of the thickening agent TROMELIN V were swallowed, with viscosities as shown in Table 2. Data are from thirty-two participants, eight per group by age and sex. The plots represent the median (horizontal line) ± IQR from three measurements (n = 24). 0.0%: water, 1.0%: IDDSI Level 2 Mildly Thick, 3.5%: IDDSI Level 3 Moderately thick.
Fig. 5
Fig. 5
Comparison of swallowing sound parameters between the younger (aged 20–25 years) and older (aged 50–65 years) groups at each bolus viscosity, separated by sex. Given the observed sex differences in the bolus volume experiment (Fig. 3), we present the differential effects of viscosity on swallowing physiology stratified by age group and sex. It is indicated that the effect of aging on swallowing function differs between men and women. Average swallowing duration (s), average voltage (V), and swallowing power (V·s) were analyzed at each bolus viscosity (0.0%, 1.0%, and 3.5% concentrations of the thickening agent TROMELIN V), with corresponding viscosities shown in Table 2. Data are from thirty-two participants, eight per group by age and sex. Data are presented as the mean ± SD from three measurements (n = 24). 0.0%: water, 1.0%: IDDSI Level 2 Mildly Thick, 3.5%: IDDSI Level 3 Moderately thick.
Fig. 6
Fig. 6
Comparison of swallowing sound parameters between men and women at each bolus viscosity. Swallowing duration (s), average voltage (V), and swallowing power (V·s) were analyzed in the younger (aged 20–25 years) (a) and older (aged 50–65 years) (b) groups. Boluses with 0.0%, 1.0%, and 3.5% concentrations of the thickening agent TROMELIN V were swallowed, with viscosities as shown in Table 2. Data are from thirty-two participants, eight per group by age and sex. The plots represent the median (horizontal line) ± IQR from three measurements (n = 24). M: men, W: women. 0.0%: water, 1.0%: IDDSI Level 2 Mildly Thick, 3.5%: IDDSI Level 3 Moderately thick.

Similar articles

References

    1. Wirth, R. et al. Oropharyngeal dysphagia in older persons - from pathophysiology to adequate intervention: a review and summary of an international expert meeting. Clin. Interv Aging. 11, 189–208 (2016). - PMC - PubMed
    1. Baijens, L. W. et al. European society for swallowing disorders - european union geriatric medicine society white paper: oropharyngeal dysphagia as a geriatric syndrome. Clin. Interv Aging. 11, 1403–1428 (2016). - PMC - PubMed
    1. Hwang, S. H. et al. Topical anesthetic preparations for rigid and flexible endoscopy: a meta-analysis. Eur. Arch. Otorhinolaryngol.272, 263–270 (2015). - PubMed
    1. Oguchi, K. et al. The repetitive saliva swallowing test (rsst) as a screening test of functional dysphagia (2) validity of Rsst. Japanese J. Rehabil Med.37, 383–388 (2000).
    1. Tohara, H. et al. Three tests for predicting aspiration without videofluorography. Dysphagia18, 126–134 (2003). - PubMed

LinkOut - more resources