. 2025 Oct;646(8085):667-675.
doi: 10.1038/s41586-025-09376-2. Epub 2025 Aug 20.

Network synchrony creates neural filters promoting quiescence in Drosophila

Affiliations

Network synchrony creates neural filters promoting quiescence in Drosophila

Davide Raccuglia et al. Nature. 2025 Oct.

Abstract

Animals require undisturbed periods of rest during which they undergo recuperative processes1. However, it is unclear how brain states arise that are able to dissociate an animal from its external world, enabling quiescent behaviours, while retaining vigilance to salient sensory cues2. Here we describe a neural mechanism in Drosophila that creates neural filters that engender a brain state that enables quiescent behaviour by generating coherent slow-wave activity (SWA)3 between sleep-need4 (R5)- and locomotion-promoting neural networks5. The coherence of SWA is subject to circadian and homeostatic control and can be modulated by sensory experience. Mimicry of coherent SWA reveals that R5 oscillations reduce responsiveness to visual stimuli by rhythmically associating neural activity of locomotion-promoting cells, effectively overruling their output. These networks can regulate behavioural responsiveness by providing antagonistic inputs to downstream head-direction cells6,7. Thus, coherent oscillations provide the mechanistic basis for a neural filter by temporally associating opposing signals, resulting in reduced functional connectivity between locomotion-gating and navigational networks. We propose that the temporal pattern of SWA provides the structure to create a 'breakable' filter, permitting the animal to enter a quiescent state, while providing the architecture for strong or salient stimuli to 'break' the neural interaction, consequently allowing the animal to react.


Conflict of interest statement

Competing interests: The authors declare no competing interests.

Figures

Fig. 1
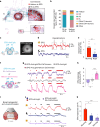
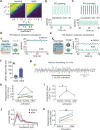
Fig. 1. Across-network SWA in the central complex.
a, Top, schematic of circuitry composed of dorsal fan-shaped body (dFSB, dark grey), helicon cells (light grey) and R5 neurons (blue). dFSB and R5 neurons are highlighted to indicate expression of genetically encoded voltage indicators. Rectangles indicate recording sites. Bottom, in vivo wide-field images of dFSB and R5 expressing the voltage indicators Varnam (R23E10-LexA) and ArcLight (R58H05-Gal4), respectively. Scale bars, 20 μm. b, Example in vivo recordings of R5 and dFSB electrical activity in the morning (top (gold ‘sun’ symbol); ZT 2–6) and at night (bottom (black ‘crescent moon’); ZT 14–18). c, Cross-correlogram indicating increased coherence of R5 and dFSB electrical patterns at night (n = 9 flies for morning, n = 10 flies for night; two-sided Mann–Whitney test). c(t) refers to the degree of correlation (–1 to 1) at a given time lag t; c(0) refers to the degree of synchrony (correlation at time lag 0). Data are mean ± s.e.m. *P < 0.05, **P < 0.01, ***P < 0.001; NS, not significant. Source Data
Fig. 2
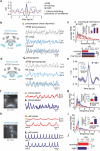
Fig. 2. SWA-like activity controls quiescence.
a, Locomotor activity of a single fly is assessed in a circular arena. b, Fly locomotor activity correlates with the internal sleep drive. Example trajectories (5 min) of a rested and a sleep-deprived fly (+/LexAop-CsChrimson). c, Baseline velocity of sleep-deprived flies compared with rested flies (+/LexAop-CsChrimson) (n = 43 for rested and n = 55 for sleep-deprived; Mann–Whitney test). Sleep-deprived flies either meet the sleep criteria (5 min of inactivity, ‘sleeping’, n = 31) or are active (‘awake’, n = 24). Mann–Whitney test. d, Schematic of optogenetic protocol used to mimic SWA in R5 neurons. After 5 min of baseline activity (pre), rested flies were exposed to 5 min red light pulses at 1 Hz (ON) and allowed to recover for 10 min (post and post 2). e, Average locomotion traces of R58H05-Gal4>UAS-CsChrimson flies (+retinal, n = 15). Activating R5 at 1 Hz reduced locomotion during and after the stimulation protocol. Curves show mean ± s.e.m. f, Stimulation at 1 Hz reduced distance travelled during and after activation of R5 (n = 15). Friedman test with Dunn’s multiple comparisons, **P = 0.003, *P = 0.032. g, Example trajectories of R58H05-Gal4>UAS-CsChrimson (green) and control (grey) flies. h, Raster plots of three example flies before, during and after R5 activation at 1 Hz. Colours indicate three designated behaviours: walking, grooming and resting (flies are immobile). Also see Supplementary Video 1. i, R5 stimulation frequency affects the distance travelled (n = 15 for 1 Hz and n = 10 for 0.1 Hz; Mann–Whitney test). j, Exposure to a 10-s air puff during R5 activation at 1 Hz increased the mean velocity of rested R58H05-Gal4>UAS-CsChrimson flies (+retinal, n = 8; Wilcoxon matched pairs signed-rank test, *P = 0.039). Box plots show the median (line), interquartile range (box, quartile 1 to quartile 3) and the minimum-to-maximum range (whiskers). All statistical tests were two-sided. n refers to the number of individual flies. Source Data
Fig. 3
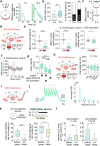
Fig. 3. R5 and helicon synchronize electrical patterns at night.
a, Circuit between R5 (body-ID:1200049187), helicon (body-ID:918334668) and dFSB neurons (FB6A, body-ID:422191200). Red arrow indicates connections from helicon to R5, black arrow from dFSB to helicon. b, In vivo image of presynaptic structures expressing green ArcLight in R5 (R58H05-Gal4) and red Varnam in helicon (R24B11-LexA). Scale bar, 20 μm. c, Example in vivo recordings of R5 and helicon presynaptic electrical patterns for morning (ZT 2–4) and night (ZT 14–16). Night recordings show a synchronized and a shifted state (see Extended Data Fig. 5b). d, Cross-correlogram between helicon and R5 electrical patterns of a state with zero time lag and a shifted state, where helicon precedes R5 activity by 50–200 ms (n = 19 for morning, n = 10 sync, n = 12 for night-shifted; two-sided Kruskal–Wallis test with post hoc Dunn’s comparison). e, During a light–dark regimen (LD), correlation between helicon and R5 is significantly increased at night (ZT 14–16) and after sleep deprivation (SD) in the morning (ZT 2–4) but not during midday (ZT 5–7) (n = 19 morning, n = 22 night, n = 9 midday, n = 11 morning sleep-deprived; two-sided Mann–Whitney test for two groups, otherwise two-sided Kruskal–Wallis test with post hoc Dunn’s comparison, **P = 0.003). After 24 h of darkness (DD), correlation between helicon and R5 is increased during the subjective night (circadian time (CT) 14–16) compared with the subjective morning (CT 2–4) (n = 12; two-sided Mann–Whitney test). Nocturnal increase in network coherence is abolished in per mutants (n = 15 morning and n = 12 night; two-sided Mann–Whitney test). f, Average power spectral densities (PSDs) of synchronized SWA in helicon and R5 demonstrate that slow-wave power is increased at night in both networks (n = 14 morning, n = 10 night; two-sided Mann–Whitney test). g,h, Example ex vivo recordings of R5 and helicon presynaptic electrical patterns recorded in the morning (ZT 2–4) and at night (ZT 14–16) (n = 9 morning, n = 11 night); two-sided Mann–Whitney test. Data in df,h are mean ± s.e.m. n refers to the number of independent flies. Source Data
Fig. 4
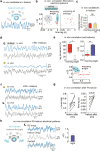
Fig. 4. Coherence between R5 and helicon selects quiescence.
a, Schematic of simulated R5 and helicon (Hel) interactions for morning and night. Helicon is excitatory, whereas R5 is mixed inhibitory and excitatory. During morning, R5 is spiking and helicon is depolarized (upstate). During night, R5 is bursting and dFSB hyperpolarizes helicon (downstate) (Extended Data Fig. 7 and Supplementary information). b, PSDs (in dB) of simulated R5 and helicon networks for morning (R5 uncorrelated to helicon) and night (R5 synchronized to helicon, oscillating at approximately 1 Hz). n = 10 simulations. c, Simulated correlation coefficients (n = 10) of compound R5 and helicon activity for morning and night. Graph shows mean ± s.d. d, Schematic of 1 Hz stimulation of R5 and/or helicon in the morning configuration. e, Average PSDs of R5 and helicon during the stimulation. R5 stimulation led to R5 synchronization with no direct effect on helicon. Helicon stimulation led to a slight synchronization of helicon with the 1 Hz rhythm with almost no effect on R5 (logarithmic scale). Simultaneous stimulation of R5 and helicon led to strong R5 and helicon synchronization (n = 10 each). f, Schematic of experimental setup for g. g, Average locomotion traces of CsChrimson control (+retinal, n = 33), R58H05-LexA>LexAop-CsChrimson (R5; +retinal, n = 21), R24B11-LexA>LexAop-CsChrimson (helicon, +retinal, n = 47) and R58H05-LexA;R24B11-LexA>LexAop-CsChrimson flies (R5+helicon; +retinal, n = 17). Curves show mean ± s.e.m. h, Behavioural responsiveness (ZT 1–7, 12–19 h of sleep deprivation) to green light during optogenetic activation (n = 33 for CsChrimson control, n = 21 for R5 activation, n = 47 for helicon activation and n = 17 for R5 plus helicon activation; coloured asterisks indicate significance compared with baseline locomotion; Wilcoxon signed-ranked test). R5 activation alone and R5 plus helicon activation resulted in reduced behavioural responsiveness. Kruskal–Wallis test, post hoc Dunn’s multiple comparisons (*P = 0.011 for control versus R5 plus helicon, *P = 0.026 for control versus R5). Box plots show the median (line), interquartile range (box, quartile 1 to quartile 3) and the minimum-to-maximum range (whiskers). All statistical tests were two-sided. In g,h, n refers to the number of independent flies. Source Data
Fig. 5
Fig. 5. R5 and helicon provide antagonistic input to EPG.
a, Top, helicon, R5 and EPG are interconnected at the level of the ring. Morphological renderings of R5, helicon and EPG. Dots depict synaptic connections. Bottom, location of R5 and helicon synapses projecting to a single EPG neuron (body-ID:387364605). b, At the level of EPG, synaptic input connections from R5 (R5-to-EPG) are found in proximity to input connections from helicon (helicon-to-EPG) and vice versa. Bar plots show fraction of closest synaptic connections for R5-to-EPG and helicon-to-EPG per neuron type. R, ring neurons; ExR, helicon cells (extrinsic ring neurons). c, Schematic and wide-field image of EPG neurons expressing the voltage indicator ArcLight (R60D05-Gal4). Scale bar, 20 μm. d, Example ex vivo compound recordings of EPG electrical patterns recorded in morning (ZT 2–4) and night (ZT 14–16). Squares indicate spontaneous depolarizations. e, Incidence of depolarization events is reduced at night (n = 12; two-sided Mann–Whitney test, **P = 0.004). Spontaneous activity in vivo was higher (Extended Data Fig. 10f–h). f, EPG recording site (R60D05-Gal4) during optogenetic activation of R5 (R58H05-LexA) and helicon (R24B11-LexA). g, Example recordings showing that activation of R5 leads to net hyperpolarization of the EPG network and that helicon depolarize EPG. To suppress spontaneous activity during helicon activation, we used an external solution with high Mg2+ concentration. h, EPG response amplitudes during optogenetic activation (n = 25 events for EPG>ArcLight, n = 30 events for R5>CsChrimson, n = 27 events for helicon>CsChrimson; events were examined over at least 5 independent flies per group; two-sided Kruskal–Wallis test, post hoc Dunn’s multiple comparisons, **P = 0.004). ik, Light-evoked EPG responses are reduced during the night compared with the day. Optogenetic stimulation of R5 during the day mimics the night configuration (trajectories show example recordings; n = 8, EPG response amplitudes were averaged across stimulations for each fly; two-sided Kruskal–Wallis with post hoc Dunn’s multiple comparisons, *P = 0.018). Graphs in e,h,k show mean ± s.e.m. n refers to the number of independent flies unless stated otherwise. Source Data
Extended Data Fig. 1
Extended Data Fig. 1. R5 and dFSB SWA.
(a) Autocorrelogram of an in vivo example of electrical dFSB activity. In the night recording, the interval between peaks indicates the periodicity of SWA. These peaks are less pronounced in the morning, indicating differences in the periodicity of dFSB electrical SWA between morning and night. (b) Example in vivo recordings of R5 and dFSB electrical activity in the morning after sleep deprivation throughout the night. (c) Average power spectrum of in vivo electrical activity of the dFSB under different conditions. Oscillatory power between 0.5-1.5 Hz is increased in the dFSB at night as well as in the morning after sleep deprivation (n = 9 for morning, n = 10 for night and sleep deprived), Kruskal-Wallis test with post hoc Dunn’s multiple comparisons, P***<0.001. (d) Ex vivo example recording of R5 and dFSB electrical patterns at night. (e) Cross correlogram of ex vivo electrical patterns of R5 and dFSB (n = 10) indicates partial temporal overlap. (f) Ex vivo wide-field image of dFSB neurites and compound recordings of presynaptic electrical activity. Square indicates recording site. (g) Average power spectra of ex vivo compound oscillations in dFSB presynapses. Slow-wave power (0.5-1.5 Hz) is increased at night (n = 10 for morning, n = 9 for night), two-sided Mann-Whitney test, P*=0.043. (h) Ex vivo wide-field image of dFSB cell bodies and multi-cellular voltage imaging of individual dFSB neurons. Circles indicate recording sites. (i) Average power spectrum of ex vivo single-cell voltage recordings showing increased slow-wave power (0.5-1.5 Hz) at night (n = 23 cells for ZT 2-4 and n = 34 cells for ZT 14-15, all examined over 7 independent flies per group), two-sided Mann-Whitney test, P**=0.002. (j) Correlation between electrical patterns of individual cell bodies is similar in the morning and at night (n = 30 for morning and n = 39 for night), two-sided Mann-Whitney test. All graphs showing error bars are represented as mean ± s.e.m. n refers to independent flies measured unless stated otherwise. Source Data
Extended Data Fig. 2
Extended Data Fig. 2. Functional interactions between R5 and dFSB.
(a, d) Schematic of ex vivo presynaptic recording sites (blue) and sites of optogenetic, activation (red). (b) Example traces of dFSB presynaptic Ca2+activity (R23E10-Gal4) during optogenetic activation (red bars) of R5 neurons (R58H05-LexA). (c) Slow-wave power in the dFSB increases after optogenetic stimulation of R5 neurons (n = 10), two-sided Friedman test with post hoc Dunn’s multiple comparisons, P*=0.045, P**=0.007. Moreover, optogenetically inducing oscillations is facilitated at night (data pooled for during and after, n = 20), two-sided Mann-Whitney test, P*<0.001. (e) Example traces of R5 presynaptic Ca2+ activity (R58H05-Gal4) during optogenetic activation of dFSB neurons (R23E10-LexA). (f) At night R5 slow-wave power increases during optogenetic stimulation of dFSB neurons (n = 10 for morning, n = 11 for night), two-sided Friedman test with post hoc Dunn’s multiple comparisons, P*=0.021. As in c, optogenetically inducing oscillations is facilitated at night (data pooled for during and after, n = 20 for morning, n = 22 for night), two-sided Mann-Whitney test, P***<0.001. To account for slower Ca2+-kinetics, we investigated a slightly broader frequency range (0-1.5 Hz) compared to voltage recordings (0.5-1.5 Hz). (g, h) Left: Schematic overview of presynaptic recording sites (blue) and sites of optogenetic activation (red). (g) Average power spectra of dFSB compound oscillations before and after optogenetic stimulation of R5 (n = 10). (h) Average power spectra of R5 compound oscillations before and during optogenetic stimulation of dFSB neurons (n = 11). (a-h) To suppress spontaneous activity during optogenetic activation we used a high Mg2+ solution. (i) Example recording and individual data points of slow-wave power showing ongoing R5 presynaptic Ca2+ oscillations after cessation of dFSB stimulation. (j) Schematic overview indicating expression of GtACR1 in dFSB and Ca2+ recording sites at the R5 ring. Recordings were performed in low Mg2+ settings to allow for spontaneous activity. (k) Example traces of R5 presynaptic Ca2+ activity (R58H05-LexA) and slow-wave power (0.5-1.5 Hz) showing that R5 oscillations are reduced during optogenetic inhibition of dFSB neurons (R23E10-Gal4) at nighttime (n = 6 for R5>GCaMP, n = 7 for dFSB>GtACR), two-sided Friedman test with Dunn’s multiple comparisons, P**=0.007. (l) In some recordings R5 presynaptic Ca2+ activity showed partial recovery of oscillatory activity during optogenetic inhibition of dFSB neurons. All graphs showing error bars are represented as mean ± s.e.m. n refers to independent flies measured. Source Data
Extended Data Fig. 3
Extended Data Fig. 3. Behavioral quiescence.
(a) Left: arousability of sleeping flies to different durations of green light. After 5 min of immobility, sleeping flies were presented with 5 or 10 s of continuous green light from above. Right: averaged normalized locomotion traces of +/LexAop-CsChrimson flies after exposure to 5 (n = 17) or 10 (n = 16) s of green light. Curves: mean ± s.e.m. (b) Left: duration of the visual stimulus affected flies’ locomotor response (n = 17 for 5 s, n = 16 for 10 s), Mann-Whitney test, P**=0.005. Right: percentage of sleeping flies that started walking (‘awakened’) within 38 s after the presentation of green light. Effect of duration of visual stimulus on number of flies waking up, Binomial test. The n of flies for each condition is indicated in the bar plots. (c) Exposure of rested flies to 5 s of green light from above did not affect the mean velocity of flies (n = 10), Wilcoxon signed-rank test, P = 0.232. (d) Optogenetic stimulation of R5 neurons at 1 Hz using the protocol described in Fig. 2d. (e) Activation of R5 neurons at 1 Hz in rested flies expressing CsChrimson under R58H05-Gal4 control decreased distance travelled, time walking and mean walking velocity compared to control flies (n = 15 for R5 activation and n = 16 for CsChrimson control), Mann-Whitney test (P***<0.001 and P*=0.049) and Wilcoxon signed-rank test (comparisons to baseline locomotion depicted in color, P*=0.044 and P***<0.001 in effect on total distance, P***<0.001 in effect on time walking and mean walking velocity). (f) Left: average locomotion traces of CsChrimson control (n = 16) showing slight effects to red light during 1 Hz stimulation. Curves: mean ± s.e.m. (g) Mean walking velocity of R58H05-LexA>LexAop-CsChrimson flies was reduced when R5 was activated at 1 Hz, resembling the locomotion levels of sleep-deprived flies (n = 63 for rested, n = 22 for rested+R5 activation, n = 28 for sleep-deprived), Kruskal-Wallis test with Dunn’s multiple comparisons, P***<0.001. (h) Activation of R5 neurons at 0.1 Hz in rested flies under R58H05-Gal4 control did not affect locomotion (n = 10), Friedman test with Dunn’s multiple comparisons. Experiments shown in this figure were performed during the subjective day of the flies (ZT 1-10). (i) Schematic overview of the optogenetic activation and recording sites of R5 neurons under R58H05-Gal4 control. (j) In vivo average whole-cell current-clamp recordings of R5 neurons stimulated at 1 Hz for 6 s with a 5 ms light pulse (n = 6, mean ± s.e.m.). Right: Average power spectrum (mV2/Hz) of R5 neurons during optogenetic manipulation. 1 Hz optogenetic activation induces depolarization events at a peak frequency of 1 Hz in R5 neurons. (k) Top: periods of short rest were quantified in sleep deprived +/LexAop-CsChrimson flies that remained awake during a 10 min baseline activity (‘no sleep’) and in flies that fell asleep during this time. In the latter, periods of rest were quantified in the time before falling asleep (‘before sleep’). Bottom: flies that fell asleep performed rest bouts of longer duration and spent more time resting than flies that remained awake (n = 32 for ‘no sleep’ and n = 14 for ‘before sleep’), Mann-Whitney tests (P***<0.001 and P*=0.035). (l) Flies that remained awake showed higher frequency of rest bouts of shorter duration (< 1 min), while those falling asleep displayed higher frequency of rest bouts of a longer duration (1-2 min) (n = 32 for ‘no sleep’ and n = 14 for ‘before sleep’), Mann-Whitney tests (P**=0.005 and P*=0.038). Behavioral data were taken during the subjective day of the flies (ZT 1-7). All box-plots show the median (line), interquartile range (box, Q1 to Q3) and the minimum to maximum range (whiskers). All statistical tests were two-sided. Source Data
Extended Data Fig. 4
Extended Data Fig. 4. Connectivity between R5, helicon and dFSB.
(a) Synaptic input and output connections (connectome) from R5 neurons show high connectivity to helicon cells. (b) Neuron-to-neuron connectivity plot for connections from R5 to helicon (left) and vice versa (right). Number of connections were normalized to the total number of output connections of each R5 neuron (left) and to the total number of output connections of each helicon cell (right). (c) Top synaptic input and output connections of all helicon cells. Number of input and output connections of helicon per neuronal type were normalized to the total number of input and output connections of helicon cells. (d) Fraction of helicon cell input and output from dFSB layers normalized to the total number of input and output connections of helicon cells. (e) Morphological rendering of R5 neurons (20), helicon cells (4) and FB6A (6) (dFSB) neurons. Yellow dots/arrow indicate areas of synaptic connections of helicon cells to R5 neurons and black dots/arrow indicate areas of synaptic connections from the dFSB to helicon cells. Source Data
Extended Data Fig. 5
Extended Data Fig. 5. R5 and helicon SWA.
(a) Example in vivo ArcLight recording of helicon presynaptic electrical oscillations (R24B11-Gal4). (b) Time-lag dependent correlation of in vivo R5 and helicon presynaptic electrical patterns demonstrating correlated synchronized and shifted states at night compared to uncorrelated patterns in the morning. No synchronized states occur after sleep deprivation and during the midday (n = 19 for morning, n = 22 for night, n = 9 for midday, n = 11 morning sd). (c) Oscillatory power in helicon (0.5-1.5 Hz) is unaffected in the morning, after sleep deprivation (sd) throughout the night (n = 19 for morning and n = 11 for morning sd), two-sided Mann-Whitney test. (d) Example in vivo two-color voltage imaging recordings of R5 and helicon presynaptic electrical patterns showing the correlated shifted state at night and uncorrelated morning activity (same as shown in Fig. 3c). (e) Upper panel: simultaneous recordings of leg movement (percentage of frames moved, see Methods) and R5/helicon electrical patterns (R58H05-Gal4>UAS-ArcLight;R24B11-LexA>LexAop-Varnam) during the morning and at night. Low correlation between R5 and helicon in the morning is associated with a high degree of leg movement, while a high correlation at night is associated with a low degree of leg movement (n = 4 for morning, n = 3 for night), two-sided unpaired t-test, P**=0.002, P*=0.015. Lower panel: correlation between movement intensity and R5/helicon network coherence of individual time bouts (seconds range). Regression lines for bouts recorded at night (R2 = 0.31) or day (R2 = 0.02) are shown. (f) Example ex vivo two-color voltage imaging recordings of R5 and helicon presynaptic electrical patterns (same as shown in Fig. 3g). (g) In vivo inhibition of ionotropic GABA receptors (please note that the glutamate-gated chloride channel GluCl might also be inhibited) through picrotoxin increases correlation and facilitates the synchronized state of R5 and helicon presynaptic electrical patterns (n = 6), Wilcoxon matched-pairs signed rank test, P*=0.031. (h) Ex vivo wide-field images of presynaptic structures expressing the green voltage indicator ArcLight in helicon cells (R24B11-Gal4) and the red voltage indicator Varnam in R5 neurons (R58H05-LexA). Example ex vivo recordings of R5 and helicon presynaptic electrical patterns indicating synchronized activity at night (ZT 14-16, n = 8). All graphs showing error bars are represented as mean ± s.e.m. Box-plots show the median (line), interquartile range (box, Q1 to Q3) and minimum to maximum range (whiskers). n refers to independent flies measured. Source Data
Extended Data Fig. 6
Extended Data Fig. 6. R5 connectivity, neurotransmitters and helicon states.
(a) Neuron-to-neuron connectivity plot for connections from R5 to R5 (connectome). Numbers of connections were normalized to the total number of output connections of each R5 neuron. White squares indicate no direct connections. (b) Expression of HA-tagged endogenous VAChT::HA (vesicular acetylcholine transporter) and mCD8::GFP in presynaptic sites of R5 neurons targeted by R58H05-Gal4 and immunostained with anti-GFP and anti-HA. Top row: single confocal plane. Bottom row: Maximum projection of R5 presynaptic region. Scale bar, 5 μm. (c) Single confocal sections of R5 cell bodies expressing mCD8::GFP under control of R58H05-Gal4 labeled with antibodies against ChAT (choline acetyl transferase) and GABA. Images are representative examples of one brain from four independent experiments. Asterisks indicate GFP-expressing R5 neurons. Scale bar, 5 μm. (d) Top: wide-field images of single helicon cell bodies expressing ArcLight (R24B11-Gal4) in the morning (ZT1-4) and at night (ZT12-16). Bottom: average fluorescence intensity is increased at night, indicating that helicon cells are more hyperpolarized at night relative to the morning (n = 12), Mann-Whitney test, P***<0.001. Please note that here absolute increases in fluorescence intensity in ArcLight recordings are correlated with hyperpolarizations, while decreases are correlated with depolarizations (see Methods). (e) Representative view of helicon cells labelled by R24B11-Gal4>UAS-mCD8::GFP and the presynaptic sites of R5 neurons labelled by R58H05-LexA>LexAop-Syd1::HA (1 experiment performed). Scale bar, 5 µm. (f) Zoom-in of the area highlighted in e (white dashed box). White arrowheads indicate R5 synapses (Syd-1, presynaptic active zone marker), which overlap with the VAChT signal and are in close proximity to the GFP signal labelling helicon cells. Blue arrowheads depict R5 synapses which do not overlap with VAChT (VACh-) and are in close proximity to the GFP signal expressed by helicon cells. Red arrowheads indicate putative VAChT positive (VACh+) helicon synapses (GFP). Blue circles indicate the location of R5 synapses. Scale bar, 2 µm. (g) Zoom in of a VACh+ R5 presynaptic active zone (Syd-1) highlighted in (f) (white dashed box). Syd-1 colocalizes with VAChT. The white circle indicates the area of the R5 presynaptic active zone. Scale bar, 1 µm. All graphs showing error bars are represented as mean ± s.e.m. Source Data
Extended Data Fig. 7
Extended Data Fig. 7. R5 and helicon interactions shaping SWA.
(a-f) Numerical simulations of R5 and helicon networks; for details on the implementation see Supplementary information. (a) Simulated synchronization in an isolated R5 network (20 recurrently connected neurons) that are spiking (morning, left) or bursting (night, right). Mean correlation coefficients (color-coded) against the resulting charge transfer I*τ (in units of ms) of inhibition (inh) and excitation (exc). Network synchronisation (mean correlation coefficient > 0.5) requires some excitatory component, and synchronization increased with increasing excitation and with decreasing inhibition. (b) Top: spike raster plot of 20 R5 neurons in spiking mode and in a rather desynchronized state (I*exc = 0.05, τexc = 4 ms, I*inh = −0.01, τinh = 20 ms, mean correlation coefficient ~0.3). Bottom: population rate divided by the number of neurons (n = 10 simulations). (c) Top: spike raster plot of 20 R5 neurons in burst-firing mode and in a highly synchronized state (I*exc = 0.20, τexc = 4 ms, I*inh = −0.01, τinh = 20 ms, mean correlation coefficient ~0.9). Bottom: population rate divided by the number of neurons (n = 10 simulations). (d) Left: schematic summary of simulated R5 and helicon interactions in the morning (see also Fig. 4c, left). Right: compound activity of helicon and R5 neurons in the morning normalized by the number of neurons in each network. In the morning, SWA was weak in both networks (n = 10 simulations). (e) Left: schematic summary of simulated R5 and helicon interactions at night (see also Fig. 4c, right). Right: compound activity of membrane potential dynamics of helicon cells and R5 neurons at night normalized by the number of neurons in each network. In the evening, both networks showed increased SWA activity (n = 10 simulations). (f) Offset (maximum of cross correlation) between activity of helicon and R5 during night. In simulations in which helicon received additional external stimuli (right), the offset was increased compared to the case without stimulation (left). (g) Example recording of ex vivo helicon electrical activity (R24B11-Gal4) during 1 Hz optogenetic activation (red bar) of R5 neurons (R58H05-LexA) in the morning. (h) Individual data points of helicon delta power (0.5-1.5 Hz) before, during and after 1 Hz optogenetic activation of R5. (i) Average slow-wave power between 0.8-1.2 Hz is significantly increased during 1 Hz optogenetic activation of R5 (n = 6 flies), Friedman test with post hoc Dunn’s multiple comparisons, P*=0.019. Please note that we narrowed our analysis window to precisely capture the effect of induced rhythmic R5 activation at 1 Hz on helicon in this case. (j) Average power spectra of helicon electrical activity before and after optogenetic stimulation of R5 (n = 6 flies, R24B11-Gal4>UAS-ArcLight and R58H05-LexA>LexAop-CsChrimson). (k) Following R5 stimulation, peak frequencies in helicon are shifted. Quantification of power at shifted peak frequency after stimulation in helicon before and after 1 Hz R5 stimulation (n = 6 flies), two-sided paired t-test, P**=0.004. All graphs showing error bars are represented as mean ± s.e.m., except (f), which shows mean ± s.d. Source Data
Extended Data Fig. 8
Extended Data Fig. 8. R5 and helicon-based modulation of sensory responsiveness.
(a) Top: schematic overview of optogenetic activation protocol to test behavioral responsiveness during network activation in sleep-deprived flies (described in Fig. 4f). Bottom: the effect of helicon activation on locomotion differed to that of R5 and R5+helicon activation (n = 33 for CsChrimson control, n = 21 for R58H05-LexA>LexAop-CsChrimson, n = 47 for R24B11-LexA>LexAop-CsChrimson and n = 17 for R58H05-LexA;24B11-LexA>LexAop-CsChrimson), Kruskal-Wallis test with Dunn’s multiple comparisons (ON1: P***<0.001, ON3: P**=0.0065, P***<0.001) and Wilcoxon signed-rank tests (comparisons to baseline locomotion, colored asterisks (ON1: P***<0.001; ON3: P***<0.001, P*=0.027 for R5 activation and P*=0.014 for R5+helicon activation; post: P**=0.001 and P***<0.001). (b) Arousability in response to green light of flies that did not start walking (were not awakened) before the onset of green light. Stimulation of R5 and R5+helicon dampened the arousability of flies by the green stimulus (n = 18 for CsChrimson control, n = 12 for R58H05-LexA>LexAop-CsChrimson, n = 9 for R24B11-LexA>LexAop-CsChrimson and n = 7 for R58H05-LexA;R24B11-LexA>LexAop-CsChrimson), Wilcoxon matched-pairs signed rank tests (P*=0.03 for control and P*=0.015 for helicon activation). (c) Percentage of sleeping flies that started walking (‘awakened’) at the beginning of the optogenetic stimulation (top, ‘ON 1’) or when exposed to green light (bottom, ‘ON 2’). 1 Hz stimulation of the helicon network led to more flies waking up at the beginning of the stimulation when compared to the genetic control, Binomial test (P***<0.001). The n of flies for each condition is indicated in the bar plots. (d) Schematic overview of optogenetic activation protocol to test behavioral responsiveness to a 10 s long air puff during network activation in sleep-deprived flies using the same protocol as used in (a). (e) Average locomotor traces of CsChrimson control ( + retinal, n = 18), R58H05-LexA>LexAop-CsChrimson ( + retinal, n = 21), R24B11-LexA>LexAop-CsChrimson ( + retinal, n = 18) and R58H05-LexA;R24B11-LexA>LexAop-CsChrimson ( + retinal, n = 11) sleep-deprived flies during air puff experiments. Curves: mean ± s.e.m. (f) Arousability in response to an air puff of flies that did not start walking (were not awakened) before the stimulus onset. Stimulation of R5+helicon, but not that of R5 alone dampened the arousability of flies by the air puff (n = 8 for CsChrimson control, n = 11 for R58H05-LexA>LexAop-CsChrimson, n = 4 for R24B11-LexA>LexAop-CsChrimson and n = 4 for R58H05-LexA;R24B11-LexA>LexAop-CsChrimson), Wilcoxon matched-pairs signed rank tests (P*=0.015 for control, P*=0.042 for R5 activation). (g) Percentage of sleeping flies that started walking (‘awakened’) at the beginning of the optogenetic stimulation (top, ‘ON 1’) or after being exposed to the air puff (bottom, ‘ON 3’). Percentages of flies waking up during R5, helicon and R5+helicon activation were compared to that of control flies using a Binomial test. The n of flies for each condition is indicated in the bar plots. Behavioral data were acquired during the subjective day of the flies (ZT 1-7) after 12–19 h of sleep deprivation. (h) Schematic overview of the optogenetic protocol used to inhibit helicon cells at 1 Hz in rested flies. (i) Left: average locomotion traces of R24B11-Gal4>UAS-GtACR1 flies ( + retinal, n = 19) before, during and after pulsed inhibition of helicon cells. Note that light exposure slightly modulates the behavior of the control flies. Curves: mean ± s.e.m. Right: R24B11-Gal4>UAS-GtACR1 flies (n = 19) reduced distance travelled during pulsed inhibition of helicon cells compared to +/UAS-GtACR1 controls (+ retinal, n = 18), Mann-Whitney (P**=0.0013) and Wilcoxon signed-rank tests (comparisons to baseline locomotion, P***<0.001). Box-plots show the median (line), interquartile range (box, Q1 to Q3) and minimum to maximum range (whiskers). All statistical tests were two-sided. Source Data
Extended Data Fig. 9
Extended Data Fig. 9. Behavioral readout of strong EPG input.
(a) Schematic overview of the optogenetic protocol used to activate EPG neurons at 1 Hz under R60D05-Gal4 control. (b) Activation of EPG neurons in rested flies at 1 Hz did not affect locomotion (n = 27), Friedman test with Dunn’s multiple comparisons. The effect on distance travelled of 1 Hz stimulation in R60D05-Gal4>UAS- CsChrimson flies (+ retinal, n = 27) did not differ from that of control flies (+ retinal, n = 13), Mann-Whitney test (comparisons between genotypes depicted in black) and Wilcoxon signed-rank test (comparisons to baseline locomotion depicted in color). (c) Schematic overview of 10 Hz EPG activation under R60D05-Gal4 control in rested flies. (d) Left: average locomotion trace of R60D05-Gal4>UAS-CsChrimson flies (+ retinal, n = 22). Right: example trajectories of R60D05-Gal4>UAS-CsChrimson and control flies. (e) High frequency activation of EPG neurons reduced locomotion after stimulation (n = 22), Friedman test with Dunn’s multiple comparisons, P***<0.001. 10 Hz EPG activation (n = 22) led to an increased mean velocity in the initial stimulation phase and decreased distance travelled after stimulation compared to control flies (n = 14), Mann-Whitney test (comparisons between genotypes depicted in black, P***<0.001) and Wilcoxon signed-rank test (comparisons to baseline locomotion depicted in color, P***<0.001). Optogenetic activation of EPG (n = 22) increased the number of turns compared to controls (n = 14), Mann-Whitney-test, P***<0.001. All graphs showing error bars are represented as mean ± s.e.m. All box-plots show the median (line), interquartile range (box, Q1 to Q3) and the minimum to maximum range (whiskers). All statistical tests were two-sided. Source Data
Extended Data Fig. 10
Extended Data Fig. 10. R5 and helicon transduce/filter visually-evoked information to EPG.
(a) Example recordings indicating that focal optogenetic activation of R5 in vivo induces hyperpolarization of EPG neurons (n = 3). Compare ex vivo experiments in Fig. 5g. (b) Example traces indicating that in vivo light-mediated stimulation of the retina depolarizes EPG neurons while concurrent optogenetic stimulation of R5 attenuates light-evoked EPG responses (n = 8). (c) Quantification of (a). EPG response amplitudes show that R5 activation hyperpolarizes EPG during focal optogenetic activation in vivo (n = 15 stimulations from 3 independent flies per group), two-sided Mann-Whitney test, P***<0.001. (d) Representative recordings of visually-evoked responses in EPG neurons (R60D05-Gal4>UAS-ArcLight) in the morning (ZT 0-3) and at night (ZT 14-18) before and after chemogenetic acute block of R5 (R58H05-LexA>LexAop-ort) or helicon (24B11-LexA>LexAop-ort) through ectopically expressed histamine receptors. (e) Normalized visually-evoked responses in EPG neurons. Acute block of helicon leads to decreased visual responses in the morning while acute block of R5 leads to increased visual responses at night (n = 6 for control, n = 7 for all other groups), two-sided Wilcoxon matched-pairs signed rank test, P*=0.016 for both comparisons. (f) Example traces of spontaneous electrical activity in EPG (R60D05-Gal4>UAS-ArcLight) in the morning (ZT 0-3) and at night (ZT 14-18) before and after chemogenetic acute block of R5 (R58H05-LexA>LexAop-ort). (g) Oscillatory power (0.5-1.5 Hz) in EPG neurons is increased at night compared to the morning. Acute block of R5 at night reduced oscillatory power (n = 6 for control, n = 7 for R5 block), two-sided Kruskal-Wallis test to compare between genotypes (P**=0.002) and paired t-test to compare within genotype (P*=0.040). (h) Acute block of R5 at night reduces the amplitude of inhibitory as well as excitatory potentials measured in EPG (all excitatory and inhibitory potentials were averaged for each recording (n = 7), two-sided paired t-test, P***<0.001). (i) Model of the sensory filter. All graphs showing error bars are represented as mean ± s.e.m. n refers to independent flies measured unless stated otherwise. Source Data
Extended Data Fig. 11
Extended Data Fig. 11. R5 and helicon control recordings.
In vivo recordings of R5 and helicon electrical activity demonstrating the stability of oscillatory patterns across time and Mg2+ concentrations. (a) Example of in vivo recording of R5 and helicon electrical activity at night (ZT 14-18) (n = 3). Recordings were performed at 20 Hz and over a time span of 2 min. (b) Power spectral densities (PSDs) of compound oscillations shown in (a). (c) Cross-correlogram of compound oscillations shown in (a) indicates that synchronized electrical activity is stable over longer durations (n = 3 flies; in other recordings c(0) was 0.56 and 0.61). (d) Example in vivo recordings of R5 and helicon electrical activity at night (ZT 14-18) performed in 5 mM extracellular Mg2+. (e) Power spectral densities (PSDs) of compound oscillations shown in (d). (f) Coherence between helicon and R5 electrical patterns at night (ZT 14-18) in 5 mM extracellular Mg2+ (n = 4 flies). All graphs showing error bars are represented as mean ± s.e.m. Source Data

References

    1. Keene, A. C. & Duboue, E. R. The origins and evolution of sleep. J. Exp. Biol.12, jeb159533 (2018). - PMC - PubMed
    1. Andrillon, T. & Kouider, S. The vigilant sleeper: neural mechanisms of sensory (de)coupling during sleep. Curr. Opin. Physiol.15, 47–59 (2020).
    1. Raccuglia, D. et al. Network-specific synchronization of electrical slow-wave oscillations regulates sleep drive in Drosophila. Curr. Biol.29, 3611–3621.e3613 (2019). - PubMed
    1. Liu, S., Liu, Q., Tabuchi, M. & Wu, M. N. Sleep drive is encoded by neural plastic changes in a dedicated circuit. Cell165, 1347–1360 (2016). - PMC - PubMed
    1. Donlea, J. M. et al. Recurrent circuitry for balancing sleep need and sleep. Neuron97, 378–389.e374 (2018). - PMC - PubMed

LinkOut - more resources