. 2025 Oct;646(8085):734-745.
doi: 10.1038/s41586-025-09433-w. Epub 2025 Aug 20.

Targeting G1-S-checkpoint-compromised cancers with cyclin A/B RxL inhibitors

Affiliations

Targeting G1-S-checkpoint-compromised cancers with cyclin A/B RxL inhibitors

Shilpa Singh et al. Nature. 2025 Oct.

Abstract

Small-cell lung cancers (SCLCs) contain near-universal loss-of-function mutations in RB1 and TP53, compromising the G1-S checkpoint and leading to dysregulated E2F activity1. Other cancers similarly disrupt the G1-S checkpoint through loss of CDKN2A or amplification of cyclin D or cyclin E, also resulting in excessive E2F activity2,3. Although E2F activation is essential for cell cycle progression, hyperactivation promotes apoptosis4-9, presenting a therapeutic vulnerability. Cyclin proteins use a conserved hydrophobic patch to bind to substrates bearing short linear RxL motifs10-13. Cyclin A represses E2F through an RxL-dependent interaction10,14, which, when disrupted, hyperactivates E2F15. However, this substrate interface has remained difficult to target. Here we developed cell-permeable, orally bioavailable macrocyclic peptides that inhibit RxL-mediated interactions of cyclins with their substrates. Dual inhibitors of cyclin A and cyclin B RxL motifs (cyclin A/Bi) selectively kill SCLC cells and other cancer cells with high E2F activity. Genetic screens revealed that cyclin A/Bi induces apoptosis through cyclin B- and CDK2-dependent spindle assembly checkpoint activation. Mechanistically, cyclin A/Bi hyperactivates E2F and cyclin B by blocking cyclin A-E2F and cyclin B-MYT1 RxL interactions. Notably, cyclin A/Bi promoted the formation of neomorphic cyclin B-CDK2 complexes, which drive spindle assembly checkpoint activation and mitotic cell death. Finally, orally administered cyclin A/Bi showed robust anti-tumour activity in chemotherapy-resistant SCLC patient-derived xenografts. These findings reveal gain-of-function mechanisms through which cyclin A/Bi triggers apoptosis and support their development for E2F-driven cancers.


Conflict of interest statement

Competing interests: M.G.O. reports grants from Eli Lilly, Takeda, Novartis, BMS, Auron Therapeutics and Circle Pharma. M.G.O. and D.N. received an SRA from Circle Pharma to fund this work. C.E.G., R.O., F.H.-I., D. He, M.W.M., M.N., N.N.G., S.S.F.L., B.F.-W., L.H., M.P.B., B.M.L., D.S., J.F.L., D. Hoang, Y.G., M.C., M.K.D., S.M., C.B., J.A.S., K.Y., N.J.D., A.T.B., J.F., R.B., P.C., J.B.A., L.-F.L., B.L., E.W.W., C.K., M.E., R.S., D.J.E. and P.D.G. are employees of Circle Pharma. The other authors declare no competing interests.

Figures

Fig. 1
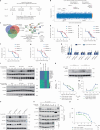
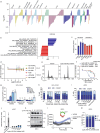
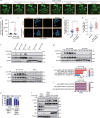
Fig. 1. Cyclin A/B RxL inhibitors induce apoptosis in cancer cells with high E2F activity.
a, The structure of cyclin A (PDB: 1JSU), coloured by surface charge (blue, basic; red, acidic; white, neutral). HP, hydrophobic patch; S, the smaller adjacent hydrophobic pocket. b, The biochemical activity of cyclin RxL macrocycles against cyclin A1–CDK2, cyclin E1–CDK2 and cyclin B–CDK1 complexes was measured using fluorescence polarization. c, Docked model of CIRc-004 (green) bound to cyclin A and a detailed stick representation. d, GI50 (concentrations resulting in 50% growth inhibition) waterfall plot of CIRc-004 in 46 human SCLC cell lines. e, Hallmark pathways associated with CIRc-004 sensitivity (false discovery rate (FDR) < 0.05) in 42 SCLC cell lines, calculated by GSVA using MSigDb Hallmark RNA-seq data (left). Cell lines were ranked by GI50. Each column represents a distinct SCLC cell line, ranked from most to least sensitive. Right, comparison of CIRc-004 GI50 values between high versus low E2F targets or G2M pathway groups (threshold, median pathway score; Mann–Whitney t-test). Alt., altered; non-alt, non-altered. f, Dose–response curves of the indicated SCLC (NCI-H1048, NCI-H446, NCI-H69, NCI-H82), NSCLC (A549, HCC4006, NCI-H1299) and human non-transformed RPE1 cell lines treated with CIRc-004 for 6 days. The average EC50 values are shown. The arrows indicate DMSO controls (used for normalization). g, Representative flow cytometry plots of cleaved PARP in NCI-H1048 cells treated with CIRc-004 (200 nM) or DMSO for 3 days. h, Flow cytometry quantification of cleaved-PARP-positive cells after 3 days of CIRc-004 treatment. i, The cell cycle distribution after 24 h treatment with CIRc-004 or DMSO followed by propidium iodide staining. For f, h and i, n = 3 biological replicates. Data are mean ± s.d. Statistical significance in h was determined using unpaired two-tailed Student’s t-tests; *P < 0.05, **P < 0.01, ***P < 0.001, ****P < 0.0001. Source Data
Fig. 2
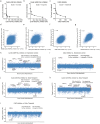
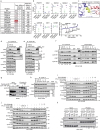
Fig. 2. Genetic screens reveal SAC-dependent mechanisms of cyclin A/B RxL inhibitor killing.
a, Schematic of the genome-wide CRISPR–Cas9 knockout resistance screen in NCI-H1048 cells transduced with the Brunello sgRNA library. After selection (day 10), cells were treated with CIRc-004 (200 nM), CIRc-001 (200 nM), PF-07104091 (CDK2i, 500 nM) or inactive enantiomer (I.E.) CIRc-005 (200 nM) and collected at day 26 (LTP). b, The top enriched and depleted hits from Apron analysis of CIRc-004 LTP versus CIRc-005 LTP. n = 2 biological replicates. c, The top enriched hits (q < 0.25) across treatments. Right, STRING network (https://string-db.org; CC BY 4.0) of shared hits highlights SAC proteins. dg, Dose–response curves of NCI-H1048 cells expressing two non-targeting sgRNAs (sgCtrl) or two sgRNAs targeting CCNB1 (d), CDK2 (e), KNTC1 (f) or MAD1L1 (g), treated with CIRc-004 for 6 days. h, Flow cytometry quantification of cleaved PARP in cells from dg treated with CIRc-004 (20 nM). Data are the fold change relative to vehicle. i, Immunoblot of the indicated SCLC and NSCLC cell lines treated for 24 h with increasing doses of CIRc-004. In dh, data are mean ± s.d. In di, n = 3 biological replicates. j, RNA-seq analysis of NCI-H1048 cells treated for 24 h with CIRc-004 (200 nM), CIRc-005 (200 nM) or PF-07104091 (500 nM); the top 150 differentially expressed genes are shown (adjusted P (Padj) < 0.05). k, Immunoblot analysis of p-KNL1 in NCI-H1048 cells treated with CIRc-004 (20 nM), BAY-1217389 (MPS1i, 3 nM) or both for 24 h. l,m, CIRc-004 dose–response for proliferation (l) and cleaved PARP FACS assays (m) in the presence or absence of 3 nM BAY-1217389 for 3 days in NCI-H1048 cells. Data are mean ± s.d. n = 3 biological replicates. n, Immunoblot analysis of NCI-H1048 cells expressing sgCtrl or CCNB1 sgRNAs treated with CIRc-004 (20 nM) or DMSO for 24 h (n = 3 biological replicates). o, Cyclin B1 immunoprecipitations from NCI-H1048 cells treated for 2 h with CIRc-004 (004), CIRc-028 (028), CIRc-005 (005), CIRc-018 (018) or CIRc-019 (019) (300 nM); MYT1 binding normalized to cyclin B1 is shown. n = 3 biological replicates for all except for CIRc-028, for which n = 2. p, Dose–response analysis of NCI-H1048 cells treated with CIRc-018 with or without RP-6306 (100 nM) for 5 days. Data are mean ± s.d. from two technical replicates; n = 3 biological replicates. In dg, l and m, the arrows indicate the DMSO-treated normalization controls. Statistical significance in h was calculated using unpaired two-tailed Student’s t-tests. Source Data
Fig. 3
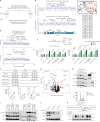
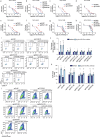
Fig. 3. Cyclin A/B RxL inhibitors promote cyclin B–CDK2 complex formation for SAC-induced cell death.
a, Schematic of the base-editor (BE) CRISPR resistance screen in NCI-H1048 cells transduced with an sgRNA library tiling CCNB1, CCNA2, CDK2, CDC20 and controls. After selection (day 10), cells were treated with CIRc-004 (200 nM) or inactive enantiomer CIRc-005 (200 nM) and collected at day 26. b, The average z-scored log-transformed fold change (LFC) of sgRNAs tiling CCNB1 in CIRc-004 versus CIRc-005 in A>G (top) and C>T (bottom) base-editor screens. Mutations are labelled by predicted amino acid changes. n = 4 biological replicates. c, Predicted AlphaFold 2 model of the cyclin B1–CDK1 interaction, showing cyclin B residues 169–177. d, The fold change in variant reads at each CCNB1 base in CIRc-004 versus CIRc-005. Mutations of interest are labelled. n = 2 biological replicates. e, FACS-based competition assays for the indicated CCNB1 sgRNA variants in GFP+ NCI-H1048 base-editor cells mixed with parental base-editor counterparts at 1:4 and treated with CIRc-004 for 13 days; the fold change enrichment over DMSO is shown. Data are mean ± s.d. n = 3 biological replicates. Statistical significance was calculated using unpaired two-tailed Student’s t-tests. f, The fraction of variant alleles in CCNB1-mutant lines from e after CIRc-004 (200 nM) or DMSO treatment for 13 days was analysed using deep amplicon sequencing. n = 2 biological replicates. g, Volcano plot of cyclin B Immunoprecipitation–mass spectrometry in NCI-H1048 cells treated for 2 h with CIRc-004 (50 nM) relative to CIRc-005. n = 3 biological replicates. Statistical significance was calculated using two-sample Student’s t-tests corrected for multiple hypothesis testing using permutation-based FDR (5%). h,i, Immunoblots after cyclin B1 immunoprecipitation (IP) from NCI-H1048 cells (h) or HA-tagged wild-type (WT) CCNB1 versus CCNB1 triple-mutant expressed in HEK293T cells (i) treated with CIRc-004 (300 nM) or DMSO. CDK2 band intensities were normalized to cyclin B1. n = 2 (h) or n = 3 (i) biological replicates. For h and i, the fold increase in CDK2 relative to DMSO is shown. j, Immunoblot of NCI-H1048 cells infected with CDK2 sgRNAs or sgCtrl and treated with CIRc-004 (20 nM) or DMSO for 24 h. k, Immunoblot of NCI-H69 cells synchronized in mitosis with nocodazole (60 ng ml−1) and released into CIRc-004 (20 nM), PF-07104091 (500 nM) or both. Top, propidium iodide (PI) histogram showing 16 h post-nocodazole synchronization. For j and k, n = 3 biological replicates. Source Data
Fig. 4
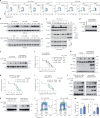
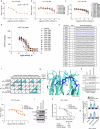
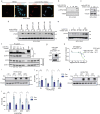
Fig. 4. Cyclin A RxL inhibition induces E2F1 hyperactivation and sensitizes cells to cyclin A/B RxL inhibitors.
a, FACS analysis of EdU and FxCycle staining in NCI-H1048 and NCI-H446 cells treated for 24 h with increasing CIRc-004 doses; the EdU+ 4C population is indicated. b, Immunoblot of the indicated SCLC and NSCLC lines treated for 3 days with CIRc-004. c, Immunoblot after cyclin A immunoprecipitation in NCI-H1048 cells treated for 2 h with CIRc-004, CIRc-028, CIRc-005, CIRc-018, CIRc-019 or DMSO (300 nM each). The E2F1 band intensity was normalized to cyclin A; the fold change relative to DMSO shown. WCE, whole-cell extract. de,g, Immunoblots of NCI-H1048 cells expressing doxycycline (DOX)-inducible E2F1-sgRNA-resistant cDNA and endogenous E2F1-targeting sgRNA, treated with or without DOX and then with CIRc-004 (20 nM) for 24 h (d,g) or 72 h (e). f,h,i, Dose–response assays of NCI-H1048 (f), MDA-MB-231 (h) and Jurkat (i) cells with or without DOX for 24 h, followed by CIRc-004 treatment for 3 or 6 days. Data are mean ± s.d. The arrows indicate the DMSO controls. j,k, Immunoblots of MDA-MB-231 and Jurkat cells from the experiments in h and i. l, FACS analysis of EdU and 4′,6′-diamidino-2-phenylindole (DAPI) staining in DOX-induced E2F1-expressing NCI-H1048 cells; the indicated populations are shown with the gates. m, Quantification of S-phase and EdU+ 4C populations from l. Data are mean ± s.d. Statistical significance was calculated using unpaired two-tailed Student’s t-tests. For a, b and dm, n = 3 biological replicates. For c, n = 2 biological replicates. For histone blots in e and k, total histone H3 was run as a sample-processing control on a separate gel. Source Data
Fig. 5
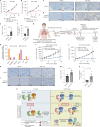
Fig. 5. Cyclin A/B RxL inhibitors exhibit on-target anti-tumour activity in SCLC mouse models in vivo.
a,b, Tumour volume curves of NCI-H69 (a) and NCI-H1048 (b) xenografts in athymic nude mice treated with vehicle or cyclin A/B RxL inhibitor (CIRc-028) dosed at 100 mg per kg (mpk) intravenously (i.v.) once per day for 14 days. n = 10 mice per arm (a), and n = 10 (vehicle) and n = 8 (CIRc-028) mice (b). Data are mean ± s.e.m. Statistical analysis was performed using two-way analysis of variance (ANOVA); P < 0.0001. c,d, Representative IHC analysis of p-KNL1 (c) and cleaved caspase-3 (d) in NCI-H69 tumours 18 h after treatment. e,f, Quantification of c (e) and d (f). n = 5 tumours from independent mice per group. Data are mean ± s.d. Statistical significance calculated using unpaired two-tailed Student’s t-tests. g, Schematic for DFCI-393 and DFCI-402 PDX studies with oral cyclin A/B RxL inhibitor CIRc-014. h, mRNA expression of SCLC transcription factors and neuroendocrine markers by RNA-seq. i,j, Tumour volume curves of DFCI-393 (i) and DFCI-402 (j) PDXs treated with CIRc-014 (100 mg per kg orally three times per day (i) or twice per day (j)) or vehicle for 28 days. The dashed lines indicate the start and end of treatment. For i, n = 10 (vehicle) and n = 9 (CIRc-014) mice. For j, n = 10 mice per arm. Data are mean ± s.e.m. Statistical analysis was performed using two-way ANOVA; P < 0.0001. k,l, Representative IHC analysis of p-KNL1 (k) and cleaved caspase-3 (l) in DFCI-393 tumours treated with CIRc-014 (100 mg per kg orally three times per day) for 4 days. m,n, Quantification of k (m) and l (n). For m and n, n = 5 (vehicle) and 6 (CIRc-014) tumours from independent mice. Data are mean ± s.d. Statistical significance was calculated using unpaired two-tailed students t-tests. o, The proposed mechanism: in cancers with compromised G1–S checkpoint (for example, RB1 and TP53 loss) and consequently high E2F activity, cyclin A binds to activating E2Fs through RxL motifs to dampen E2F activity, and cyclin B binds to MYT1 to restrain CDK1 activity during G2. Cyclin A/B RxL inhibitors disrupt both interactions: (1) blocking cyclin A–E2F1 repression increases replication stress; (2) blocking cyclin B–MYT1 binding allows cyclin B to form a neomorphic complex with CDK2, driving RxL-independent phosphorylation (of, for example, stathmin), SAC activation and mitotic death. The diagrams in g and o were created with BioRender. Scale bars, 50 µm (c,d), and 100 µm (×20) and 50 µm (×40) (k,l). Source Data
Extended Data Fig. 1
Extended Data Fig. 1. Discovery of Cyclin RxL Inhibitors.
a, Overlay of cyclin A/Cdk2 complexes shown in surface representation with bound ligands at the RxL binding site, including a macrocycle (yellow, PDB: 1URC) and p27Kip1 (purple, PDB: 1JSU). b, Computational model of a lariat decapeptide macrocycle bound at the RxL binding site, based on the bound structures of p27Kip1 (purple) and lariat macrocycle (yellow), as a ligand alignment template for binding prediction. c, Structures of CIRc-001, CIRc-004, CIRc-014, CIRc-018, CIRc-019 and CIRc-028. Two published cyclin A2 co-crystal structures with ligand bound at the RxL binding site, including the macrocycle, Ace-Arg-Lys-Leu-Phe-Gly (PDB code: 1URC) and the p27Kip1 peptide (PDB code: 1JSU), were used to generate a reference binding mode for our lariat macrocycles (Extended Data Fig. 1aabove). All modelling studies were performed using the Schrodinger software suite (version 2023-3). The crystal structures were first prepared using the Protein Preparation Workflow with default settings, and the cyclin A/Cdk2 complexes were subsequently aligned by using the protein structure alignment module. The bound ligands, aligned at the RxL binding motif, were combined to produce a template for novel ligand alignment. Specifically, the template model (Extended Data Fig. 1babove) is a lariat decapeptide (Lys-Pro-Ser-Ala-Cys-Arg-Lys-Leu-Phe-Gly) that contains the N-terminal hexapeptide segment of p27Kip1 (Lys25-Pro26-Ser27-Ala28-Cys29-Arg30, PDB: 1JSU) and the lariat cyclic pentapeptide (Lys502-Leu503-Phe504-Gly505, PDB: 1URC). To generate binding models of novel peptidic macrocycles, the 3D coordinates were generated by LigPrep and projected onto the template model by performing the maximum common substructure alignment for macrocycles in the ligand alignment module in Maestro (version 13.7.125) with cyclin A crystal structure (PDB: 1URC) specified as the receptor. The aligned ligand was further refined in the binding site by running Glide (ver. 10.0) SP docking with the “refine only” option in a docking grid based on the lariat-bound cyclin A crystal structure (PDB: 1URC). The docking grid was generated using the template model with default parameters. d, Detailed representation of modelled hydrogen bonds of CIRc-004 to Ile281, Trp217 and Gln 254 on cyclin A. e, Binding kinetic parameters determined in a WaveDelta instrument (Malvern Pananalytical) to Cyclin/Cdk complexes immobilized by amine coupling on a 4PCP chip (Malvern Pananalytical). Dissociation constant (KD; in nM), association rate (ka; in M−1sec−1) and dissociation rate (kd; in sec−1). f, Compounds physicochemical properties including Molecular Weight (MW), calculated water/oil partition (cLogP), kinetic solubility measured in 5% DMSO at pH 7.4 (mM), measured distribution coefficient between water and octanol (LogD) and MDCK cell apical to basolateral permeability (MDCK Papp; x10-6 cm/sec). g, Hypothesized model: In RB1-deficient cancers (e.g. SCLC) where E2F1 activity is dysregulated, targeting the cyclin A-E2F1 interaction hyperactivates E2F1, which could selectively impair tumour growth. Figure was created with BioRender. h. Waterfall plot of GI50s for four SCLC and the non-transformed WI-38 fibroblast cell lines for compounds listed in Fig. 1b. Source Data
Extended Data Fig. 2
Extended Data Fig. 2. Cyclin A/B RxL Inhibitors Induce Apoptosis in Cancer Cells with High E2F Activity.
a, Anti-proliferation GI50 waterfall plot of cyclin RxL A/B/E inhibitor (CIRc-001) tested against Horizon Discovery cancer cell line panel. n = 302 cell lines. b, Pathway enrichment scores for the top upregulated and down regulated MSigDb Hallmark gene sets within the differentially expressed genes identified between sensitive and resistant cell lines (n = 288 cell lines) to CIRc-001 using the data in A. Top pathways with FDR corrected <0.05 and Normalized Enrichment Score (NES) >= −/+ 2 are represented as blue (upregulated) or red (downregulated)). c, Average doubling time (hours) of sensitive (blue) and insensitive (red) cell lines using the data the DMSO control from Fig. 1f comparing cell counts at the endpoint (Day 6) compared to start (Day 0) of the dose-response assay. d, Dose response assays of the indicated human SCLC cell lines and insensitive human NSCLC cell lines treated for 6 days with increasing doses of the inactivate enantiomer of the cyclin A/B RxL inhibitor (CIRc-005). e, Representative histograms of flow cytometric analysis of propidium iodide (PI) stained NCI-H1048 cells treated with CIRc-004 (200 nM) or DMSO (vehicle) for 24 h. f, Dose response assays of NCI-H1048 cells treated for 6 days with increasing doses of the selective cyclin A RxL inhibitor (CIRc-018), the selective cyclin B RxL inhibitor (CIRc-019), or the cyclin A/B RxL inhibitor (CIRc-004). g, Quantitation of cleaved PARP positive cells analysed by flow cytometric analysis in NCI-H1048 cells treated for 3 days with the indicated doses of CIRc-018, CIRc-019, CIRc-004 or DMSO. Statistical significance was calculated using unpaired, two-tailed students t-test. h, Representative histograms of cell cycle distribution of NCI-H1048 cells treated with CIRc-018, CIRc-019, CIRc-004 or DMSO and then stained with PI. i) Representative histograms of cell cycle distribution of human hematopoietic stem and progenitor cells (HSPC) treated with CIRc-004, staurosporine (100 nM) or DMSO for 24 h. j) Quantitation of cleaved PARP positive cells analysed by flow cytometric analysis in HSPCs treated with CIRc-004, staurosporine (100 nM) or DMSO for 24 h. For i-j, n = 2 biological replicates. k, Immunoblot analysis of RPE1 cells treated with indicated concentrations of CIRc-004 for 72 h. l, Cell cycle phase progression measured over 27 h by time lapse imaging of RPE1 cells expressing FUCCI cell cycle reporter, treated with a higher concentration of CIRc-004 (2000 nM) which is required to promote cell cycle arrest in RPE1 cells (see Fig. 1f), or DMSO. Graph measures quantification of G1 (red FUCCI signal) cell cycle phase per image at progressive time points. Statistical significance calculated using 2-way ANOVA. n = 6 wells per treatment condition per replicate from 2 biological replicates, 1 representative experiment is shown. m, Representative histograms of cell cycle distribution of RPE1 cells treated with CIRc-004 (2000 nM) or DMSO for 72 h and then stained with PI. Data are mean +/− SD of 6 technical replicate wells. For c-h, k, m, n = 3 biological replicates. For c, f-g and j, data are mean +/- SD. Arrows in d, f indicates DMSO-treated sample which was used for normalization. Where indicated, ***=p < 0.001, ****=p < 0.0001. Source Data
Extended Data Fig. 3
Extended Data Fig. 3. Genome-wide CRISPR/Cas9 Knockout Screens Identify Genes Necessary for Cyclin A/B RxL Inhibitors to Induce Apoptosis in SCLC Cell Lines.
a-c, Dose response assays of NCI-H1048 cells treated with the indicated concentrations of the cyclin A/B RxL inhibitor (CIRc-004) (a), the cyclin A/B/E RxL inhibitor (CIRc-001) (b), or the orthosteric Cdk2 inhibitor (PF-07104091) (c) for 6 days. EC50’s are indicated. For a-b, n = 2. For c, n = 3 biological replicates. d-g, Scatter plot of sgRNA abundance represented as Log Fold Change (LFC) comparing the 2 biological replicates of the CRISPR/Cas9 knockout screen for CIRc-004 (d), CIRc-001 (e), PF-07104091 (f), and CIRc-005 (inactive enantiomer of CIRc-004) (g). h-l, Top enriched and depleted hits from Apron analysis of CIRc-001 at the late timepoint (LTP) (day 26) relative to CIRc-005 enantiomer negative control at the LTP (day 26) (h), PF-07104091 LTP vs. CIRc-005 LTP (i), or CIRc-004 LTP vs. early timepoint (ETP) prior to drug treatment (day 10) (j), CIRc-001 vs. ETP (k), PF-07104091 vs. ETP (l). For d-l, n = 2 biological replicates. Source Data
Extended Data Fig. 4
Extended Data Fig. 4. Validation of Genes that Modulate Response to Cyclin A/B RxL Inhibitors or CDK2 Inhibitors.
a-b, Dose response assays of NCI-H1048 cells infected with two independent non-targeting sgRNAs (sgCtrl) or two independent sgRNAs against LIN54 (a) or ZWINT (b), and treated for 6 days with increasing doses of the cyclin A/B RxL inhibitor (CIRc-004). c-f, Dose response assays of NCI-H446 cells infected with sgCtrl or sgRNAs against C) CCNB1 (c), CDK2 (d), KNTC1 (e), MAD1L1 (f), treated for 6 days with increasing doses of CIRc-004. g-h, Dose response assays of NCI-H1048 cells infected with two non-targeting sgRNAs (sgCtrl) or two independent sgRNAs against CCNB1 (g) or CDK2 (h), and treated for 6 days with increasing doses of the Cdk2 inhibitor (PF-07104091). i) Representative flow cytometric analysis of phospho-histone H3 in NCI-H1048 cells infected with the indicated sgRNAs and treated with CIRc-004 at 20 nM or DMSO for 24 h. j-k, Quantitation of cells in mitosis by flow cytometry analysis using phospho-histone H3 from i (j) or PI (k) of NCI-H1048 cells transduced with the indicated sgRNAs and then treated with CIRc-004 at 20 nM or DMSO for 24 h. l) Representative flow cytometric analysis from Fig. 2h of cleaved PARP in NCI-H1048 cells infected with the indicated sgRNAs and treated with CIRc-004 at 20 nM or DMSO for 3 days. For i, data are shown as fold change relative to vehicle. For a-h, j, k, n = 3 biological replicates and data are mean +/– SD. Arrows in a-h indicates DMSO-treated sample used for normalization. Statistical significance in j, k was calculated using unpaired, two-tailed students t-test. Where indicated, *=p < 0,05, **=p < 0.01. Source Data
Extended Data Fig. 5
Extended Data Fig. 5. Forward Genetic Screen Identifies CDC20 Mutants that Cause Resistance to a Cyclin A/B RxL Inhibitor.
a, Dose response curve of iHCT116 cells treated with increasing doses of cyclin A/B RxL inhibitor (CIRc-004). b-c, Dose-response curves for six clones isolated from Mut-low iHCT116 cells (b) and 12 clones from Mut-high iHCT116 cells treated with increasing doses of CIRc-004 for 3 days (c). d, Dose response curve to MLN4924 of different CIRc-004 resistant iHCT116 clones. For a-d n = 2 technical replicates. Data are mean +/− SEM. e, Barcode sequences identified in 18 different CIRc-004 resistant clones, common sequences are marked in blue. f, Genes recurrently mutated (≥2 clones) among eight CIRc-004-resistant iHCT-116 clones from the forward genetic screen. g, Mutated residues (blue) in CDC20 (PDB 4GGD) present in CIRc-004 resistant clones. h, Immunoblot analysis of iHCT116 cells stably expressing vector, Flag-CDC20 WT, or Flag-CDC20 R445Q mutant. i, Dose response assay of iHCT-116 cells from h treated with increasing doses of CIRc-004. For i, n = 3 technical replicates. Data are mean +/− SEM. j, Immunoblot analysis of NCI-H1048 cells stably expressing empty vector, Flag-CDC20 WT, or Flag-CDC20 R445Q; Actin run on separate gel as a sample processing control. k-m, NCI-H1048 cells from j assessed for CIRc-004 dose response (k), cleaved PARP (l), and phospho-histone H3 (m) by flow cytometry following CIRc-004 treatment (20 nM). For k-m, n = 3 biological replicates; data represent mean ± SD. Statistical significance determined by unpaired, two-tailed Student’s t-test. Where indicated, *=p < 0,05, ****=p < 0.0001. Source Data
Extended Data Fig. 6
Extended Data Fig. 6. Cyclin A/B RxL Inhibitors Promote SAC Activation in Sensitive SCLC Cell Lines which Requires Loss of RB1 and TP53.
a, Representative images from time-lapse fluorescent microscopy of NCI-H1048 cells expressing H2B-GFP treated with 20 nM cyclin A/B RxL inhibitor (CIRc-004) over 10 h (yellow star: arrested mitotic nuclei, purple star: normal mitotic nuclei, red star: apoptotic nuclei). Magnification = 20x, scale bar 10 µm. b, Dot plot showing time (mins) from chromosome condensation to cytokinesis completion in CIRc-004 vs vehicle treated cells. Cells that failed to complete cytokinesis by experimental end point are shown in red. n = 50 total mitotic nuclei per condition were counted from 2 independent experiments. Statistical significance was calculated using unpaired, two-tailed students t-test. c, Representative phospho-KNL1, DAPI and anti-centromere antibody (ACA) confocal microscopy images of NCI-H1048 cells treated with cyclin A/B RxL inhibitor (CIRc-004) at 20 nM or DMSO for 24 h. Magnification = 63x, scale bar = 10 µm. d-e, Dot plot measuring fluorescence intensity of phospho-KNL1 per mitotic cell (d) or number of phospho-KNL1 foci per mitotic cell (e) of NCI-H1048 cells from c n = 45 mitotic cells from 3 biological replicates. f, Immunoblot analysis of the indicated human SCLC cell lines (NCI-H1048, NCI-H446, and NCI-H69) and insensitive human NSCLC cell lines (A549, HCC4006, and NCI-H1299) treated for 24 h with CIRc-004 at 200 nM or DMSO. Note, this immunoblot contains the same lysates from Fig. 2i and is included to ensure that the differences in phospho-KNL1 levels after CIRc-004 treatment between cell lines are not a consequence of being loaded on independent immunoblots. g-h, Immunoblot analysis comparing p-KNL1 levels of insensitive NCI-H82 (g) and RPE1 (h) cell lines after treatment with CIRc-004 for 24 h. NCI-H1048 cells (a sensitive model) are included as a benchmark control. i-j, Bar graphs of significantly enriched Hallmark pathways (Padj <0.05) from RNA-seq comparing CIRc-004 vs. DMSO (i) and CIRc-005 vs. DMSO (j). For, i, j, n = 2 biological replicates. k, Representative histograms of flow cytometric analysis of PI stained RPE1 cells transduced with indicated sgRNAs targeting RB1 and TP53 (sgRB1, sgTP53) or a non-targeting control (sgCtrl) and then treated with CIRc-004 or DMSO for 72 h. n = 3 biological independent experiments. l, Immunoblot analysis of indicated RPE1 cells and NCI-H1048 treated with CIRc-004 or DMSO for 72 h. Representative immunoblot from 3 independent experiments is shown. Where indicated, *=p < 0,05, **=p < 0.01, ***=p < 0.001, ****=p < 0.0001. Source Data
Extended Data Fig. 7
Extended Data Fig. 7. Cyclin A/B RxL and CDK2 Inhibitors Act via Distinct Mechanisms.
a, Immunoblot analysis of NCI-H1048 cells treated with indicated doses of Cdk2 inhibitor (PF-07104091) for 24 h. CIRc-004 (200 nM) is included as a benchmark control. b, Representative flow cytometric analysis of EdU and DAPI in NCI-H1048 cells treated with PF-07104091 at 500 nM or DMSO (vehicle) for 24 h. c, Quantification of the EdU positive 4c population after drug treatment shown in b. Data are mean +/− SD. n = 3 biological replicates. Statistical significance calculated using unpaired, two-tailed students t-test. **=p < 0.01. d, Heat map of z-scores from RNA-seq data of NCI-H1048 cells treated with the Cdk2 inhibitor (PF-07104091 at 500 nM), cyclin A/B RxL inhibitor (CIRc-004 at 200 nM), or DMSO for 24 h. Data is sorted for Log2FoldChange of Cdk2 inhibitor (replicate 1 and 2) vs. DMSO (replicate 1 and 2) showing genes with padj<0.05 which was 110 top up-regulated and 113 down-regulated genes. n = 2 biological replicates. Relevant up-regulated genes are labelled on right. e, Bar graphs showing top significantly enriched Hallmark pathways (padj<0.05) calculated using differentially expressed genes from bulk RNA-seq experiment in d comparing Cdk2 inhibitor vs. DMSO in NCI-H1048 cells. Source Data
Extended Data Fig. 8
Extended Data Fig. 8. Mechanisms by which Cyclin A/B RxL Macrocycles Promote SAC Activation.
a, Dose response assay of NCI-H1048 cells treated with increasing concentrations (0 nM, 1.5 nM, 3 nM, 6 nM, 12 nM) of the Mps1 inhibitor (BAY-1217389). n = 2 biological replicates. Note that 3 nM of BAY-1217389 effectively blocked phosphorylation of the MPS substrate KNL1 (see Fig. 2k) without blocking cellular proliferation and hence 3 nM of BAY-1217389 was used for all rescue experiments. b, The raw cell counts of the dose response with BAY-1217389 from a showing that NCI-H1048 cells treated with BAY-1217389 at 3 nM proliferated over the 3-day dose response assay similar to the DMSO untreated control. c-f, Dose response assays of NCI-H446 (c) or NCI-H69 (e) cells, and non-linear regression curves of cleaved PARP FACS analysis of NCI-H446 (d) or NCI-H69 (f) cells treated with increasing concentrations of CIRc-004 in presence or absence of the Mps1 inhibitor (BAY-1217389) at 3 nM for 3 days. Data are mean +/− SD. Arrows in a, c-f indicates DMSO-treated sample used for normalization. g, h, Immunoblot analysis of HCT116 (g) or NCI-H1048 (h) cells stably expressing empty vector, Flag-CDC20 WT, or Flag-CDC20 R445Q mutant treated with CIRc-004 with indicated concentrations for 24 h. For a-b, d-f, n = 3 biological replicates. For c, h, n = 2 biological replicates. i, Immunoblot analysis for cyclin B pS126 in indicated SCLC lines treated with CIRc-004 (300 nM), CIRc-005 (inactive enantiomer, 300 nM), or DMSO for 4 h. n = 3 biological replicates. j-t, NCI-H1048 (j,o,p), NCI-H69 (k,l,q,r), or NCI-H446 (m,n,s,t) cells treated with RP-6306 (Myt1 inhibitor) alone (j,k,m) or in combination with the cyclin A RxL inhibitor (CIRc-018) (l, n), cyclin A/B RxL inhibitor (CIRc-004) (o,q,s), or the cyclin B RxL inhibitor (CIRc-019) (p,r,t) for 5 days. For j-t, data are mean +/− SD of two technical replicates. n = 3 biological replicates. u, Immunoblot analysis of Wee1 after cyclin B1 IP in NCI-H1048 cells treated with CIRc-004, inactive enantiomer (I.E., CIRc-005), CIRc-018, CIRc-019, or DMSO. All inhibitors were used at 300 nM for 2 h. n = 2 biological independent experiments. v-x, Dose response assay of NCI-H1048 cells treated with Wee1 inhibitor (MK 1775, 10 nM) in combination with CIRc-018 (v), CIRc-004 (w), or CIRc-019 (x) for 5 days. Data are mean +/− SD of two technical replicates. n = 2 biological replicates. Source Data
Extended Data Fig. 9
Extended Data Fig. 9. Cyclin A/B RxL Inhibitors Induce a Neomorphic Cyclin B-Cdk2 Interaction.
a, Predicted effects of cyclin B mutations identified from the base editor screen on CIRc-004 ligand binding determined by free energy perturbation (FEP) calculations (see Methods). Mutating residues at the RxL binding site, including Ile204 and Trp208 were predicted to have the most significant effect, reducing binding affinity by 1 to 3 kcal/mol relative to cyclin B WT. Mutations of Met214Val and Val227Ala/Ser228Pro mutations showed medium impact on ligand binding 0.5-0.6 kcal/mol. *The energy convergence for the Trp208Arg mutations was poor possibly due to a conformational change from the Arg where Arg’s side chain became solvent-exposed instead of being buried under the ligand. To supplement this, the Trp208Ala mutation was examined. Consistently, both Trp208Ala and Trp208Arg mutations were predicted to have a high effect on ligand binding. b, Mass spectrometry analysis after IP of endogenous Cyclin B1 in NCI-H1048 cells treated with CIRc-004 (50 nM), CIRc-005 (50 nM) (inactive enantiomer of CIRc-004, I.E) or DMSO for 2 h. Plots show the relative abundance of the indicated proteins as Intensity (MaxLFQ, 3VN 1 group, log 2 Median centred, missing values imputed). Data points indicate values obtained from n = 3 biological replicates. Bottom right panel: Ranking plot of the log10 average of the 3 groups (CIRc-004, CIRc-005, DMSO) of raw protein abundance where proteins of interest (POI) are indicated within the total dataset. c, AlphaFold2 model of cyclin B1:Cdk2 complex is shown. Amino acids 169-177 of cyclin B are highlighted in yellow showing Cdk interacting region (pink). Solid lines indicate hydrogen bonds between the two proteins with interacting amino acid residues of cyclin B indicated. d, Immunoblot analysis after IP of endogenous cyclin B1 in NCI-H1048 cells treated with CIRc-004 (300 nM), CIRc-005 (I.E), or DMSO for 2 h. Note that this is the same immunoblot from Fig. 3h but now includes the supernatant. e, Immunoblot analysis after IP of endogenous cyclin B1 in NCI-H446 cells treated with CIRc-004 (300 nM), CIRc-005 (I.E), or DMSO for 2 h. f, Immunoblot analysis after IP of endogenous cyclin B1 in NCI-H1048 cells treated with CIRc-004 (300 nM), CIRc-005 (I.E), cyclin A RxL inhibitor (CIRc-018, 300 nM), cyclin B RxL inhibitor (CIRc-019, 300 nM) or DMSO for 2 h. g, Immunoblot analysis after IP of endogenous cyclin B1 in RPE1 cells treated with CIRc-004 (2000 nM), paclitaxel (60 nM) or DMSO for 2 h. For d-h, Cdk2 band intensity is normalized to cyclin B1 shown at the bottom. h, Immunoblot analysis after IP of endogenous cyclin A in NCI-H1048 cells treated with CIRc-004 (300 nM), CIRc-005 (I.E), cyclin A RxL inhibitor (CIRc-018, 300 nM), cyclin B RxL inhibitor (CIRc-019, 300 nM) or DMSO for 2 h. Cdk2 band intensity is normalized to cyclin A shown at the bottom. i-j, Immunoblot analysis of NCI-H1048 (i) or NCI-H446 (j) cells treated cyclin A/B RxL inhibitor (CIRc-004) at 200 nM, Cdk1 inhibitor (RO-3306), Cdk2 inhibitor (PF-07104091) at the concentrations indicated or DMSO for 4 h. k, Immunoblot analysis after IP of endogenous Cdk2 in HEK-293T cells expressing CCNB1 WT-HA, CCNB1 triple mutant-(E169K/Y170H/Y177C)-HA, or a negative control vector, and treated with CIRc-004 (300 nM) or DMSO for 2 h. HA band intensity is normalized to Cdk2 shown at the bottom. For f, g, i, representative immunoblots from n = 3 biological independent experiments are shown. For d, e, h, j, k, representative immunoblots from n = 2 biological independent experiments are shown. Source Data
Extended Data Fig. 10
Extended Data Fig. 10. Cyclin A RxL Inhibition Leads to E2F Hyperactivation to Promote Sensitivity to Cyclin A/B RxL Inhibitors.
a, Representative γH2AX and DAPI confocal microscopic images of NCI-H1048 cells treated with the cyclin A/B RxL inhibitor (CIRc-004) at 20 nM or DMSO for 72 h. Magnification = 63x, scale bar = 10 µm. b, c, Immunoblot analysis for phospho-RPA2 S33 (b) and phospho-KAP1 (c) of NCI-H1048 treated with CIRc-004 at indicated concentrations for 24 h. d, Immunoblot analysis of NCI-H1048 cells infected with indicated sgRNAs and then treated CIRc-004 at 20 nM or DMSO for 72 h. e, Immunoblot analysis of histone lysates from NCI-H1048 cells treated with the selective cyclin A RxL inhibitor (CIRc-018), the selective cyclin B RxL inhibitor (CIRc-019), the cyclin A/B RxL inhibitor (CIRc-004), or DMSO (vehicle) for 72 h. f, E2F3 Immunoblot analysis after IP of endogenous cyclin A in NCI-H1048 cells treated with CIRc-004 (300 nM), CIRc-005 (inactive enantiomer of CIRc-004, I.E), cyclin A RxL inhibitor (CIRc-018) or DMSO for 2 h. E2F3 band intensity is normalized to cyclin A shown at the bottom. n = 2 biological independent experiments. g, Immunoblot analysis of NCI-H82 cells infected with a doxycycline (DOX) inducible E2F1 sgRNA-resistant cDNA and then superinfected with an sgRNA targeted endogenous E2F1 grown in the presence or absence of DOX for 24 h. h, Dose response assays of NCI-H82 cells from g grown in the presence or absence of DOX for 24 h and then treated with increasing concentrations of CIRc-004 for 6 days. Data are mean +/− SD and arrows indicates DMSO-treated sample which was used for normalization. i,k, Immunoblot analysis of NCI-H1048 (i) and Jurkat (k) cells infected with a doxycycline (DOX) inducible E2F1, E2F2 or E2F3 cDNA grown in the presence or absence of DOX for 24 h. j, l, Quantitation of average half-maximal effective concentration (EC50) without (light blue) or with (dark blue) DOX of NCI-H1048 (j) or Jurkat cells (l) from i, k expressing DOX inducible E2F1, E2F2, E2F3 treated with CIRc-004 at increasing concentrations for 3 days (j) or 6 days (l). For a-e, h, j, l, representative immunoblots from 3 independent experiments are shown. For histone blots in d, e, total histone H3 run as sample processing control on separate gel. Source Data
Extended Data Fig. 11
Extended Data Fig. 11. Pharmacokinetic and Pharmacodynamic Studies of Cyclin A/B RxL Inhibitors in SCLC Cell-Line Xenograft and Patient-Derived Xenograft Models.
a, b, Body weights of mice enrolled in the NCI-H69 (a) or NCI-H1048 (b) xenografts efficacy treatment studies treated for 14 days with vehicle, cyclin A/B RxL inhibitor (CIRc-028, 100 mg/kg IV QD). For a, n = 10 independent mice per arm. For b, n = 10 independent mice for vehicle and n = 8 independent mice for CIRc-028 arm. QD=Every day. c, Representative IHC micrographs of cell pellets from NCI-H1048 cells treated with CIRc-004 at 200 nM or DMSO (vehicle) overnight and then stained for phospho-KNL1 to validate the phospho-KNL1 antibody for IHC. Magnification=20x, scale bar = 50 µm. d, Biochemical activity of the orally bioavailable cyclin A/B RxL macrocyclic inhibitor (CIRc-014) for cyclin A1/Cdk2, cyclin E1/Cdk2 and cyclin B/CDK1 complexes measured by Fluorescence Polarization. CIRc-014 was used for in vivo efficacy studies in SCLC PDX models in Fig. 5g–n. e, Heat map of z-scores from RNA-seq data of NCI-H1048 cells treated with cyclin A/B RxL inhibitor (CIRc-004 or CIRc-014 at 200 nM), inactive enantiomer (CIRc-005 at 200 nM) or DMSO for 24 h. Data is sorted for Log2FoldChange of CIRc-004 (replicate 1 and 2) vs. DMSO (replicate 1 and 2) showing genes with Padj<0.05 which was 150 top up-regulated and down-regulated genes. Relevant up-regulated genes shown on the right. f, Bar graphs showing top significantly enriched Hallmark pathways (padj<0.05) calculated using differentially expressed genes from bulk RNA-seq experiment in e comparing CIRc-014 vs. DMSO in NCI-H1048 cell line. For e, f, n = 2 biological replicates. g, Principal component analysis (PCA) from RNA-seq data integrating RNA-seq data from DFCI-393 and DFCI-402 PDX models with 81 primary SCLC human samples from George et al. Nature 2015. Bar scale shows neuroendocrine score (see Methods). h,i, Body weights of mice enrolled in the DFCI-393 SCLC PDX (h) or DFCI-402 SCLC PDX (i) efficacy studies treated for 28 days with CIRc-014 (100 mg/kg PO TID for DFCI-393 and 100 mg/kg PO BID for DFCI-402) or vehicle. For DFCI-393 PDX in h, n = 10 independent mice for vehicle and n = 9 independent mice for CIRc-014. For DFCI-402 PDX in i, n = 10 independent mice per arm for both vehicle and CIRc-014. TID=three times a day; BID=two times a day. j, Plasma concentration of CIRc-014 from NSG mice bearing DFCI-393 PDX tumours treated with CIRc-014 100 mg/kg PO TID in the pharmacodynamic study in Fig. 5k–n. Mice were dosed for 4 days and plasma was collected at the times indicated after the last dose. Unbound concentrations (nM) at indicated time points shown on the right. Data are mean +/− SEM. n = 2 for 1-hour time point; n = 3 independent mice for 30-min, 2 and 4-hour timepoints; and n = 6 mice for 8-hour timepoint. k, l, Plasma concentration of CIRc-028 at the end of the efficacy studies where CIRc-028 was dosed 100 mg/kg IV QD for 14 days in CDX models of NCI-H69 model (k) shown in Fig. 5a or NCI-H1048 model (l) shown in Fig. 5b. Unbound concentrations (nM) at indicated time points shown on the right. Data are mean +/− SEM. For k, n = 5 mice for each time point. For l, n = 8 mice for each time point. For j, study run in NSG mice and NOD SCID % plasma protein binding (PPB) used to estimate unbound fraction. For k-l, studies run in Athymic Nude and BALB/c Nude mice, respectively, and % PPB from each strain was used to estimate unbound fraction. Plasma was collected from mice after the last dose and CIRc-014 or CIRc-028 concentrations were determined by LC-MS/MS. m, Heat map of z-scores from RNA-seq data of DFCI-393 human SCLC PDX from Fig. 5k–n treated with CIRc-014 (100 mg PO TID) or vehicle for 4 days. Values are sorted for Log2FoldChange of CIRc-014 treated tumours (n = 6 tumours from independent mice) vs. vehicle treated tumours values (n = 5 tumours from independent mice) showing genes with Padj<0.05 which was 39 differentially expressed genes. Relevant up-regulated genes shown on the right. The NCI-H1048 cell line treated with cyclin A/B RxL inhibitors (CIRc-004, CIRc-014 at 200 nM), inactive enantiomer (CIRc-005 at 200 nM), or DMSO (vehicle) as shown in Extended Data Fig. 11e is included as a benchmark control showing overlap of genes upregulated in DFCI-393 PDX tumours after CIRc-014 and NCI-H1048 cell lines treated with cyclin A/B RxL inhibitors (CIRc-004 and CIRc-014). n, Bar graphs showing top significantly enriched Hallmark pathways (padj<0.05) calculated using differentially expressed genes from bulk RNA-seq experiment in m comparing CIRc-014 treated DFCI-393 PDX tumours (n = 6 tumours from independent mice) to vehicle treated DFCI-393 PDX tumours (n = 5 tumours from independent mice). Source Data

References

    1. George, J. et al. Comprehensive genomic profiles of small cell lung cancer. Nature524, 47–53 (2015). - PMC - PubMed
    1. Kent, L. N. & Leone, G. The broken cycle: E2F dysfunction in cancer. Nat. Rev. Cancer19, 326–338 (2019). - PubMed
    1. Suski, J. M., Braun, M., Strmiska, V. & Sicinski, P. Targeting cell-cycle machinery in cancer. Cancer Cell39, 759–778 (2021). - PMC - PubMed
    1. Wu, X. & Levine, A. J. p53 and E2F-1 cooperate to mediate apoptosis. Proc. Natl Acad. Sci. USA91, 3602–3606 (1994). - PMC - PubMed
    1. Qin, X. Q., Livingston, D. M., Kaelin, W. G. Jr & Adams, P. D. Deregulated transcription factor E2F-1 expression leads to S-phase entry and p53-mediated apoptosis. Proc. Natl Acad. Sci. USA91, 10918–10922 (1994). - PMC - PubMed

MeSH terms