. 2025 Oct;646(8084):462-473.
doi: 10.1038/s41586-025-09370-8. Epub 2025 Aug 20.

Cancer-induced nerve injury promotes resistance to anti-PD-1 therapy

Erez N Baruch #  1   2 Frederico O Gleber-Netto #  3 Priyadharsini Nagarajan #  4 Xiayu Rao #  5 Shamima Akhter #  3 Tuany Eichwald #  6   7 Tongxin Xie  3 Mohammad Balood  7 Adebayo Adewale  3 Shorook Naara  3 Hinduja N Sathishkumar  3 Shajedul Islam  3 William McCarthy  3 Brandi J Mattson  8 Renata Ferrarotto  9 Michael K Wong  10 Michael A Davies  10 Sonali Jindal  11 Sreyashi Basu  11 Karine Roversi  7 Amin Reza Nikpoor  7 Maryam Ahmadi  7 Ali Ahmadi  7 Catherine Harwood  12   13 Irene Leigh  12   13 Dennis Gong  14   15   16 Paulino Tallón de Lara  1   17 Derrick L Tao  1 Tara M Davidson  1 Nadim J Ajami  2 Andrew Futreal  18 Kunal Rai  18 Veena Kochat  18 Micah Castillo  19 Preethi Gunaratne  19 Ryan P Goepfert  2 Sharia D Hernandez  20 Nikhil I Khushalani  21 Jing Wang  22 Stephanie S Watowich  23 George A Calin  17   20 Michael R Migden  24 Mona Yuan  25   26 Naijiang Liu  25   26 Yi Ye  25   26 William L Hwang  14   15 Paola D Vermeer  27 Nisha J D'Silva  28   29 Yuri L Bunimovich  30   31 Dan Yaniv  3 Jared K Burks  32 Javier Gomez  32 Patrick M Dougherty  33 Kenneth Y Tsai  34   35 James P Allison  11   23 Padmanee Sharma  11   23 Jennifer A Wargo  2   18   36 Jeffrey N Myers  3 Sebastien Talbot  37   38 Neil D Gross  39 Moran Amit  40   41   42   43
Affiliations

Cancer-induced nerve injury promotes resistance to anti-PD-1 therapy

Erez N Baruch et al. Nature. 2025 Oct.

Abstract

Perineural invasion (PNI) is a well-established factor of poor prognosis in multiple cancer types1, yet its mechanism remains unclear. Here we provide clinical and mechanistic insights into the role of PNI and cancer-induced nerve injury (CINI) in resistance to anti-PD-1 therapy. Our study demonstrates that PNI and CINI of tumour-associated nerves are associated with poor response to anti-PD-1 therapy among patients with cutaneous squamous cell carcinoma, melanoma and gastric cancer. Electron microscopy and electrical conduction analyses reveal that cancer cells degrade the nerve fibre myelin sheets. The injured neurons respond by autonomously initiating IL-6- and type I interferon-mediated inflammation to promote nerve healing and regeneration. As the tumour grows, the CINI burden increases, and its associated inflammation becomes chronic and skews the general immune tone within the tumour microenvironment into a suppressive and exhaustive state. The CINI-driven anti-PD-1 resistance can be reversed by targeting multiple steps in the CINI signalling process: denervating the tumour, conditional knockout of the transcription factor mediating the injury signal within neurons (Atf3), knockout of interferon-α receptor signalling (Ifnar1-/-) or by combining anti-PD-1 and anti-IL-6-receptor blockade. Our findings demonstrate the direct immunoregulatory roles of CINI and its therapeutic potential.


Conflict of interest statement

Competing interests: K.Y.T. serves as a consultant to NFlection Therapeutics, Sun Pharma, DXB Biosciences. R.F. reports a consulting or advisory role at Regeneron, Sanofi, Elevar Therapeutics, Remix, Eisai, Bioatlas, Coherus in the past 24 months and research Funds (Inst) from Prelude, Ayala, Merck, Pfizer, Rakuten, EMD Serono, ISA, Viracta and Gilead in the past 24 months. N.D.G. reports institutional research funding from Regeneron and Ascendis Pharmaceuticals; and advisory board and consulting fees from PDS Biotechnology, Merck, Regeneron and GeoVax; royalties from UpToDate. M.A.D. has been a consultant to Replimmune, Nurix, Roche/Genentech, Array, Pfizer, Novartis, BMS, GSK, Sanofi-Aventis, Vaccinex, Apexigen, Eisai, Iovance, Merck and ABM Therapeutics, and has been the principal investigator of research grants to MD Anderson by Roche/Genentech, GSK, Sanofi-Aventis, Merck, Myriad, Oncothyreon, Pfizer, ABM Therapeutics and LEAD Pharma. N.J.D. received a reagent from Eterna Therapeutics, unrelated to the work presented here. J.A.W. is listed as an inventor on a US patent application (PCT/US17/53.717) submitted by the University of Texas MD Anderson Cancer Center that covers methods to enhance immune checkpoint blockade responses by modulating the microbiome; she reports compensation for speaker’s bureau and honoraria from PeerView and serves as a consultant and/or advisory board member for Gustave Roussy Cancer Center, OSE Immunotherapeutics, Bayer Therapeutics, James Cancer Center OSU and Daiichi Sankyo. N.I.K. is an advisory board member for Regeneron, Merck, Replimune, Immunocore, Iovance Biotherapeutics, Novartis, IO Biotech, MyCareGorithm and HUYABIO International; received travel support from Castle Biosciences and Regeneron; is a data safety monitoring board member for Incyte and AstraZeneca; a scientific advisory board member for T-Knife Therapeutics; a study steering committee member for BMS, Nektar, Regeneron and Replimune; holds common stock in Bellicum Pharmaceuticals and Amarin; and has received research funding (to institution) from BMS, Merck, Regeneron, Replimune, GSK, Celgene, Novartis, IDEAYA Biosciences, Modulation Therapeutics and HUYABIO International. P.S. is a scientific advisory committee member for Adaptive Biotechnologies, Akoya Biosciences, Apricity, Asher Bio, BioAtla, BioNTech, Catalio, C-Reveal Therapeutics, Dragonfly Therapeutics, Earli, Enable Medicine, Glympse, Henlius/Hengenix, Hummingbird, ImaginAb, InterVenn Biosciences, JSL Health, Lytix Biopharma, Marker Therapeutics, Matrisome, NTx, Oncolytics, Osteologic, PBM Capital, Phenomic Al, Polaris Pharma, Soley Therapeutics, Sporos, Time Bioventures, Two Bear Capital, Vironexis and Xilis; holds private investments in Affini-T, Candel Therapeutics, LAVA Therapeutics, Spotlight and Trained Therapeutix Discovery. N.D.G. reports institutional research funding from Regeneron Pharmaceuticals and Ascendis Pharma; speaker honoraria from AiCME and OncLive; and is an advisory board member and received consulting fees from PDS Biotechnology, Regeneron Pharmaceuticals, Merck and GeoVax. G.A.C. is one of the scientific founders of Ithax Pharmaceuticals. C.H. declares no competing interests related to ‘A Randomized Phase II Trial of Induction Pembrolizumab Followed by Surgery Versus Surgery Alone for Resectable Cutaneous Squamous Cell Carcinoma’. M.K.W. has participated in advisory boards for Regeneron, Castle Biosciences, Replimune, Incyte and Sun Pharma. M.R.M. is a paid advisor for Feldan, Regeneron Pharmaceuticals, Replimune, Philogen, Sanofi, Stamford Pharmaceuticals and Sun Pharmaceuticals; and received research funding from Regeneron Pharmaceuticals, Replimune, Sanofi, Solgel and Senhwa. K. Rai has equity in Jivanu Therapeutics and Koshika Therapeutics. The other authors declare no competing interests.

Figures

Fig. 1
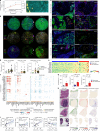
Fig. 1. Nerve injury is associated with resistance to anti-PD-1 therapy.
a, Overview of the study workflow. ECOG PS, Eastern Cooperative Oncology Group performance status; HN-cSCC, head and neck cSCC; IF, immunofluorescence; i.v., intravenous. b, Clinical characteristics of the cSCC clinical trial cohorts (Supplementary Table 7). The tumour (T), nodal (N) and metastasis (M) status is shown. c, PNI rates in the cSCC clinical trial tumour samples. Pearson’s χ2 test, P = 0.012. d,e, Representative images (d) from the cSCC clinical trial tumour samples and box plots (e) illustrating the expression levels of ATF3 and JUN in neurons (B3T+GFAP), categorized by response status (n = 6 responders, n = 7 non-responders). The box plots display the median (centre line), the 25th and 75th percentiles (box limits), and the minimum and maximum values (whiskers). Statistical analysis was performed using two-tailed Student’s t-tests assuming equal variances; P = 0.004 (B3T+ATF3+GFAP) and P = 0.55 (B3T+JUN+GFAP). f,g, Gene set enrichment analysis (GSEA) of the PNI and nerve injury signature (Supplementary Table 1) tested on pretreatment samples from our cSCC clinical trial cohort (f), and on two cohorts of patients with metastatic melanoma (ref. (left) and ref. (right)) and one cohort of patients with metastatic gastric cancer (middle) according to the anti-PD-1 response status (g). Statistical significance was determined by permutation testing (1,000 permutations), and results are reported as normalized enrichment score (NES) and nominal P value. ca., carcinoma; DE, differentially expressed; LE, leading edge; NR, non-responder; R, responder. h,i, Denervation mouse experimental design (h) and tumour growth plot (i). n = 5 (denervation + IgG), n = 4 (denervation + anti-PD-1), n = 4 (sham + IgG) and n = 5 (sham + anti-PD-1) mice. j,k, Axotomy experimental design (j) and tumour growth plot (k) of the axotomy mouse experiment. n = 6 biologically independent animals per group. For both in vivo experiments (i and k), data are mean ± s.e.m. over time; statistical analysis was performed using a mixed-effects model with restricted maximum likelihood (REML) estimation; post hoc comparisons at individual timepoints were assessed using Tukey’s multiple-comparison test. The diagrams in h and j were created using BioRender. Scale bars, 200 μm (d, columns 1 and 3) and 20 μm (d, columns 2 and 4). Source Data
Fig. 2
Fig. 2. CINI is driven by myelin degradation, followed by a neuron-driven inflammatory response.
a,b, SEM (a) and TEM (b) images of DRG nerves without (left) and with (right) SCC cells. The myelin sheath appears normal in controls (left), whereas degraded myelin is observed in the SCC group (right). c, SEM (left) and TEM (middle and right) images illustrating an SCC cell migrating along (SEM) and encasing (TEM) an axonal fibre. d, SEM image displaying an SCC cell invading a DRG axon. ad EM images showing a naive DRG neuron with normal myelin sheath (white arrowheads and yellow pseudocolour; Schwann cells, green; nerve inner layers, yellow arrowheads and purple pseudocolour) compared with the degraded myelin of DRG neurons co-cultured with SCC cells (round cells, red arrowheads). Note the abnormal mitochondria implying axonal degeneration (black arrow heads). e,f, Multielectrode array recordings from the skin of normal (n = 20) and tumour-bearing (n = 21) biologically independent mice showing mean spike amplitude (e) and absolute spike amplitude (f). Data are mean ± s.e.m. Statistical analysis was performed using one-way analysis of variance (ANOVA) followed by Tukey–Kramer post hoc test. NS, not significant. g, mIF staining of nerve injury and myelin degradation markers (dMBP) of an independent cohort of patients with cSCC (n = 32 patients, n = 86 ROIs). h, Pearson’s correlation plot based on the mIF staining described above. A linear regression line was fitted to the data using least-squares estimation. CI, confidence interval. i, Expression of ATF3 among NeuO+ DRG neurons (living neurons) after co-culture with normal keratinocytes (HEK), SCC (IC8) cells or monoculture (three biologically independent experiments, each with three independent cell cultures). The box plot shows the median (centre line), the 25th and 75th percentiles (box limits) and the minimum and maximum values (whiskers). j, Transcriptional differences in DRG neurons co-cultured with IC8 SCC cells versus monoculture controls. The heat map structured by unsupervised hierarchical clustering analysis. The top 12 most significantly enriched pathways based on Hallmark GSEA are shown. EMT, epithelial–mesenchymal transition; NF-κB, nuclear factor-κB; TGFβ, transforming growth factor-β. k, Expression of cytokines detected using the Luminex immunoassay in the supernatant of three experimental groups: monoculture of mouse TG neurons, monoculture of MOC1 mouse SCC cancer cells, and their co-culture. n = 6. Post hoc pairwise P values were calculated using the Tukey–Kramer honest significant difference test. Statistical significance was assessed using one-way ANOVA (P < 0.0001) followed by Tukey–Kramer post hoc test. ***P < 0.001, **P < 0.01, *P < 0.05. Scale bars, 200 nm (b, column 2), 600 nm (b, column 1), 1 μm (b, columns 3 and 4; c), 2 μm (d, bottom right (inset)), 5 μm (d, bottom left (main image) and top left (inset)), 10 μm (a, top), 20 μm (g), 50 μm (a, bottom left) and 100 μm (a, bottom right). Source Data
Fig. 3
Fig. 3. CINI immunosuppression and immune exhaustion extends beyond the perineural niches into the general tumour microenvironment.
a, Quantification of nerves invaded by SCC (MOC2 cells) injected into mouse whisker pads (n = 12). Nerve invasion index: number of invaded nerves/total number nerves. Data are mean ± s.e.m. mIF shows an invaded nerve (asterisk) lacking MBP, suggesting myelin degradation. CK, cytokeratin. b, mIF analysis of the whisker pad tumours collected over time. c, mIF tumours collected from treatment-naive patients with cSCC and PDAC; nerves are indicated by the dashed lines. d, Immune cell density in the perineural niche in treatment-naive PDAC samples (n = 7), based on CosMx analysis. TANs were classified as healthy (n = 11), intermediate (n = 36) and injured (n = 44). The box plots show the median (centre line), 25th and 75th percentiles (box limits) and minimum and maximum values (whiskers). Statistical analysis was performed using two-tailed Mann–Whitney exact tests. e, Heat map of nerve-injury-related proteins in the perineural niches among the patients in our anti-PD-1 cSCC trial, measured using DSP, with data transformed into z scores (Supplementary Table 8). f, Bubble heat map based on a DSP protein matrix showing the Pearson’s correlation coefficients between immune and neural proteins expressed in the perineural niches of neoadjuvant-treated tumours (patients in the anti-PD-1 cSCC trial). Statistical analysis was performed using pairwise Pearson correlation. g, mIF-based cell density according to clinical response to anti-PD-1 therapy. n = 6 responders, n = 7 non-responders. Statistical analysis was performed using two-tailed Student’s t-tests with the assumption of equal variances (pooled t-test). h, Spatial transcriptomics of tumour samples from an independent treatment-naive cohort of patients with cSCC (see the main text), assessing the co-localization of three phenotypes: CINI, immunosuppressive inflammation and antitumoural immunity (55-μm resolution per spot). i, Correlation of the immune cell density between TAN perineural niches and nerve-remote area in the TME of the SCC cohort in Fig. 2h, according to the presence of PNI. n = 32 patients, and n = 25 (PNI nerves) and n = 25 (PNI+ nerves) ROIs. A linear regression line (blue) was created based on the least-squares method; the shaded region shows the 95% CI; statistical analysis was performed using pairwise Pearson’s correlation. Scale bars, 50 μm (a), 100 μm (c, rows 2 and 4), 200 μm (c, rows 1 and 3). Source Data
Fig. 4
Fig. 4. Mitigating injury signalling inside peripheral sensory (nociceptors) neurons ameliorated intratumoural immunosuppression.
a, Uniform manifold approximation and projection (UMAP) plot of scRNA-seq data of DRG neurons innervating mouse paws that were inoculated with either B16F10-OVA melanoma or normal keratinocytes (Extended Data Fig. 9a). Clustering analysis revealed a subgroup of neurons termed cancer-injured neurons (CIN), representing 4.5% (710 neurons) of the melanoma group (total, 15,818 neurons) versus less than 0.1% (12 neurons) of the keratinocyte group (total, 17,133 neurons). KIN, keratinocyte-innervating neurons; MIN, melanoma-innervating neurons; SST neurons, somatostatin-expressing neurons; uc, unnamed cluster. b, Cancer-injured neurons were characterized by an enrichment of nerve-injury-related genes. c, Tumour growth curve comparing the tumour growth of melanomas inoculated into mice with a cre-flox conditional knockout of Atf3 in nociceptor neurons (Atf3-cKO, n = 7) versus their permissive littermate controls (NaV1.8WT::Atf3fl/fl, WT, n = 6). Data are mean ± s.e.m. Tumour growth over time (P < 0.001) was analysed using a mixed-effects model; post hoc comparisons for individual timepoints were conducted using Šídák’s multiple-comparison test (P < 0.001). d, Flow-cytometry-based assessment of IFNγ+CD8+ T cells in WT (n = 5) versus Atf3-cKO (n = 4) mice. The box plots show the median value (centre line), the 25th and 75th percentiles (box limits), and the minimum and maximum values (whiskers). Statistical analysis was performed using non-paired two-tailed Student’s t-tests. e, scRNA-seq analysis of intratumoural (melanoma) immune (CD45+) cells in Atf3-cKO versus WT mice (Extended Data Fig. 10) showing major immune cell compositions. f, Expression of Lag3 and Tox genes in CD8+ T cells from the immune scRNA-seq experiment presented in e. g, Expression of M1 macrophage markers (Il1b+Cd86+Cd80+, associated with enhanced antitumoural immune activity) in intratumoural macrophages. Statistical analysis was performed using two-tailed Wilcoxon rank-sum tests; significance was established through normal approximation. For Il1b, P = 0.006; for Cd86, P = 0.022; and for Cd80, P = 0.0003. h, Significantly enriched gene sets, based on the WikiPathways dataset among intratumoural macrophages. ORA, over-representation analysis. Source Data
Fig. 5
Fig. 5. Blocking CINI’s deleterious inflammatory signalling enhances anti-PD-1 efficacy.
a,b, Immunohistochemistry-based cell counts of intratumoural cells in the cSCC clinical trial cohort, according to the anti-PD-1 clinical response. Stain against CD8 (a); stain against the PD-1/PD-L1 axis (b). Data are mean ± s.e.m. Extended Data Fig. 1 shows sample sizes. c, GO gene set analyses of bulk tumour RNA-seq data of neoadjuvant-treated samples. MHC, major histocompatibility complex; TCR, T cell receptor. df, Nanostring nCounter PanCancer analysis of neoadjuvant-treated samples showing differentially expressed genes (d), T regulatory (Treg) cells and TGFB1 expression (e) and pathway enrichment analysis (f) according to response status. See Extended Data Fig. 1 for sample size and Supplementary Table 9 for data. The box plots show the median values (centre line), 25th and 75th percentiles (box limits), and the minimum and maximum values (whiskers); each dot corresponds to a clinical sample. The presented pathways were considered to be significantly enriched at FDR < 0.2. ESR, oestrogen receptor; FCGR, Fc gamma receptor; TF, transcription factor. gi, All three panels represent tumour growth plots for the IFNα receptor subunit 1 knockout (Ifnar1-KO, Ifnar1−/−) mouse experiment. Sample sizes were as follows: n = 10 (WT + IgG), n = 10 (WT + anti-PD-1), n = 10 (WT + EtBr + IgG), n = 12 (WT + EtBr + anti-PD-1), n = 10 (WT + anti-PD-1 + STING agonist), n = 10 (WT + EtBr + anti-PD-1 + STING agonist), n = 10 (Ifnar1−/− + IgG), n = 10 (Ifnar1−/− + anti-PD-1), n = 11 (Ifnar1−/− + EtBr + anti-PD-1) and n = 10 (Ifnar1−/− + EtBr). IgG, control antibodies for anti-PD-1. j, Ifnar1-KO experiment tumour viability plot. k, Experimental design (created using BioRender) of the IL-6R blockade (anti-IL-6R) experiment. l, Tumour growth curves of the IL-6R blockade experiment. n = 21 (PBS + IgG), n = 15 (PBS + anti-PD-1), n = 17 (PBS + anti-PD-1 + aIL6R), n = 18 (EtBr + IgG), n = 18 (EtBr + anti-PD-1) and n = 18 (EtBr + anti-PD-1 + anti-IL-6R). m, Anti-IL-6R experiment tumour viability plot. Each point represents an experimental animal. For all tumour growth curves, data are mean ± s.e.m. over time. Statistical analysis was performed using a mixed-effects model with REML estimation. Post hoc comparisons at individual timepoints were evaluated using Tukey’s multiple-comparison test. For all bar plots, data are mean ± s.e.m. Statistical significance was evaluated using one-way ANOVA (P < 0.0001) followed by the Tukey–Kramer post hoc test. Source Data
Extended Data Fig. 1
Extended Data Fig. 1. Allocation of clinical trial tumour samples.
Patient tumour samples were collected as part of two clinical trials of neo-adjuvant immunotherapy in cutaneous squamous cell carcinoma patients - NCT03565783 and NCT04154943. This figure details the number of available patients and tumour samples per each analysis reported in this manuscript. For patients who had a large neo-adjuvant-treated tumour, several samples from the same patient tumour were used to minimize a potential tumour heterogeneity bias.
Extended Data Fig. 2
Extended Data Fig. 2. Cancer-induced nerve injury (CINI) in a metastatic disease model.
Gene expression of c-Jun and Atf3 in the jugular-nodose ganglia neurons from mice with melanoma lung metastases (B16F10-OVA) was compared to PBS vehicle controls. Each dot represents an independent biological sample, with n = 3 for each group. The box plots illustrate the median (centre line), the 25th and 75th percentiles (box bounds), and the minimum and maximum values (whiskers). P-values (FDR) were calculated using the empirical Bayes quasi-likelihood F-test implemented in edgeR and were corrected for multiple hypothesis testing using the Benjamini–Hochberg method.
Extended Data Fig. 3
Extended Data Fig. 3. In vivo axotomy model.
(a) Immunohistochemistry stain against ERG, an endothelial cell marker, was conducted on tumour samples of axotomized cutaneous squamous cell carcinoma (cSCC) bearing mice (see Fig. 1). This representative ERG stain showed intact intra-tumoral vasculature (red arrowheads, see vascular lumen integrity) despite perineural inflammation (asterisks), suggesting that the tumour-associated nerve injury (nerve marked with black arrowheads) and perineural inflammation were not accompanied by vascular damage. (b) Generation of the ultraviolet (UV)-induced cutaneous squamous cell carcinoma (cSCC) murine cell lines. p53-deficient (K14Cre; Trp53R172H/flox) C57BL/6 mice (4–6 weeks old) were exposed to 7 Kilojoules/m2/S of ultraviolet B (UVB) light, 3 doses/week for 100 days. The hair on the mice’s dorsal surface was shaved twice or thrice a week before UV exposure. Skin tumours (minimum 5 mm in diameter and persistent for at least 2 weeks) started to develop 9 months after the end of the UV-exposure protocol. Each tumour was split in half. One section was formalin-fixed and paraffin-embedded (FFPE), H&E stained, and immunofluorescence (IF) staining with anti-Pan-Keratin (Type I) was performed for confirmation of cSCC diagnosis. The remaining tissue section was macro-dissected and incubated in cell culture media for 7–10 days. The cultured cells were sorted using the CD326 (EpCAM) antibody, and the resulting isolated epithelial cells were again incubated in cell culture media, IF stained with anti-Pan-Keratin (Type I) (E6S1S) antibody and DAPI to confirm their epithelial origin. The isolated malignant keratinocytes were injected intradermally (200 K cells/60ul) into C57BL/6 wild-type mice, and their tumorigenicity was recorded. The newly developed tumours were assessed using H&E staining to confirm the histopathological diagnosis of cSCC. This process resulted in five distinct UVSCC cell lines (M2, M3, M4, M5 and M6). (Created with BioRender.com) (c) The susceptibility of UV-cSCC cells to anti-PD-1 therapy was tested in vivo. The UVcSCC cells were intradermally injected into C57BL/6 mice and subsequently treated with either IgG or anti-PD-1 antibody. Among the five cell lines tested, only UVcSCC-M4 exhibited susceptibility to anti-PD-1 treatment. The data, displayed as mean ± s.e.m. over time, reflects results from multiple biologically independent animals in each group: M2 aPD1 n = 5, M2 IgG n = 5, M3 aPD1 n = 3, M3 IgG n = 4, M4 aPD1 n = 5, M4 IgG n = 5, M5 aPD1 n = 4, M5 IgG n = 5, M6 aPD1 n = 3, and M6 IgG n = 4. Statistical analysis was performed using a mixed-effects model with restricted maximum likelihood (REML) estimation, and post hoc comparisons at specific time points were conducted using Šidák’s multiple comparisons test. (d) Experiment design of the axotomy experiment in HLA matched humanized huCD34+ NSG mice. (Created with BioRender.com) (e) Tumour growth curve of the huCD34+ NSG axotomy experiment. Initially, both groups demonstrated a response to anti-PD-1 therapy (Cemiplimab, Cem). However, only sham-operated mice had a durable response (417.7 mm3 versus 105.4 mm3 in axotomized and sham-operated mice, respectively, on day 40, p-value < 0.01). Data is shown as mean ± s.e.m. over time, reflecting results from 7 biologically independent animals per group. A mixed-effects model utilizing restricted maximum likelihood (REML) estimation was used for statistical analysis. Post hoc comparisons at specific time points were conducted using Šidák’s multiple comparisons test, with an adjusted p-value of <0.001 at day 40.
Extended Data Fig. 4
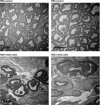
Extended Data Fig. 4. Electron microscope images demonstrating de-myelination in a model of sciatic nerve peri-neural invasion (PNI).
Representative electron microscopy (EM) images of nerves from mice who underwent micro-injection of human oral SCC cells (HSC-3) directly into the right sciatic nerve, simulating PNI, versus sham controls (PBS injection). Top row (PBS control): Nerves from sham mice show large numbers of normal-appearing myelinated axons, both large and small. The axoplasm contains scattered organelles, and the contours of the myelinated axons are circular with few or no myelin invaginations. The overall structure appears intact and unremarkable. Bottom row (HSC-3 SCC cells): Nerves from mice with PNI exhibit several pathological changes. Myelin invaginations (red asterisks) demonstrated an excessive in-folding of the myelin sheath into the axons. Intra-axonal accumulation of dark organelles is observed, often associated with a narrow myelin sheath. Myelin splitting is occasionally seen, indicating subtle segregation or splitting of the myelin layers. Some axons (yellow asterisks) show signs of dilatation with accumulated organelles and thinning of the myelin sheath, possibly reflecting compensatory changes due to axonal damage. Scale bar: 10 μm.
Extended Data Fig. 5
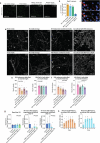
Extended Data Fig. 5. Effect of culture media exchange and cancer cell co-culture on neuron viability and activity.
(a) Representative images of RealDRG neurons (stained with NeuO) after 72 h in standard sensory neuron media (Senso-MM) followed by different treatments: no media exchange, fresh media exchange, co-culture with MOC1 squamous cell carcinoma cells, or culture in MOC1-conditioned media for an additional 72 h. Initial seeding density: 0.15 × 10⁵ cells/well in poly-l-ornithine and iMatrix-511 coated 8-well ibidi plates. (b) Bar plot showing the viability of NeuO+ neurons, normalized to the “No media change” control. Neuronal viability was reduced only in the co-culture group. Data are represented as mean ± s.e.m., based on 6 biologically independent samples for each group. (c) Neurite analysis pipeline demonstration showing the methodology for quantifying neuronal morphology. Representative multichannel fluorescence images demonstrate the automated analysis approach using the Neurite Outgrowth Module in Gen5 Cytation 7 software, with neurons identified by neurofilament heavy chain (NFH) staining and DAPI nuclear labelling. (d) Representative monochrome immunofluorescence images of neurofilament heavy chain (NFH) staining showing neuronal morphology under different experimental conditions used for neurite metric quantification. Images were acquired using an Agilent BioTek Cytation 5 cell imaging multimode reader at 20x magnification as 12 × 12 image montages from the centre of each well. Upper row: Fresh media, no media change, B16 melanoma-conditioned media, and co-culture with B16 melanoma cells. Lower row: Fresh media, no media change, MIA PaCa-2-conditioned media, and co-culture with MIA PaCa-2 cells. Scale bars = 100 μm. (e) Quantification of average neurite length showing a trending decrease in B16 melanoma co-culture conditions (left, p = 0.054) and no significant difference in MIA PaCa-2 (PDAC) co-culture (right, p = 0.606). Data represent mean ± standard deviation from a minimum of 10 regions of interest per condition. Analysis performed using automated neurite outgrowth module with short ending branches <5 μm excluded. (f) Quantification of neurite thickness (calculated as NFH+ area divided by neurite length) showing a significant decrease in both B16 melanoma (left, p = 0.006) and MIA PaCa-2 (right, p = 0.014) co-culture conditions compared to controls. Data represent mean ± standard deviation from a minimum of 10 regions of interest per condition, with duplicate wells per condition. (g) Basal spontaneous firing rate of iPSC-derived sensory neurons assessed by multi-microelectrode array (MEA). After 10 days in normal culture, mature, firing neurons were cultured for 6 days under control conditions, stressed conditions (no media exchange), in MOC1-conditioned media, or co-cultured with MOC1 cells. Spontaneous firing rates were recorded at baseline (day 10), 24 h (day 11), and 72 h (day 13) after applying experimental conditions. Data are expressed as mean ± s.e.m. derived from two biologically independent samples for each group. Statistical significance was assessed using one-way ANOVA (p = 0.678 at baseline, p = 0.241 at 24 h, p = 0.302 at 72 h). (h) Mean firing rate of iPSC-derived sensory neurons co-cultured with MIA PaCa-2 cells over 5 days, measured by MEA. RealDRGs were plated at 20 K cells/well (n = 3 biologically independent samples, left panel) and 50 K cells/well (n = 2 biologically independent samples, right panel) on 24-well CytoView MEA plates, with media changes every 48 h. After 10 days in normal culture establishing stable spontaneous activity, mature neurons were cultured for 6 days under control conditions, stressed conditions (no media exchange), in MIA PaCa-2-conditioned media, or in MIA PaCa-2 co-culture. Spontaneous functional activity was recorded for a minimum of 10 min every 24 h from day 10 through day 15. Data are presented as mean ± s.e.m.
Extended Data Fig. 6
Extended Data Fig. 6. Differentially expressed genes in neurons under different treatment and co-culture conditions.
Volcano plots showing the differentially expressed (DE) genes between (a) monoculture of human dorsal root ganglia (DRG) neurons vs. DRG neurons co-cultured with IC8 human squamous cell carcinoma (SCC) cells; see Fig. 2 for gene set enrichment analysis (b) monoculture of human DRG neurons vs. DRG neurons co-cultured with normal keratinocytes (HEK). Only eight genes were DE in the presence of normal keratinocytes. (c) mono-culture of DRG neurons vs. monoculture of DRG neurons treated with anti-PD-1. Only one gene was DE in the presence of anti-PD-1 – SCN10A, which encodes the alpha subunit of a sodium channel found in sensory nerves. (d) Monoculture of motor neurons vs. motor neurons co-cultured with IC8 SCC cells. Only four genes were DE between the conditions. Differential expression was determined with the empirical Bayes quasi-likelihood F-tests (two-sided) followed by multiple comparisons adjustment with Bonferroni correction. All experiments were done in triplicate.
Extended Data Fig. 7
Extended Data Fig. 7. Spatial protein and transcriptomic analyses of the peri-neural niches in tumour-associated nerves in our neo-adjuvant anti-PD-1 clinical trial patient cohort.
(a-c) Representative images of the nerve identification process for digital spatial profiling (DSP) analysis. Nerves were identified using NFH (yellow) and B3-tubulin (red) staining in neoadjuvant-treated tumour samples of a responder (a) and a non-responder patient (b-c); note the pan-cytokeratin (PanCK)-positive cancer cells (in pink) surrounding the nerve. The white line outlines the region of interest (ROI) analysed for protein expression. A total of 553 neural niches (84 ROI for pre-treatment samples and 469 ROI for neoadjuvant-treated) were identified and analysed. Original magnification, ×40. (d) Geometric ROI (white rectangle) showing a representative digital capture of the nerve (middle, shadowed, nerve capture panel) and the surrounding peri-neural niche, which was assessed for immune markers (right, shadowed, immune capture panel). The former was analysed for neural phenotypic markers and the latter for immune markers. (e) Box plots showing expression levels of neuro-protective marker ApoA-I in tumour-associated nerves (TANs) among pre-treatment tumour samples according to clinical response status. A higher expression among responders suggests a lower abundance of injured nerves compared to non-responders prior to anti-PD-1 therapy. Box plots display the median (centre line), the 25th and 75th percentiles (box limits), and the minimum and maximum values (whiskers). The statistical significance was determined using the Wilcoxon test, followed by the False Discovery Rate (FDR) calculation with the Benjamini and Hochberg method. (f) The box plot demonstrates the expression level of CD31, a marker of blood-nerve barrier reactivity and angiogenesis. The lack of difference in CD31 expression between responders and non-responders suggests that endothelial cells or blood vessels are not affected by CINI. Black dots represent individual samples. n = 118 perineural niches; FDR, false discovery rate.
Extended Data Fig. 8
Extended Data Fig. 8. Correlation between cancer-induced nerve injury (CINI), immuno-suppressive inflammation, and anti-tumoral immunity phenotypes by spatial transcriptomics.
Spatial transcriptomic analysis of tumour samples from an independent treatment naïve cutaneous squamous cell carcinoma patient cohort (n = 11). We examined the spatial relationships among three functional phenotypes: CINI, anti-tumoral immunity, and immunosuppressive inflammation. The anti-tumoral immunity phenotype included CD8A+GZMB+PRF1+ and CD4+IL2+ T cells, as well as CD86+IRF8+TNF+ and CD68+PSMB10+HLADQA1+HLADRA+HLADRB1+ antigen-presenting cells. The immunosuppressive inflammation phenotype comprised CD204+CD206+CD163+ and CD68+IL10+ tumour-associated macrophages, along with CD4+FOXP3+ T regulatory cells. The CINI signature included general markers for nerve detection (NEFL, NEFH, NEFM, NEUROD1, MRGPRD, TAC1, SSTR2, HAPLN4, SST) and nerve injury markers (ATF3, JUN, SOX1, SMAD1, BHLHE41, KLF7, KLF6). (a) Scatterplots show the overall correlation across the entire patient cohort. (b) Representative scatterplots showing correlations for individual patients. r, Pearson correlation coefficient.
Extended Data Fig. 9
Extended Data Fig. 9. Tumour-innervating neurons and conditional knockout of Atf3.
(a) Illustration of experimental design: B16F10-OVA melanoma cells (2 × 10⁵ cells) or non-tumorigenic keratinocytes (MPEK-BL6) were injected into the right hind paw of 8-week-old male and female mice. Fourteen days post-inoculation, the mice were euthanized, and the L3–L5 DRG neurons, which innervate the paw inoculated with tumour/keratinocytes, were harvested based on anatomy and underwent single-cell RNA sequencing (scRNA-seq). (Created with BioRender.com) (b) Neuron scRNA-seq cluster abundance bar plot – please see main text Fig. 4a for the Uniform Manifold Approximation and Projection (UMAP). (c) Neuron single-cell gene set enrichment analysis (sc-GSEA), based on the Hallmark dataset. The bubble plot shows the pairwise fold change for the top differentially enriched Hallmark pathways based on 1-way ANOVA. Bubble size represents the pairwise post hoc comparisons (Tukey test). The fold change colour scheme considered the first described group for each pairwise comparison (x-axis) as the numerator. KIN – keratinocytes-innervating neurons; MIN – melanoma-innervating neurons; CIN – Cancer-injured neurons. (d) Density heatmaps showing the distribution of scGSEA scores for inflammatory pathways across neurons in the KIN, MIN, and CIN groups. Each panel represents a distinct pathway: Hallmark Inflammatory Response, Hallmark IFN-γ Response, Hallmark IL–6–JAK–STAT3 Signalling, and Hallmark IFN-α Response. Warmer colours indicate a higher density of neurons at a given enrichment score. Notably, CIN neurons show a greater density at higher enrichment scores across all pathways. (e-f) Representative immunofluorescence images (e) and corresponding quantification (f) of ATF3 expression in L3–L5 dorsal-root-ganglion neurons innervating the melanoma-bearing paw (ipsilateral) versus the contralateral tumour-free paw (control). Tubb3 served as a pan-neuronal marker. Data are from n = 5 mice per group, and an unpaired two-tailed Student’s t-test confirmed a significant difference between groups (p = 0.005). Box-and-whisker plots display the median (centre line), interquartile range (box), and full data range (whiskers). (g) Multiplex IF staining of melanoma (S100+) tumours from mice with a cre-flox conditional knockout of Atf3 in nociceptors neurons (NaV1.8cre::Atf3fl/fl, Atf3-cKO) versus their permissive littermate controls (NaV1.8 wt::Atf3fl/fl). The stains show a similar degree of myelin degradation (dMBP+) between the two experimental groups, but lack of Atf3 expression in the neurons (S100-) of the Atf3-cKO melanoma tumours. (h) Tumour weight plot of the experiment detailed in main text Fig. 4, comparing the weight (mg) of melanoma B16F10-OVA tumours which were extracted from littermate control (Nav1.8WT::Atf3fl/fl) (n = 5) or mice whose nociceptor neurons are cKO for Atf3 (Atf3-cKO) (n = 4) (Nav1.8cre::Atf3fl/fl). The statistical significance was determined using an unpaired two-tailed t-test (p = 0.033). (i) The dot plot illustrates the expression levels and the proportion of cells expressing the canonical marker genes employed to identify the immune cell types in the single-cell RNA sequencing data.
Extended Data Fig. 10
Extended Data Fig. 10. Analysis of immune cells from B16F10-OVA melanoma bearing nociceptor neuron-specific conditional Atf3 conditional knockout (Atf3 cKO) mice and their permissive littermate controls.
(a) Gating strategy used to assess the percentage of IFNγ+CD8+ T-cells in melanoma tumours from littermate controls and Atf3-cKO animals, shown in Fig. 4. (b) Uniform Manifold Approximation and Projection (UMAP) of scRNA-seq data demonstrates the distribution of CD45+ cells from littermate controls and Atf3 cKO animals (left) and their phenotypes (right). See the main text, Fig. 4, for the abundance of each major immune subtype.

Update of

References

    1. Liebig, C., Ayala, G., Wilks, J. A., Berger, D. H. & Albo, D. Perineural invasion in cancer. Cancer115, 3379–3391 (2009). - PubMed
    1. Antonia, S. J. et al. Four-year survival with nivolumab in patients with previously treated advanced non-small-cell lung cancer: a pooled analysis. Lancet Oncol.20, 1395–1408 (2019). - PMC - PubMed
    1. Hamid, O. et al. Five-year survival outcomes for patients with advanced melanoma treated with pembrolizumab in KEYNOTE-001. Ann. Oncol.30, 582–588 (2019). - PMC - PubMed
    1. Robert, C. et al. Pembrolizumab versus ipilimumab in advanced melanoma. N. Engl. J. Med.372, 2521–2532 (2015). - PubMed
    1. Seiwert, T. Y. et al. Safety and clinical activity of pembrolizumab for treatment of recurrent or metastatic squamous cell carcinoma of the head and neck (KEYNOTE-012): an open-label, multicentre, phase 1b trial. Lancet Oncol.17, 956–965 (2016). - PubMed

MeSH terms