. 2025 Oct;646(8084):404-412.
doi: 10.1038/s41586-025-09326-y. Epub 2025 Aug 20.

SLC45A4 is a pain gene encoding a neuronal polyamine transporter

Affiliations

SLC45A4 is a pain gene encoding a neuronal polyamine transporter

Steven J Middleton et al. Nature. 2025 Oct.

Abstract

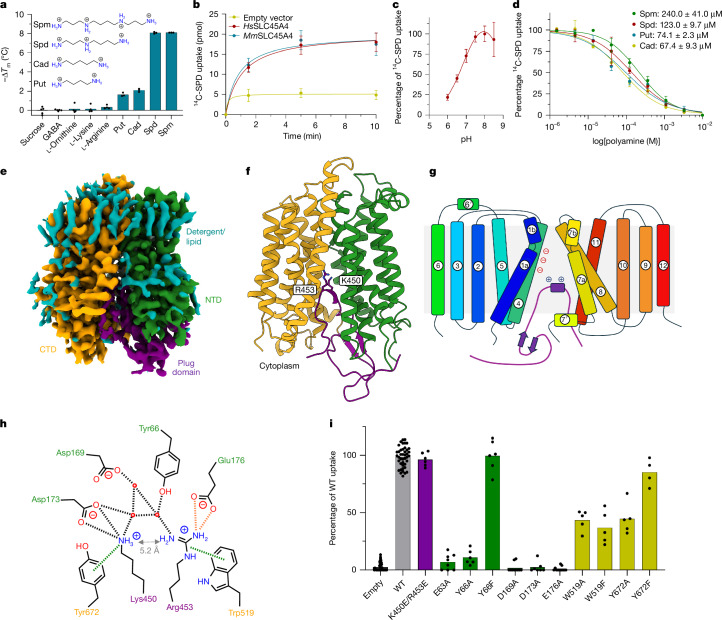
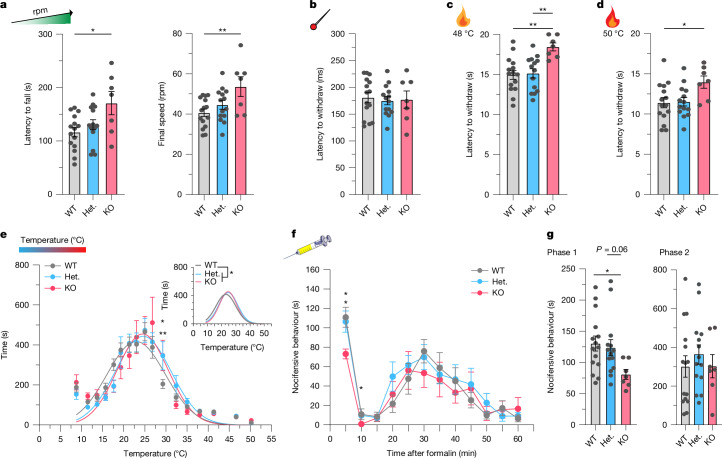
Polyamines are regulatory metabolites with key roles in transcription, translation, cell signalling and autophagy1. They are implicated in multiple neurological disorders, including stroke, epilepsy and neurodegeneration, and can regulate neuronal excitability through interactions with ion channels2. Polyamines have been linked to pain, showing altered levels in human persistent pain states and modulation of pain behaviour in animal models3. However, the systems governing polyamine transport within the nervous system remain unclear. Here, undertaking a genome-wide association study (GWAS) of chronic pain intensity in the UK Biobank (UKB), we found a significant association between pain intensity and variants mapping to the SLC45A4 gene locus. In the mouse nervous system, Slc45a4 expression is enriched in all sensory neuron subtypes within the dorsal root ganglion, including nociceptors. Cell-based assays show that SLC45A4 is a selective plasma membrane polyamine transporter, and the cryo-electron microscopy (cryo-EM) structure reveals a regulatory domain and basis for polyamine recognition. Mice lacking SLC45A4 show normal mechanosensitivity but reduced sensitivity to noxious heat- and algogen-induced tonic pain that is associated with reduced excitability of C-polymodal nociceptors. Our findings therefore establish a role for neuronal polyamine transport in pain perception and identify a target for therapeutic intervention in pain treatment.


Conflict of interest statement

Competing interests: D.L.B. has acted as a consultant for 5AM Ventures, AditumBio, AstraZeneca, Biogen, Biointervene, Combigene, GSK, Ionis, Lexicon Therapeutics, Neuvati, Novo Ventures, Olipass, Orion, Replay, SC Health Managers, Third Rock Ventures, Vida Ventures, Vertexon on behalf of Oxford University Innovation over the past two years. The PAINSTORM consortium received funding from Eli Lilly and AstraZeneca. The DOLORisk consortium received funding from Eli Lilly. J.E.L. is an employee of AstraZeneca. H.R.K. is a member of advisory boards for Altimmune and Clearmind Medicine; a consultant to Sobrera Pharmaceuticals and Altimmune; the recipient of research funding and medication supplies for an investigator-initiated study from Alkermes; a member of the American Society of Clinical Psychopharmacology’s Alcohol Clinical Trials Initiative, which was supported in the past three years by Alkermes, Dicerna, Ethypharm, Imbrium, Indivior, Kinnov, Lilly, Otsuka and Pear Therapeutics; and is listed as an inventor on US provisional patent ‘Multi-ancestry Genome-wide Association Meta-analysis of Buprenorphine Treatment Response’.

Figures

Fig. 1
Fig. 1. UKB pain intensity (most bothersome) GWAS identifies novel signals.
a, The frequency distribution of pain intensity scores among participants, measured using the numerical rating scale. Pain scores range from 0 (no pain) to 10 (worst possible pain). QC, quality control. b, In a Manhattan plot from the UKB pain intensity GWAS (n = 132,552 participants), the genome-wide significant threshold is demarcated by a horizontal red line at −log10-transformed unadjusted P = 5 × 10−8, obtained by linear regression testing for the association of the residualized phenotype and genetic markers using two-step Regenie. c, A regional plot centred on rs10625280, the principal SNV within the SLC45A4 gene, elucidates associations within this genomic region in the UKB pain intensity GWAS (n = 132,552). SNVs are differentiated by a colour gradient on the basis of their linkage disequilibrium (r2 values) with the top independent significant SNV. The top lead SNVs in genomic risk loci, lead SNVs and independent significant SNVs are distinctly marked—encircled in black and highlighted in dark purple, purple and red, respectively. SNPs, single-nucleotide polymorphisms.
Fig. 2
Fig. 2. SLC45A4 is a polyamine transporter with a plug domain.
a, Thermal destabilization of SLC45A4 in the presence of metabolites in the AOP pathway. n = 3–5 thermal stability assays. b, Time course of 14C-SPD uptake in neuronal N2 cells overexpressing either human (Homo sapiens, Hs) or mouse (Mus musculus, Mm) SLC45A4 in comparison to an empty vector control. n = 11 wells containing cells for each condition. c, Comparison of SLC45A4 activity in neuronal N2 cells under different external pH values. n = 3–4 wells containing cells per pH condition. d, Polyamine competition of 14C-SPD uptake into neuronal N2 cells. Data are the calculated mean ± s.d. half-maximal inhibitory concentration values from three independent experiments. Inset: IC50 fits; n = 5 wells containing cells per condition. e, Cryo-EM density of human SLC45A4 in LMNG/CHS detergent, contoured at a threshold level of 0.25. CTD, C-terminal domain; NTD, N-terminal domain. f, Cartoon representation of SLC45A4. The two six-TM-helix bundles of the MFS fold are coloured by domain and the plug domain, which inserts in between the two, is shown in purple. g, Topology diagram of SLC45A4, coloured blue to red from the amino terminus. h, Schematic of the interactions between Lys450 and Arg453 in the plug domain and the polyamine binding site in SLC45A4. Hydrogen bonds and salt bridges are shown as black dashed lines, cation–π bonds as green dashes and the charge interaction between Arg453 and Glu176, only observed in the nanodisc structure, as orange dashes. Residues are coloured by domain as in e and f. i, 14C-SPD uptake in neuronal N2 cells overexpressing SLC45A4 and mutants of residues shown in h. n = 4–46 wells containing cells. All data are mean ± s.d. Exact n values and details of replicates are provided in the Methods. Source data
Fig. 3
Fig. 3. Genetic ablation of Slc45a4 results in dysregulation of polyamines that does not alter nociceptor anatomy.
a, qPCR analysis of Slc45a4 mRNA along the sensory neuraxis. From left to right, sciatic nerve, DRG, spinal cord and brain; n = 4, 5, 4 and 4 mice, respectively. Norm., normalized. b, Slc45a4 mRNA is expressed in all NeuN+ mouse DRG neurons. n = 3 mice, 1,777 cells. c, Human SLC45A4–eGFP transfected into mouse sensory neurons localizes to the plasma membrane (observed in more than three independent experiments). d, Slc45a4-KO strategy using CRISPR–Cas9 deletion of exons 3–8. e, Slc45a4 mRNA is absent in Slc45a4-KO mice. f, Metabolomic analysis of polyamine (Put, Spd, Spm) levels. Compared with the WT, Spd is reduced in KO spinal cords (WT, n = 3; KO, n = 4; t-test, *P = 0.019), but elevated in KO serum (WT, n = 8; KO n = 7; Mann–Whitney U-test, *P = 0.014), and Put levels are elevated in KO DRGs (WT, n = 8; KO, n = 6; t-test, *P = 0.014). g, Sensory neuron subpopulation markers in WT and KO mice. h, Quantification of each subpopulation marker between WT and KO mice. WT: n = 4 mice, 1,073 (CGRP), 747 (IB4), 742 (NF200) and 167 (TH) cells; KO: n = 3 mice, 761 (GCRP), 524 (IB4), 402 (NF200) and 151 (TH) cells. Statistical analysis was performed using two-way analysis of variance (ANOVA) with post hoc Holm–Šidák test; P > 0.05. Scale bars 100 µm. i, Intraepidermal innervation in WT and KO mice. Scale bars, 50 µm. j, Quantification of total (PGP9.5+) and CGRP+ fibre density in glabrous (top) and hairy skin (bottom). n = 5 (WT) and n = 4 (KO) mice; 3–6 sections per mouse. Statistical analysis was performed using t-tests; P > 0.05. k, Hair follicle innervation, in particular for CGRP+ Cir-HTMRs, appears normal in Slc45a4-KO mice. Scale bars 20 µm. All data are mean ± s.e.m. Source data
Fig. 4
Fig. 4. SLC45A4 is important for motor endurance, heat sensitivity and tonic pain.
a, Slc45a4-KO mice show a longer latency to fall and a higher final speed when challenged with a rotarod that gradually increases in speed. *P = 0.013, **P = 0.0085. b, Slc45a4 heterozygous and KO mice show a normal latency to withdraw from a noxious pin prick (P > 0.05). c, Slc45a4-KO mice take longer to withdraw from a 48 °C hot plate compared with WT and heterozygous mice (**P = 0.002 and P = 0.0039, respectively; 20 s cut-off). d, Slc45a4-KO mice have an increased latency to withdraw from a 50 °C hot plate compared with WT mice (*P = 0.039; 20 s cut-off). e, Heterozygous and KO mice had a rightward shift in their thermal gradient profile, towards warmer temperatures. Statistical analysis was performed using two-way ANOVA with post hoc Holm–Šidák test; WT versus heterozygous, **P = 0.009; WT versus KO, *P = 0.027. Datapoints and nonlinear fit Gaussian curves (inset) are shown. A single curve cannot explain all datasets (extra sum-of-squares F-test, *P = 0.024). f, Slc45a4-KO mice display less nocifensive behaviours in response to a formalin injection compared with WT and heterozygous mice. Statistical analysis was performed using repeated-measures (RM) two-way ANOVA with post hoc Holm–Šidák test; 5 min: WT versus KO, *P = 0.011, heterozygous versus KO, *P = 0.027; 10 min: heterozygous versus KO, *P = 0.018. g, Slc45a4-KO mice show less nocifensive behaviours in phase 1 (0–15 min) compared with WT mice. Statistical analysis was performed using a Kruskal–Wallis test; *P = 0.02. phase 2 (15–60 min) is normal in all groups. For ag, n = 15 (WT), n = 14 (heterozygous) and n = 7 (KO) mice. For ad and g, statistical analysis was performed using one-way ANOVA with Tukey post hoc test. All data are mean ± s.e.m. The diagram of the syringe in panel f was created using Servier Medical Art (https://smart.servier.com/), licensed under a CC BY 4.0 license. Source data
Fig. 5
Fig. 5. SLC45A4 regulates the excitability of C-MHs.
a, IB4–AlexaFluor 488 (AF488) live binding and IB4 nociceptors were characterized using patch-clamp analysis. Scale bar, 10 µm. b, Excitability traces of IB4+ and IB4 neurons in response to step-current or ramp-current injections. c,d, KO IB4+ neurons show normal firing patterns to step-current (c) and ramp-current (d) injections. n = 9 (WT) and n = 10 (KO) cells. P > 0.05. AP, action potential. e,f, KO IB4 neurons fire less in response to step-current injections (e; n = 11 (WT) and n = 13 (KO) cells; from 100 to 300 pA, *P = 0.039, **P = 0.0027, ***P = 0.0002, ***P = 0.0006, *P = 0.047) and ramp-current injections (f) compared with WT neurons (from 300–1,000 ms, *P = 0.036, P = 0.021, P = 0.011, P = 0.013, P = 0.021, P = 0.015, P = 0.021 and P = 0.036, respectively). g, Hindpaw glabrous skin-nerve preparation. h, Normal mechanical thresholds of C-Ms and C-MHs from WT and KO mice. C-Ms: n = 10 (WT) and n = 10 (KO) units; C-MHs: n = 12 (WT) and n = 16 (KO) units. Statistical analysis was performed using Mann–Whitney U-tests; P > 0.05. i, WT and KO C-Ms respond similarly to suprathreshold mechanical stimuli (P > 0.05). j, C-MH fibres responding to a suprathreshold mechanical stimulus. k, KO C-MHs respond less to suprathreshold mechanical stimuli (from 35 to 402 mN, **P = 0.002, ***P = 0.0004, ***P < 0.0001, ***P < 0.0001, ***P = 0.0002, respectively). l, C-MH fibre response to heat stimulus (32–50 °C). m,n, Temperature thresholds for the first (m) and second (n) spike are increased in KO C-MHs compared with in the WT. n = 11 (WT) and n = 16 (KO) units. Statistical analysis was performed using t-tests; *P = 0.04 (first spike) and *P = 0.04 (second spike). o, The spike frequency during a 32–50 °C stimulus is reduced in KO C-MHs versus in WT C-MHs. Statistical analysis was performed using Mann–Whitney U-tests; ***P = 0.0002. For cf, i and k, statistical analysis was performed using RM two-way ANOVA with post hoc Holm–Šidák test. All data are mean ± s.e.m. Source data
Extended Data Fig. 1
Extended Data Fig. 1. Functional analysis of human SLC45A4.
a, Correlation analysis between metabolomics and expression datasets identified GABA as being positively associated with overexpression of SLC45A4 - details of the statistical analysis are described in the methods section. b, Effect of different metabolites on the thermal stability of SLC45A4 in detergent and destabilizing dose-response of SLC45A4 and two other MFS transporters (PepT2 and PepTSh) with SPD. c, Competition of 14C-SPD transport by WT HsSLC45A4 in Neuro-2A cells showed inhibition with polyamines, but no recognition of cationic amino acids or GABA (n = 4 –18 wells containing cells). d, Stringent washes on Neuro2A cells confirm the radioactive signal to originate from transport, rather than binding (n = 2–10 wells containing cells). e, SPD thermal shift assay on binding site mutants show transport-inactive mutants to still bind SPD, further supporting the signal originating from transport, n = 3–5 wells containing cells. f, Western blots confirm expression of mutants in Neuro2A cells (uncropped in source data), the blot is representative of three independently repeated experiments. g, Sequence alignment of human (Hs; Q5BKX6), mouse (Mm, Q0P5V9), rat (Rn, D4ADC6), bovine (Bt, E1BGZ7), chicken (Gg, A0A1D5NU91) and zebrafish (Dr, E9QH03) SLC45A4 sequences. Secondary structure, as observed in the cryo-EM structure of SLC45A4 and residues shown to be important to function are highlighted. Regions not resolved in the cryo-EM maps are highlighted in grey. h, Confocal microscopy shows localization of SLC45A4 (Green, αFLAG Ab) in the plasma membrane as determined by co-localization with the Na+/K+ ATPase (red). Micrographs are representative of > 3 images for each mutant. All data shows mean values, where applicable error bars are S.D, further particulars about exact n, and replicates see methods. Source data
Extended Data Fig. 2
Extended Data Fig. 2. Cryo-EM processing workflow of SLC45A4 in LMNG, including local and global resolution estimates.
a, Image processing workflow. b, Gold-standard Fourier Shell Correlation (FSC) curves for global resolution estimation. c, Local resolution estimate of the volume.
Extended Data Fig. 3
Extended Data Fig. 3. Nanodisc reconstitution, CryoEM data acquisition and processing.
a Reconstitution of HsSLC45A4, purified from HEK293F, into EBC:MSP1D1 nanodiscs. (uncropped gel in source data, the blot is representative of three independently repeated experiments). b NanoDSF scan (1st derivative) of SLC45A4 nanodiscs with and without 25 mM SPD, showing similar destabilization as observed in detergent. c Overview of data acquisition and processing of the SLC45A4 nanodisc sample, resulting in a well-resolved map with a global resolution of 3.25 Å. Density corresponding to protein is shown in rainbow, and lipid/detergent in pink. d Local resolution map. e Electron density of the transmembrane helices and plug domain loop. Source data
Extended Data Fig. 4
Extended Data Fig. 4. Structural analysis of SLC45A4.
a, Superposition of the SLC45A4 structures determined in LMNG and lipid nanodiscs. Intracellular gating helices are labelled. b, Slice through the electrostatic surface of SLC45A4 showing the location of the plug domain relative to the canonical MFS binding site. The sealed extracellular gate is indicated. c, View of the canonical MFS binding site showing the main polar interactions formed between Lys450, Ser452 and Arg453 on the plug domain with the side chains on the transmembrane helices. We have used these interactions as a proxy for polyamine recognition. Left hand panel shows the structure from the LMNG sample (grey helices), the right-hand panel the nanodisc structure (blue helices) with altered rotamer position for Arg453. d, Cryo-EM density of the SLC45A4 nanodisc structure contoured at a threshold level of 0.2 for the protein molecule (B-factor sharpened map – coloured as Fig. 2e) and 0.07 for the nanodisc (unsharpened map - grey). e, Functional analysis of the clinical N718D variant. Top panel shows Asn718 on the LMNG:CHS structure, bottom panel shows functional analysis of Asn718 mutants which showed no change in SPD transport activity in Neuro2A cells (n = 8–16 wells containing cells). f, Binding site for SPD in ATP13A2 (PDB: 7VPK) and PoTD (PDB: 1POY) respectively, showing the main polar interactions (dashed lines). All data shows mean values, further particulars about exact n, and replicates see methods. Source data
Extended Data Fig. 5
Extended Data Fig. 5. Slc45a4/SLC45A4 expression in mouse and human sensory neurons evidenced in multiple data sets.
a, Heat map of Slc45a4 mRNA expression detected using single cell sequencing of the entire mouse nervous system (high expression in blue, no expression in white). Compared across the nervous system, Slc45a4 mRNA is enriched in sensory neuron subpopulations (red bar). Data from Mousebrain.org,. b, Filtering the same data set based on a trimerization score >0.95 (increased confidence of expression), 40 regions were identified, 12 regions were identified as sensory neuron subtypes and neural crest derived. 9 out of the top 10 ten regions were sensory neuron subtypes of the DRG. c, Top: Bulk DRG RNA sequencing of different rodent species, strains and human DRG. Slc45a4/SLC45A4 mRNA was detected at high levels in across rats, mouse and human DRG. Middle: Deep sequencing of 8 mouse (mixed back ground) sensory neuron subtypes and Bottom: Deep sequencing of 5 mouse (C57BL6) sensory neurons subtypes. Both illustrate wide expression of Slc45a4 mRNA in mouse sensory neurons. d, Data from spatial transcriptomics of human dorsal root ganglia. SLC45A4 mRNA is expressed broadly in most subtypes including nociceptors and mechanoreceptors. c and d were generated from the DRG-directory (https://livedataoxford.shinyapps.io/drg-directory/). Our overall interpretation of these datasets is that Slc45a4 mRNA is enriched in DRG neurons versus CNS neuronal populations. There are some inconsistencies between datasets as to the relative expression in distinct sensory neuron subpopulations although our own analysis using in situ hybridization (below) supports the interpretation of broad expression across sensory neuron subpopulations.
Extended Data Fig. 6
Extended Data Fig. 6. Slc45a4 mRNA is broadly expressed in mouse sensory neurons.
a, Example images of RNA scope ISH of Slc45a4 mRNA and co-localization with all sensory neurons (βIII-tubulin) and sensory neuron subtype markers (CGRP, IB4, NF200, TH). b, Slc45a4 mRNA intensity vs cell profile area, line of best fit showing a positive correlation. (1,777 cells, from 3 mice). c, This data was subdivided into small medium and large cells with Slc45a4 mRNA intensity increasing with size (n = 3 mice, 1,461 small, 269 medium, 41 large cells). d, Percentage of sensory neuron subtypes that colocalise and express Slc45a4 mRNA. e, Slc45a4 mRNA intensity in each sensory neuron subpopulation with the highest signal intensity in the NF200 population, (d + e: n = 3 mice, no. cells: 144 CGRP, 273 IB4, 114 NF200, 157 TH). Scale bars 100 µm. f, Example images of RNA scope ISH of Slc45a4 mRNA in the lumbar spinal cord, all neurons (NeuroTrace), primary afferent terminals (IB4), and Slc45a4 mRNA. Scale bar 200 µm. g, Percentage of all spinal cord neurons that express Slc45a4 mRNA (n = 3 mice, 14,286 cells) h, Percentage of dorsal and ventral horn neurons that are Slc45a4 mRNA+ (n = 3 mice, dorsal 13,179 cells, ventral 5,402 cells). i, Percentage of neurons from different dorsal horn laminae that express Slc45a4 mRNA (n = 3 mice, I 749 cells, II 1,649 cells, III 1,557 cells, IV 1,384 cells, V 2,047 cells). Data mean ± s.e.m. Source data
Extended Data Fig. 7
Extended Data Fig. 7. Generation and validation of an Slc45a4 KO mouse.
a, Schematic of the Slc45a4 locus outlining the 8 exons, the start and stop sites, the CRISPR-Cas9 KO region targeted with guide RNAs (gRNA). The illustration also highlights where the genotyping and qPCR primers target and the RNAscope probe. b, Example genotyping gel of WT, HET and KO mice. PCR amplified WT band 652 bp, KO band 468 bp. This was performed once for all mice (original gel in source data). c, Images of Slc45a4 KO mice at different ages, at about 6 weeks mice develop a salt and pepper/white speckled hair. This is transient and returns to normal by week 12. d, qPCR was used to analyse the expression of Slc45a4 mRNA in WT HET and KO mice, in DRG, Spinal cord and Brain respectively. Heterozygous mice have significantly reduced Slc45a4 mRNA compared to WT, and there is a complete absence of expression in KO mice across tissues (n = 4 mice per group) e, Analysis of Slc45a4 mRNA signal intensity in DRG sections from WT, HET and KO mice (WT n = 1349 cells from 4 mice, HET n = 1452 cells from 3 mice, KO n = 951 cells from 3 mice). Threshold set using a negative control probe. d and e, one-way ANOVA with post hoc Tukey test, d, DRG **** P < 0.0001. Spinal cord * P = 0.026, ** P = 0.0018, **** P < 0.0001. Brain * P = 0.018, *** P = 0.0008, e, **** P < 0.0001). Data mean ± s.e.m. Source data
Extended Data Fig. 8
Extended Data Fig. 8. Behavioural assays that are normal in Slc45a4 HET and KO mice.
a, Example of the open field assay where mice are monitored while they explore a chamber with a grid marked into the base. Number of rears b, No. of line crossings c, distance travelled d, and max speed e, are all normal in Slc45a4 HET and KO mice. The withdrawal threshold from a von Frey stimulus f, the latency to withdraw from Hargreaves test g, the latency to withdraw from a cold stimulus (dry ice) h, and the latency to withdraw from a noxious 53 °C hotplate i, were all normal in Slc45a4 HET and KO mice. WT n = 15 mice, HET n = 14 mice, KO n = 7 mice. one way ANOVA, with Tukey post-hoc test (P > 0.05). Data mean ± s.e.m. Source data
Extended Data Fig. 9
Extended Data Fig. 9. Slc45a4 mutant mice have normal neuromuscular junctions.
a, Example images of neuromuscular junctions (NMJs) from WT, HET and KO mice. Red is α-bungarotoxin, green is synaptophysin & neurofilament. b, NJMs were analysed for each genotype, and the no. fragments, NMJ area, co-localization of α-bungarotoxin/synaptophysin & neurofilament and the co-localization of synaptophysin & neurofilament/α-bungarotoxin, were all normal. WT n = 4 mice, HET = 3 mice, KO = 3 mice, 10 NMJs were analysed per animal. one way ANOVA, with Tukey post-hoc test, P > 0.05. Data mean ± s.e.m, scale bars 40 µm. The diagram of the mouse was created using Servier Medical Art (https://smart.servier.com/), licensed under a CC BY 4.0 license. Source data
Extended Data Fig. 10
Extended Data Fig. 10. Loss of SLC45A4 reduces GABA levels in the spinal ventral horn.
a, Metabolomic analysis of GABA levels in the brain and spinal cord, there is a reduction in GABA abundance in KO spinal cord samples compared to WT (WT n = 4, KO n = 3 mice, t-test, ** P = 0.006). b, Whole-cell patch-clamp was used to characterize lamina II neurons in the spinal dorsal horn. Resting membrane potential (RMP), input resistance and rheobase, are all normal in Slc45a4 KO neurons (WT n = 25, KO = 18 cells, t-tests or Rheobase Mann Whitney test, P > 0.05). c, Inhibitory tone was assessed in lamina II neurons. Miniature inhibitory post-synaptic current (mIPSC) amplitude and frequency were normal in Slc45a4 KO neurons compared to WT neurons (WT n = 13, KO = 13 cells, Mann Whitney tests, P > 0.05). d, Analysis of GABA levels in the dorsal and ventral horn of the spinal cord. GABA levels in the dorsal horn are unchanged between genotypes, but GABA levels in the ventral horn are reduced in Slc45a4 KO neurons compared to WT neurons (WT = 5, KO = 4 mice, t-test, * P = 0.04). Data mean ± s.e.m. Source data
Extended Data Fig. 11
Extended Data Fig. 11. SLC45A4 does not regulate primary afferent conduction velocity or the mechano-sensitivity of Aδ-nociceptors or Aδ/Aβ-low threshold mechanoreceptors.
The conduction velocity, a, is normal in all Slc45a4 KO nerve fibres vs WT fibres (t-tests, P > 0.05). b, the mechanical threshold or 20 Hz vibration detection threshold (VDT) are normal in Slc45a4 KO AMs, D-hairs, rapidly adapting, and slowly adapting LTMRs (t-tests, P > 0.05). c, The stimulus-response function to increasing force is normal in Slc45a4 KO AM fibres. The stimulus-response function to moving mechanical stimuli of different velocities is normal in Slc45a4 KO D-hairs, RA-LTMRS and SA-LTMRs (RM two-way ANOVA, post hoc Holm-Sidak’s tests, P > 0.05). N numbers are as follows; CMs (WT & KO n = 10 units), CMHs (WT = 12, KO n = 16 units) AMs (WT & KO n = 9 units), D-hairs (WT n = 10, KO = 8 units), Rapidly adapting (WT n = 10, KO = 9 units), and slowly adapting (WT n = 9, KO n = 11 units) LTMRs Data mean ± s.e.m. Source data

Update of

References

    1. Sagar, N. A., Tarafdar, S., Agarwal, S., Tarafdar, A. & Sharma, S. Polyamines: functions, metabolism, and role in human disease management. Med. Sci.9, 44 (2021). - PMC - PubMed
    1. Liu, J., Yu, Z., Maimaiti, B., Meng, Q. & Meng, H. The potential role of polyamines in epilepsy and epilepsy-related pathophysiological changes. Biomolecules12, 1596 (2022). - PMC - PubMed
    1. Gewehr, C. et al. Contribution of peripheral vanilloid receptor to the nociception induced by injection of spermine in mice. Pharmacol. Biochem. Behav.99, 775–781 (2011). - PubMed
    1. Mills, S. E. E., Nicolson, K. P. & Smith, B. H. Chronic pain: a review of its epidemiology and associated factors in population-based studies. Br. J. Anaesthesia123, e273–e283 (2019). - PMC - PubMed
    1. Cohen, S. P., Vase, L. & Hooten, W. M. Chronic pain: an update on burden, best practices, and new advances. Lancet397, 2082–2097 (2021). - PubMed

MeSH terms

LinkOut - more resources