. 2025 Sep;5(9):1739-1749.
doi: 10.1038/s43587-025-00941-y. Epub 2025 Aug 20.

Induced somatic mutation accumulation during skeletal muscle regeneration reduces muscle strength

Affiliations

Induced somatic mutation accumulation during skeletal muscle regeneration reduces muscle strength

Peter Vrtačnik et al. Nat Aging. 2025 Sep.

Abstract

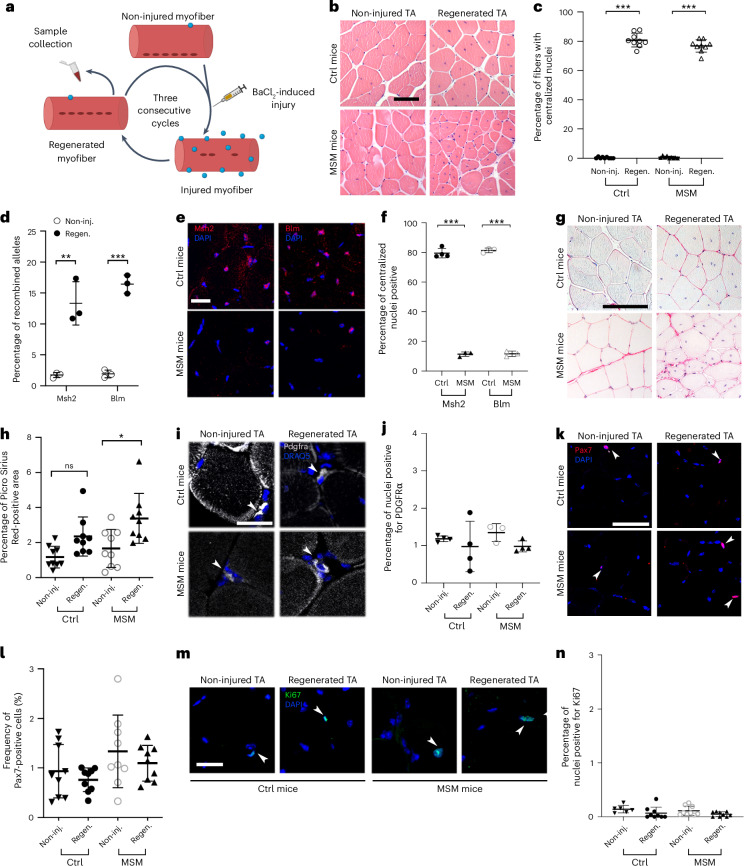
Aging is associated with a progressive decline in tissue function and regenerative capacity, partly due to genomic instability, one of the hallmarks of aging1,2. Genomic instability encompasses DNA damage and the accumulation of somatic mutations in post-zygotic cells, yet the specific impact of these mutations on age-related tissue dysfunction remains poorly understood. To address this, we developed a mouse model in which genomic instability was induced specifically in muscle progenitor cells3 through targeted deletion of the Msh2 (ref. 4) and Blm5 genes. This allowed us to assess how elevated DNA damage and somatic mutations, from single-nucleotide variants (SNVs) to structural variants, affect muscle regeneration following injury. These mice exhibited impaired muscle regeneration, characterized by smaller muscle fibers, reduced muscle mass gain and decreased grip strength. Importantly, similar muscle deficits were observed in a second mouse model where somatic mutations were elevated with less substantial DNA damage. These findings provide evidence that the accumulation of somatic mutations can potentially compromise the function of somatic cells, contributing to the aging phenotype in skeletal muscle.


Conflict of interest statement

Competing interests: The authors declare no competing interests.

Figures

Fig. 1
Fig. 1. Characterization of regeneration in control and MSM mice.
a, Schematic representation of the experimental setup. Created in BioRender. Eriksson. M (2025). https://BioRender.com/qb882vw. b, Hematoxylin-eosin TA staining after three regeneration cycles. The right TA is regenerated muscle, and the uninjured left TA is the control (Ctrl). c, Quantification of fibers with centralized nuclei in non-injured and regenerated TA (control n = 9, MSM n = 9); Ctrl-non-inj. vs Ctrl-Regen. P = 1 ×10⁻¹³; MSM-non-inj. vs MSM-Regen. P = 1 ×10⁻¹³. d, Msh2 and Blm allele recombination quantification in non-injured and regenerated TA of MSM mice (non-injured n = 3, regenerated n = 3); Msh2 recombination: non-inj. vs Regen. P = 0.0047; Blm recombination: non-inj. vs Regen P = 9.89 ×10⁻⁵. e, Msh2 and Blm immunofluorescence of non-injured and regenerated TA. f, Quantification of Msh2-positive nuclei in non-injured and regenerated TA (control n = 4, MSM n = 3) and Blm-positive nuclei in non-injured and regenerated TA (Control n = 3, MSM n = 3); Msh2 expression: Ctrl vs MSM P = 8.07×10⁻¹⁰; Blm expression: Ctrl vs MSM P = 9.13 × 10¹⁰. g, Picro Sirius Red staining of non-injured and regenerated TA. h, Quantification of Picro Sirius Red-stained muscle in non-injured and regenerated TA (Control n = 9, MSM n = 9); Ctrl-Non-inj. vs Ctrl-Regen. P = 0.1269; MSM-non-inj. vs MSM-Regen. P = 0.0120. i, Pdgfrα immunofluorescence of non-injured and regenerated TA. j, Quantification of Pdgfrα-positive cells in non-injured and regenerated TA of control mice (Non-injured TA n = 4, regenerated TA n = 4) and MSM mice (Non-injured TA n = 3, regenerated TA n = 4) Ctrl-Non-inj. vs Ctrl-Regen. P = 0.8625; MSM-non-inj. vs MSM-Regen. P = 0.5965. k, Pax7 immunofluorescence of non-injured and regenerated TA. l, Quantification of Pax7-positive nuclei in non-injured and regenerated TA (Control n = 9, MSM n = 9); Ctrl-Non-inj. vs Ctrl-Regen. P = 0.8868; MSM-non-inj. vs MSM-Regen. P = 0.7465. m, Ki67 immunofluorescence of non-injured and regenerated TA. n, Quantification of Ki67 positive nuclei (Control-non-inj n = 6, Control-regen n = 9, MSM-non-inj n = 9, MSM-regen n = 9); Ctrl-Non-inj. vs Ctrl-Regen. P = 0.3449; MSM-non-inj. vs MSM-Regen. P = 0.3900. Panels b and g scale bars indicate 100 μm; panels e, i, k and m scale bars indicate 20 μm. Statistical tests used in c, f, h, j, l and n were one-way analysis of variance (ANOVA) with Tukey multiple comparison test (d, unpaired t-test, two tailed). * P < 0.05; ** P < 0.01; *** P < 0.001. Graphs in c, d, f, h, j, l and n present data as mean ± standard deviation (s.d.). Arrowheads in i, k and m indicate positive nuclei/cells. Source data
Fig. 2
Fig. 2. Increased number of detected somatic mutations and DNA DSBs in regenerated skeletal muscle of MSM/Msh2-def mice.
a, Barplot of the number of somatic single-nucleotide variants (SNVs) in by WGS of representative histological samples of regenerated TA from control, MSM and Msh2-deficient mice. The measurement was performed on downsampled data (n = 3). b, 53BP1 immunofluorescence of regenerated TA. Arrows indicate 53BP1-positive nuclei that are enlarged in the below pictures. Transmitted detection was used to visualize myogenic fibers. c, Quantification of 53BP1-positive cells in regenerated TA (Control n = 9, MSM n = 9, Msh2-def. n = 3); Control vs MSM P = 0.0039, Control vs Msh2-def. P = 0.6368. d, Quantification of 53BP1-positive centralized myonuclei in regenerated TA (Control n = 9, MSM n = 9, Msh2-def. n = 3); Control vs MSM P = 0.0001, Control vs Msh2-def. P = 0.1845. e, Phospho-RPA32 (phospho S4 + S8) immunofluorescence of regenerated TA. Arrowheads indicate one phospho-RPA32 (phospho S4 + S8)-positive and one negative nuclei that are enlarged in the below pictures. Transmitted detection was used to visualize myogenic fibers. f, Quantification of phospho-RPA32 (phospho S4 + S8)-positive nuclei in regenerated TA (Control n = 4, MSM n = 4, Msh2-def. n = 3); Control vs MSM P = 0.0131, MSM vs Msh2-def. P = 0.0061. g, Quantification of phospho-RPA32 (phospho S4 + S8)-positive centralized myonuclei in regenerated TA (Control n = 4, MSM n = 4, Msh2-def. n = 3); Control vs MSM P = 0.0187, MSM vs Msh2-def. P = 0.0087. Panel b scale bar indicates 100 μm; panel e scale bar indicates 20 μm. Statistical tests used in c, d, f and g: one-way ANOVA with Tukey multiple comparison test. * P < 0.05; ** P < 0.01; *** P < 0.001. Graph a presents a single representative value for each group. Graphs in c, d, f and g present data as mean ± s.d. Source data
Fig. 3
Fig. 3. Somatic variants and corresponding genes related to muscle regeneration.
a, Graphic representation of the genomic distribution of somatic variants identified from non-downsampled control, Msh2-deficient and MSM mice. b, Distribution of alternate allele frequency of 13 somatic variants on exons of protein coding gene. The central line of the boxplot represents the mean value of the data. The edges of the box correspond to the 25th (Q1) and 75th percentile (Q3). The whiskers extend to the most extreme data points within 1.5 times the interquartile range from the lower and upper quartiles, and points beyond whiskers are outliers. c, Cell types derived by reanalyzing single-cell transcriptome dataset of regenerating muscle of an injured mice from the study published by De Micheli et al.42 d, Distribution of cells from non-injured (Day 0) and days post-injury (Day 2, Day 5 and Day 7) in individual clusters obtained from single-cell transcriptome analysis. e, Expression of protein coding genes associated with somatic variants visualized using UMAP (uniform manifold approximation and projection). f, Expression of protein coding genes associated with somatic variants from control, Msh2-deficient and MSM myogenic cells. The circle size represents percentage of cells in which corresponding gene is expressed and the color gradient represents average expression level in individual clusters or corresponding cell types. NK, natural killer. Source data
Fig. 4
Fig. 4. Impaired regeneration and reduced muscle function in MSM mice.
a, p16 immunohistochemical staining of regenerated TA. Arrowheads indicate examples of p16-positive nuclei. b, Quantification of p16-positive cells in regenerated TA (Control n = 9, MSM n = 9, Msh2-def. n = 3); Control vs MSM P = 0.1616, Control vs Msh2-def. P = 0.6654. c, Quantification of p16-positive centralized nuclei in regenerated TA (Control n = 9, MSM n = 9, Msh2-def. n = 3); Control vs MSM P = 0.0122, Control vs Msh2-def. P = 0.9907. d, Graphs displaying the size distribution of regenerated fibers across the different groups. Curves illustrate the Gaussian distribution of fiber sizes. Arrows show the shift towards smaller fibers in MSM and Msh2-deficient mice (Control n = 9, MSM n = 9, Msh2-def. n = 3). e, Graph showing the average cross-sectional area of regenerated fibers (Control n = 9, MSM n = 9, Msh2-def. n = 3); Control vs MSM P = 0.04606, Control vs Msh2-def. P = 0.0277. f, Graph showing the difference in TA weight gain due to hypertrophy (Control n = 9, MSM n = 9, Msh2-def. n = 3); Control vs MSM P = 0.0244, Control vs Msh2-def. P = 0.0959. g, Graph showing the fold change of normalized grip strength (Control n = 9, MSM n = 9, Msh2-def. n = 3); Control vs MSM P = 0.0024, Control vs Msh2-def. P = 0.0250. Panel a scale bar indicates 100 μm; panel d scale bar indicates 20 μm. Statistical tests used in b, c, e, f and g: one-way ANOVA with Tukey multiple comparison test. * P < 0.05; ** P < 0.01; *** P < 0.001 Graphs in b, c, e, f, and g present data as mean ± s.d. Graph d presents data only as mean for clearer presentation. Source data
Extended Data Fig. 1
Extended Data Fig. 1. Characterization of regeneration in Msh2-deficient TA.
(a) Hematoxylin-eosin staining of non-injured and regenerated TA after 3 cycles of injury and regeneration. (b) Quantification of fibers with centralized nuclei in non-injured and regenerated TA (Control n = 9, Msh2-def. n = 3); Ctrl-non-inj. vs Ctrl-Regen. P = 2.3e-14; Msh2-def. non-inj. vs Msh2-def. Regen. P = 2.8e-14. (c) Quantification of Msh2/Blm recombination in regenerated TA after 3 regeneration cycles (n = 3; P = 0.0005). (d) Msh2 immunofluorescence of regenerated TA. (e) Quantification of Msh2-positive centralized nuclei in regenerated TA (Control n = 4, Msh2-def. n = 3); Control vs Msh2-def P = 5.8e-07. (f) Picro Sirius Red staining of non-injured and regenerated TA after 3 regeneration cycles. (g) Quantification of Picro Sirius Red-stained muscle in non-injured and regenerated TA (Control n = 9, Msh2-def. n = 3); Ctrl-Non-inj. vs Ctrl-Regen. P = 0.0311; Msh2-def. non-inj. vs Msh2-def. Regen. P = 0.4906. (h) Pdgfrα immunofluorescence of non-injured and regenerated TA. (i) Quantification of Pdgfrα-positive cells in non-injured and regenerated TA after 3 cycles of regeneration (Control n = 4, Msh2-def. n = 3); Ctrl-Non-inj. vs Ctrl-Regen. P = 0.8669; Msh2-def. non-inj. vs Msh2-def. Regen. P = 0.7195. (j) Pax7 immunofluorescence of non-injured and regenerated TA. (k) Quantification of Pax7-positive cells in non-injured and regenerated TA after 3 regeneration cycles (Control n = 9, Msh2-def. n = 3); Ctrl-Non-inj. vs Ctrl-Regen. P = 0.7764; Msh2-def. non-inj. vs Msh2-def. Regen. P = 0.9846. (l) Ki67 immunofluorescence of non-injured and regenerated TA. (m) Quantification of Ki67 positive cells in non-injured and regenerated TA after 3 cycles of injury and regeneration (Control-non-inj n = 6, Control-regen n = 9, Msh2-def-non-inj n = 3, Msh2-def-regen n = 3) Ctrl-Non-inj. vs Ctrl-Regen. P = 0.4816; Msh2-def. non-inj. vs Msh2-def. Regen. P = 0.9924. Panels a and f scale bars indicate 100 μm; panels d, h, j and l scale bars indicate 20 μm. Statistical test: c and e: unpaired t-test two tailed; b, g, i, k and m: one-way ANOVA with Tukey multiple comparison test. Graphs b, c, e, g, i, k, and m present data as mean ± SD. Note: for panels a, b, dm the control images and control quantifications correspond to those in Fig. 1b, c, e–m. h, j, l Arrows indicate positive nuclei/cells. Source data
Extended Data Fig. 2
Extended Data Fig. 2. MSM mice accumulate more SVs than control and Msh2-deficient mice.
Quantification of somatic structural variants (SVs) in skeletal muscle cells by WGS of representative histological samples of regenerated TA from control, MSM and Msh2-deficient mice. Analysis was performed both on downsampled data (a) and non-downsampled data (b). BND = interchromosomal translocation, DEL = deletion, INV = inversion. Source data
Extended Data Fig. 3
Extended Data Fig. 3. Somatic variants and corresponding genes related to muscle regeneration.
(a) Pcm1 immunofluorescence of regenerated TA. (b) Quantification of Pcm1-positive nuclei in regenerated TA (Control n = 3, MSM n = 4, Msh2-def. n = 3); Control vs MSM P = 0.5898, Control vs Msh2-def. P = 0.5022. (c) Expression of protein coding genes associated with somatic variants visualized in uninjured (Day 0) and post-days of injury (Day 2, 5, and 7) using UMAP (Uniform Manifold Approximation and Projection). (d) Boxplots with expression levels of protein coding genes associated with exonic somatic variants in Day 0, Day 5, and Day 7 in muscle associated cell types. The central line of the boxplots represents the mean value of the data. The edges of the boxes correspond to the 25th (Q1) and 75th percentile (Q3). The whiskers extend to the most extreme data points within 1.5 times the interquartile range from the lower and upper quartiles, and points beyond whiskers are outliers. P-values were determined using the Wilcoxon test and are denoted by *<0.05, **<0.01, ***<0.001, **** <0.0001, ns is non-significant and the p-values are adjusted for multiple testing correction by Benjamini Hochberg method Panel a scale bar indicates 20 μm. Panel b was analyzed with one-way ANOVA with Tukey multiple comparison test. Graph b presents data as mean ± SD. Source data
Extended Data Fig. 4
Extended Data Fig. 4. Measurement of muscle fiber atrophy.
(a) Lamin B1 immunofluorescence of regenerated TA. Arrows indicate Lamin B1-positive and negative nuclei that are enlarged in the side pictures. Transmitted detection was used to visualize myogenic fibers. (b) Quantification of Lamin B1-positive centralized myonuclei in regenerated TA (Control n = 4, MSM n = 9, Msh2-def. n = 3); Control vs MSM P = 0.6948, Control vs Msh2-def. P = 0.2721. Panel a scale bar indicates 20 μm. Statistical test: b: one-way ANOVA with Tukey multiple comparison test. Graphs b presents data as mean ± SD. Source data
Extended Data Fig. 5
Extended Data Fig. 5. No abnormal myofiber sizes in non-injured TA from MSM and Msh2-deficient mice.
(a) Graphs displaying the size distribution of fibers across the different groups after 3 regeneration cycles in the contralateral non-injured TA. Curves illustrate the Gaussian distribution of fiber sizes. Double arrows show no shift in fiber size in MSM and Msh2-deficient mice compared to controls (Control n = 9, MSM n = 9, Msh2-def. n = 3). (b) Graph showing average cross-sectional area of fibers after 3 regeneration cycles regeneration in the contralateral non-injured TA (Control n = 9, MSM n = 9, Msh2-def. n = 3); Control vs MSM P = 0.9844, Control vs Msh2-def. P = 9665. (c) Graph showing the fold change of normalized grip strength after every cycle of injury/regeneration in control, MSM and Msh2-deficient mice (Control n = 9, MSM n = 9, Msh2-def. n = 3); Control vs MSM P = 0.0048, Control vs Msh2-def. P = 0.0030. (d) Hematoxylin and eosin staining of non-injured right TA obtained from non-injured mice. (e) Quantification of centralized nuclei from non-injured right TA obtained from non-injured mice (Control n = 3, MSM n = 3, Msh2-def. n = 3); Control vs MSM P = 0.2104, Control vs Msh2-def. P = 0.1842. (f) Picro Sirius Red staining of non-injured right TA. (g) Quantification Picro Sirius Red-stained muscle connective tissue from non-injured right TA obtained from non-injured mice (Control n = 3, MSM n = 3, Msh2-def. n = 3); Control vs MSM P = 0.3673, Control vs Msh2-def. P = 0.9907. (h) Pax7 immunofluorescence of right non-injured TA obtained from non-injured mice. (i) Quantification of Pax7-positive cells in right non-injured TA obtained from non-injured mice (Control n = 3, MSM n = 3, Msh2-def. n = 3), Control vs MSM P = 0.1105; Control vs Msh2-def. P = 0.4106. (j) Graph showing the fold change of normalized grip strength in uninjured mice after 3 cycles of injury and regeneration in non-injured (Control n = 3, MSM n = 9, Msh2-def. n = 3); Control vs MSM P = 0.3580, Control vs Msh2-def. P = 0.7917. Statistical test: b, e, g, i, j: one-way ANOVA with Tukey multiple comparison test; C: two-way ANOVA with Tukey multiple comparison test. Graph a presents data only as mean without SD for clearer presentation. Graphs b, c, e, g, i, j present data as mean ± SD. Panels d and f scale bars indicate 100 μm; panel H scale bar indicates 20 μm. Source data

References

    1. López-Otín, C., Blasco, M. A., Partridge, L., Serrano, M. & Kroemer, G. Hallmarks of aging: an expanding universe. Cell186, 243–278 (2023). - PubMed
    1. Vijg, J. & Dong, X. Pathogenic Mechanisms of Somatic Mutation and Genome Mosaicism in Aging. Cell182, 12–23 (2020). - PMC - PubMed
    1. Murphy, M. M., Lawson, J. A., Mathew, S. J., Hutcheson, D. A. & Kardon, G. Satellite cells, connective tissue fibroblasts and their interactions are crucial for muscle regeneration. Dev. Camb. Engl.138, 3625–3637 (2011). - PMC - PubMed
    1. Kucherlapati, M. H. et al. An Msh2 conditional knockout mouse for studying intestinal cancer and testing anticancer agents. Gastroenterology138, 993–1002.e1 (2010). - PMC - PubMed
    1. Chester, N., Babbe, H., Pinkas, J., Manning, C. & Leder, P. Mutation of the murine Bloom’s syndrome gene produces global genome destabilization. Mol. Cell. Biol.26, 6713–6726 (2006). - PMC - PubMed

LinkOut - more resources