Correlation between gut microbiota and metabolomics under intermittent hypoxic conditions
- PMID: 40836215
- PMCID: PMC12366097
- DOI: 10.1186/s12866-025-04220-z
Correlation between gut microbiota and metabolomics under intermittent hypoxic conditions
Abstract
Objective: This study investigates the role of gut microbiota and metabolites as biomarkers in the diagnosis and assessment of Obstructive Sleep Apnea (OSA) by analyzing the correlation between microbiota and metabolomics in the host's gut under conditions of chronic intermittent hypoxia (CIH).
Methods: We analyzed the composition and function of gut microorganisms and metabolites in OSA and CIH mouse models using 16S rRNA sequencing combined with targeted metabolomics to evaluate the association between clinical indicators and severity of OSA and gut flora and metabolites.
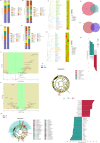
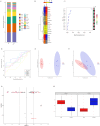
Results: Compared with normal controls, we found: (1) The apnea hypoventilation index (AHI) and fasting blood glucose were higher in the moderate and severe OSA groups, the eosinophilia score (EP) and neutrophil percentage were significantly higher in the severe OSA group, and the percentage of lymphocytes in the blood count and platelet pressures were lower in the moderate group (P < 0.05).(2) The OSA and CIH groups showed an increase in the abundance of Firmicutes and Tenotrophomonas, and a decrease in the abundance of Bacteroidota and Ligilactobacillus (P < 0.05).(3) The OSA and CIH groups had elevated Nervonic acid and Erucic acid and decreased Arachidonic acid (P < 0.05). In addition, correlation analysis showed that: There was a negative correlation between Coprobacillus and percentage of lymphocytes, and Bacteroidota and EP and AHI;and a positive correlation between Lactococcus and Neutrophils, Arachidonic acid and width of erythrocyte distribution, and Erucic and Neuronic acids and AHI (P < 0.05).
Conclusion: The CIH condition can lead to microbial and metabolite alterations, which correlate with disease severity and clinical indicators, and is expected to be a new biomarker for the diagnosis and assessment of severity of OSA.
Keywords: Biomarkers; Chronic Intermittent Hypoxia; Disease Evaluation; Gut microbiota; Targeted metabolomics.
© 2025. The Author(s).
Conflict of interest statement
Declarations. Ethics approval and consent to participate: The study protocol was approved by the Ethics Committee of Guizhou Provincial People's Hospital [2024–123] and the Experimental Animal Ethics Committee of Guizhou Medical University [2403650],and all subjects signed an informed consent form. This study is in line with the provisions of the Declaration of Helsinki.The authors declare that this study was conducted without any commercial or financial relationships that could be perceived as a potential conflict of interest. Consent for publication: Not applicable. Competing interests: The authors declare no competing interests.
Figures


Similar articles
-
Changes in the gut microbiota and derived fecal metabolites may play a role in tacrolimus-induced diabetes in mice.Future Microbiol. 2025 Feb;20(3):237-246. doi: 10.1080/17460913.2024.2444761. Epub 2024 Dec 22. Future Microbiol. 2025. PMID: 39711145
-
Role of NLRP3 in the metabolism of bile acids and gut microbiota in CCl4-induced liver fibrosis.Microbiol Spectr. 2025 Sep 2;13(9):e0014825. doi: 10.1128/spectrum.00148-25. Epub 2025 Jul 21. Microbiol Spectr. 2025. PMID: 40689656 Free PMC article.
-
Microbiome and metabolome patterns after lung transplantation reflect underlying disease and chronic lung allograft dysfunction.Microbiome. 2024 Oct 9;12(1):196. doi: 10.1186/s40168-024-01893-y. Microbiome. 2024. PMID: 39385282 Free PMC article.
-
Effects of opioid, hypnotic and sedating medications on sleep-disordered breathing in adults with obstructive sleep apnoea.Cochrane Database Syst Rev. 2015 Jul 14;(7):CD011090. doi: 10.1002/14651858.CD011090.pub2. Cochrane Database Syst Rev. 2015. PMID: 26171909
-
Drug therapy for obstructive sleep apnoea in adults.Cochrane Database Syst Rev. 2013 May 31;2013(5):CD003002. doi: 10.1002/14651858.CD003002.pub3. Cochrane Database Syst Rev. 2013. PMID: 23728641 Free PMC article.
References
-
- Veasey SC, Rosen IM.Obstructive Sleep Apnea in Adults. New Engl J Med. 2019:1442–1449.10.1056/NEJMcp1816152. - PubMed
-
- Pugliese G, Barrea L, Laudisio D, et al. Sleep Apnea, Obesity, and Disturbed Glucose Homeostasis: Epidemiologic Evidence, Biologic Insights, and Therapeutic Strategies. Curr Obes Rep. 2020:30–38. 10.1007/s13679-020-00369-y. - PubMed
-
- Roche J, Rae DE, Redman KN, et al. Impact of obstructive sleep apnea on cardiometabolic health in a random sample of older adults in rural South Africa: building the case for the treatment of sleep disorders in underresourced settings. J Clin Sleep Med. 2021:1423-1434. 10.5664/jcsm.9214. - PMC - PubMed
MeSH terms
Substances
Grants and funding
LinkOut - more resources
Full Text Sources

