. 2025 Aug 20;27(1):33.
doi: 10.1186/s12575-025-00293-2.

Refining Flow Cytometry-based Sorting of Plasma-derived Extracellular Vesicles

Affiliations

Refining Flow Cytometry-based Sorting of Plasma-derived Extracellular Vesicles

Daniele Reverberi et al. Biol Proced Online. .

Abstract

Background: Extracellular vesicles (EVs) are membrane-bound particles crucial for intercellular communication and serve as promising biomarkers for diseases, including cancer. Isolating and characterizing specific EV subpopulations, particularly those in plasma/serum, enhances biomarker precision and supports targeted therapies. Cancer-derived EVs often express unique surface markers, enabling distinction from other EVs. Accurate sorting of tumor-associated EVs provides insights into cancer progression, metastasis, and treatment response.

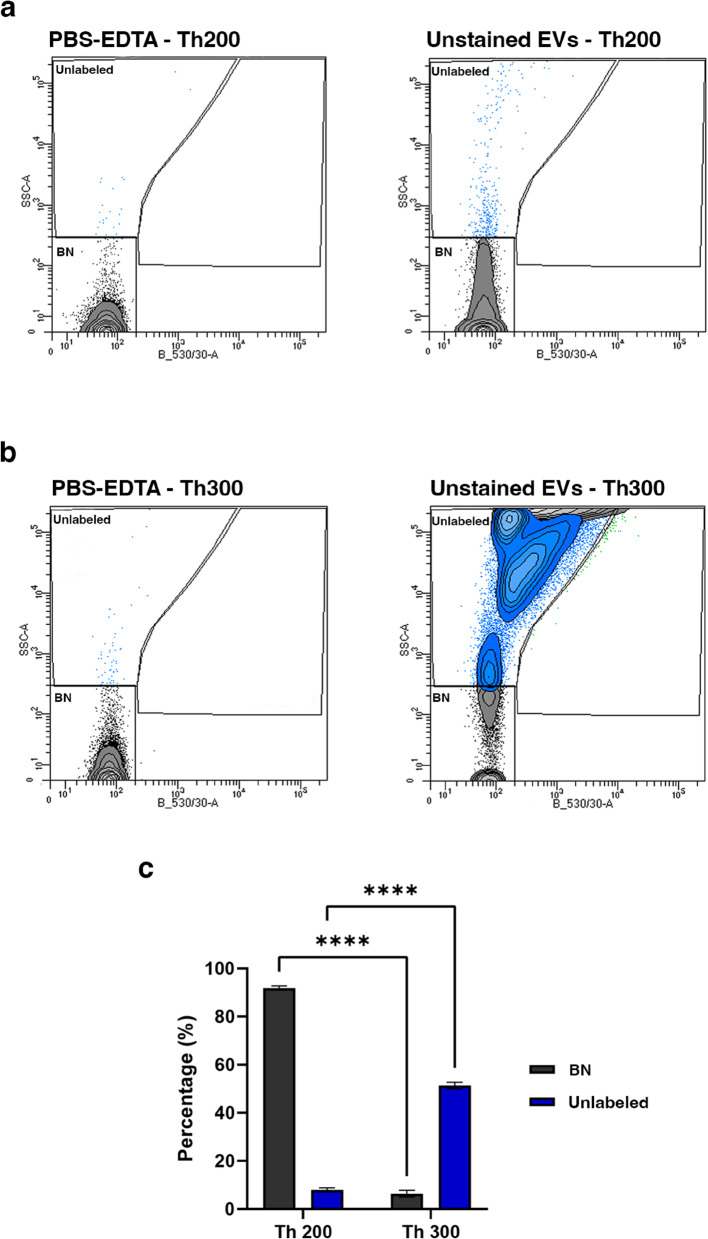
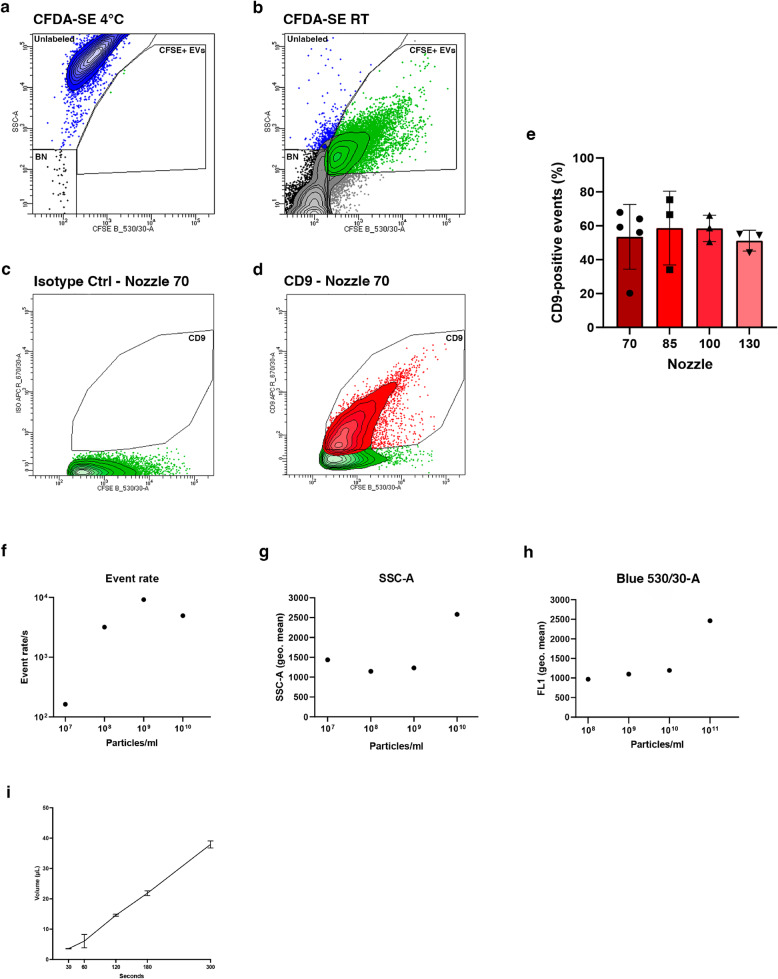
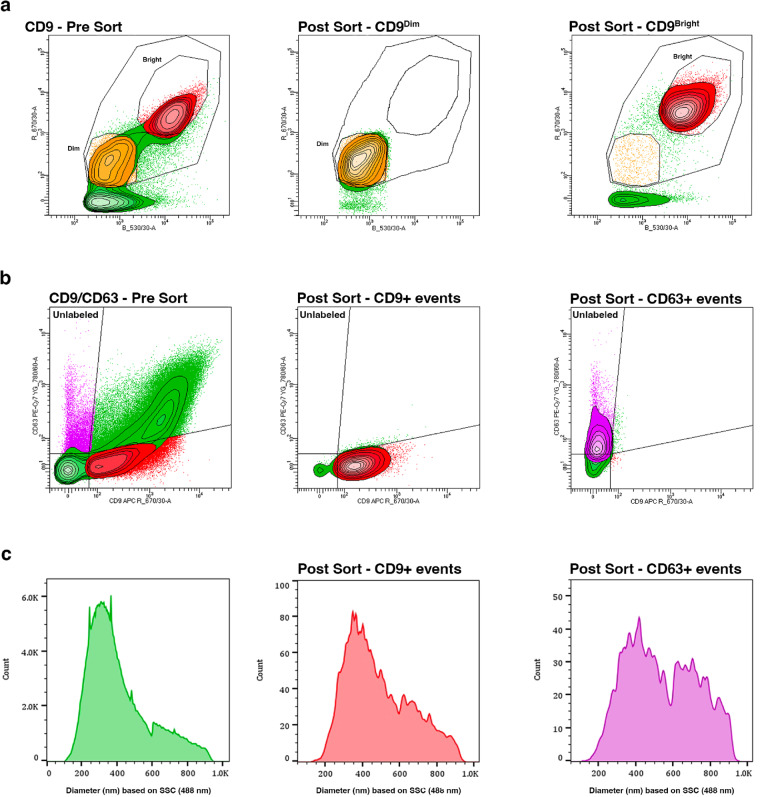
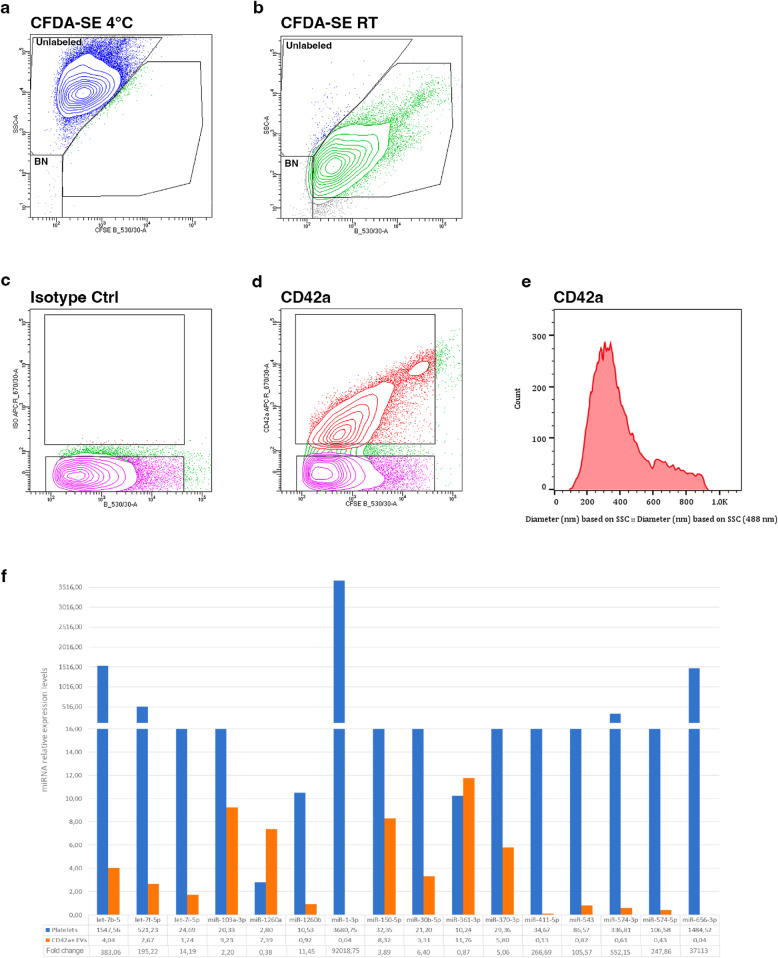
Results: This study presents a robust method for isolating and sorting CD9 + plasma EVs as a proof-of-concept for broader EV subpopulation analyses. Plasma EVs were isolated via sucrose cushion ultracentrifugation, optimizing purity and yield. Flow cytometry with fluorescence threshold triggering was fine-tuned to detect and sort CD9 + EVs, with instrument calibration and parameter adjustments mitigating swarming and improving sorting accuracy. Size exclusion chromatography further enhanced efficiency by reducing background noise. Sorted CD9 + EVs retained size and marker expression, including Syntenin, Alix, Flotillin-1, and CD9, which were enriched post-sorting.

Conclusions: These advancements enable high-purity EV subpopulation isolation, facilitating applications such as identifying cancer biomarkers and developing EV-based targeted therapies.

Supplementary Information: The online version contains supplementary material available at 10.1186/s12575-025-00293-2.

Keywords: Cancer; Extracellular Vesicles; Flow Cytometry; Sorting; Tumor Biomarkers.


Conflict of interest statement

Declarations. Ethics approval and consent to participate: Not applicable. Consent for publication: Not applicable. Competing interests: The authors declare no competing interests.

Figures

Fig. 1
Fig. 1
Definition of the optimal instrumental threshold. Representative dot plots of PBS-EDTA or unstained plasma EVs analyzed by light scattering and fluorescence. Background noise (BN), shown in the lower corner of each plot, represents random sampling of scattered light from the laser. The“Unlabeled” gate indicates the events corresponding to unstained EVs. The analysis was performed with the threshold set at 300 (a) or 200 (b). c Histogram representing the percentage of events falling within the BN and Unlabeled gates when unstained EVs are analyzed with the instrument threshold set to 300 or 200. Data are presented as mean ± standard deviation (SD) from six independent biological replicates (n=6). **** p<0.0001 (Two-way ANOVA and Tukey’s multiple comparison test)
Fig. 2
Fig. 2
Flow cytometry gating strategy and EV concentration assessment. Representative dot plots for EVs stained with 1mM CFDA-SE at 4°C (a) and at RT (b). Representative contour plots of CFSE+ EVs stained with either APC-conjugated CD9 antibody (d) or corresponding non-reactive immunoglobulin of the same isotype (c). These analyses have been performed using the 70 mm nozzle. (e) Histogram showing the percentage of CD9-positive events obtained by analyzing the same plasma-EV samples using four different nozzles (70, 85, 100, and 130 µm). Data are presented as mean ± SD from five independent biological replicates for nozzle 70 µm and three independent replicates for nozzles 85, 100 and 130 µm. (Kruskal-Wallis and Dunn’s multiple comparisons test). f-h Serial dilutions of a highly concentrated EV suspension (stained with CFDA-SE) were prepared and analyzed using a 70 µm nozzle and default sheath fluid pressure. EVs were analyzed at various concentrations, ranging from 1.0e7 to 1.0e10. f Analysis of the number of events per second, (g) SSC-A geometrical mean, and (h) fluorescence (FL1 geometrical mean). (i) Acquisition of three independent replicates of TruCount Tubes at specific time intervals using the 70 µm sort setup with default settings and minimum default sample pressure, in order to calculate the flow rate in standard units
Fig. 3
Fig. 3
SEC removal of unbound dyes increases the signal to noise ratio of labeled EVs. (a, b) Representative dot plots of EVs stained with CFDA-SE and APC-conjugated anti-CD9 antibody, either without (a) or with (b) SEC following EV labeling. (c) Histogram showing the percentage of events within the BN, Unlabeled, or CFSE+ EVs gates, observed when CFDA-SE- and CD9-stained EVs either underwent SEC or skipped this step after labeling. Data are presented as mean ± SD from three independent biological replicates (Pre-SEC) and six independent biological replicates (Post-SEC). **** p>0.0001. (Two-way ANOVA and Tukey’s multiple comparison test)
Fig. 4
Fig. 4
Sorting of EVs based on the differential expression of CD9 alone or in combination with CD63. a Representative contour plot showing CFSE+ EVs (green) stained with APC-conjugated anti-CD9 antibody. A CD9Brightsubpopulation (red), distinguishable from CD9Dim (yellow), is observed depending on the plasma sample analyzed (left panel). Middle and right panels show the sorted EVs, back-gated in a contour plot, to confirm that the CD9Dim (middle panel) and CD9Bright (right panel) subpopulations correctly fall within their respective gates. b Representative contour plot showing CFSE+ EVs stained with both APC-conjugated anti-CD9 (red) and PE-Cy7-conjugated anti-CD63 (violet) antibodies (left panel). Middle and right panels show the sorted EVs, back-gated in a contour plot, to verify that the CD9-positive (middle panel) and CD63-positive (right panel) populations correctly fall within their respective gates. c Histograms showing the normalized diameter (nm), as determined using Rosetta Calibration beads, for pre-sorted CFSE+ events (left panel), post-sorted CD9+ events (middle panel), and post-sorted CD63+ events (right panel)
Fig. 5
Fig. 5
Characterization of plasma EVs before and after sorting. a Representative histograms showing the size distribution by NTA analysis of purified plasma- EVs before and after sorting. The graph on the right shows the calculated mean± SD from six independent biological replicates (n=6) of the median values associated with the NTA analysis (Unpaired t test). b Representative transmission electron microscopy (TEM) images of plasma-EVs before and after sorting. c Western blot analysis of plasma-EVs before and after sorting. Sorting does not affect the protein expression of typical vesicle markers (Alix, Flotillin-1, Syntenin, and CD9), whose expression is present in EVs both before and after sorting. d Western blot analysis on plasma-EVs before and after sorting and plasma depleted of albumin and IgG (depleted Plasma). Typical lipoprotein markers (ApoB100 and ApoA1) and Flotillin-1 have been evaluated in all the considered samples
Fig. 6
Fig. 6
Characterization of CD42a+ EVs. a Representative dot plots for EVs stained with 1mM CFDA-SE at 4°C (a) and at RT (b). Representative contour plots of CFSE+ EVs stained with either APC-conjugated CD42a antibody d or corresponding non-reactive immunoglobulin of the same isotype (c). These analyses have been performed using the 70 mm nozzle.e Histograms showing the normalized diameter (nm), as determined using Rosetta Calibration beads, for pre-sorted CD42a+ events. f Histogram representing the relative expression levels of 16 miRNAs analyzed on both CD42a+ (orange bars) sorted EVs and platelets (blue bars) derived from the same donors

Similar articles

References

    1. Loconte L, Arguedas D, El R, Zhou A, Chipont A, Guyonnet L, et al. Detection of the interactions of tumour derived extracellular vesicles with immune cells is dependent on EV-labelling methods. J Extracell Vesicles. 2023;12:e12384. 10.1002/jev2.12384. - PMC - PubMed
    1. Kumar MA, Baba SK, Sadida HQ, Marzooqi S, Al, Jerobin J, Altemani FH et al. Extracellular vesicles as tools and targets in therapy for diseases. Signal Transduction and Targeted Therapy 2024 9:1 [Internet]. 2024 [cited 2024 Sep 19];9:1–41. Available from: https://www.nature.com/articles/s41392-024-01735-1 - PMC - PubMed
    1. Arraud N, Linares R, Tan S, Gounou C, Pasquet JM, Mornet S, et al. Extracellular vesicles from blood plasma: determination of their morphology, size, phenotype and concentration. J Thromb Haemost. 2014;12:614–27. - PubMed
    1. Liang Y, Lehrich BM, Zheng S, Lu M. Emerging methods in biomarker identification for extracellular vesicle-based liquid biopsy. J Extracell Vesicles [Internet]. 2021 [cited 2024 Sep 19];10. Available from: http://pmc/articles/PMC8114032/. - PMC - PubMed
    1. Buntsma NC, Shahsavari M, Gąsecka A, Nieuwland R, van Leeuwen TG, van der Pol E. Preventing swarm detection in extracellular vesicle flow cytometry: a clinically applicable procedure. Res Pract Thromb Haemost [Internet]. 2023 [cited 2025 May 30];7:100171. Available from: https://pmc.ncbi.nlm.nih.gov/articles/PMC10239693/ - PMC - PubMed

LinkOut - more resources